Sharif University of Technology
Scientia IranicaTransactions A: Civil Engineering www.scientiairanica.com
A new meta-heuristic algorithm: Vibrating particles
system
A. Kaveh
a;and M. Ilchi Ghazaan
ba. Centre of Excellence for Fundamental Studies in Structural Engineering, Iran University of Science and Technology, Narmak, Tehran, P.O. Box 16846-13114, Iran.
b. School of Civil Engineering, Iran University of Science and Technology, Tehran, P.O. Box 16846-13114, Iran. Received 2 September 2016; accepted 7 September 2016
KEYWORDS Vibrating particles system;
Meta-heuristic algorithm;
Global optimization; Optimal design; Truss structures; Frame structures.
Abstract. In this paper, a new meta-heuristic algorithm based on free vibration of single degree of freedom systems with viscous damping is introduced, and it is called Vibrating Particles System (VPS). The solution candidates are considered as particles that gradually approach their equilibrium positions. Equilibrium positions are achieved from the current population and historically best position in order to have a proper balance between diversication and intensication. To evaluate the performance of the proposed method, it is applied to sizing optimization of four skeletal structures including trusses and frames. Results show that the proposed algorithm is a robust and reliable method. © 2017 Sharif University of Technology. All rights reserved.
1. Introduction
In recent years, many meta-heuristics with dierent philosophy and characteristics are introduced and ap-plied to a wide range of elds. The aim of these optimization methods is to eciently explore the search space in order to nd global or near-global solutions. Since they are not problem-specic and do not require the derivatives of the objective function, they have received increasing attention from both academia and industry. Some of the most popu-lar algorithms in this eld are: Genetic Algorithms (GA) [1], Particle Swarm Optimization (PSO) [2], Ant Colony Optimization (ACO) [3], Dierential Evolution (DE) [4], Harmony Search (HS) [5], Bang Big-Crunch (BBBC) [6], Articial Bee Colony (ABC) [7], Galaxy-based Search Algorithm (GbSA) [8], Teaching-Learning-Based Optimization (TLBO) [9], Water Cycle Algorithm (WCA) [10], Colliding Bodies
Optimiza-*. Corresponding author. Tel.: +98 21 44202710; Fax: +98 21 77240398
E-mail address: [email protected] (A. Kaveh)
tion (CBO) [11], Grey Wolf Optimizer (GWO) [12], Ant Lion Optimizer (ALO) [13], Tug of War Opti-mization (TWO) [14], Whale OptiOpti-mization Algorithm (WOA) [15], and Water Evaporation Optimization (WEO) [16].
A novel population-based meta-heuristic algo-rithm based on the damped free vibration of single degree of freedom system is introduced in this paper. This algorithm is called a Vibrating Particles System (VPS) algorithm and considers each candidate solution as a particle that approaches its equilibrium position. By utilizing a combination of randomness and exploita-tion of the obtained results, the quality of the parti-cles improves iteratively as the optimization process proceeds. Here, viability of the proposed method is examined using the optimal design of two truss and two frame structures. The numerical results indicate the eciency of the proposed algorithm compared to some other methods available in literature. The truss and frame examples are among the most popular class of benchmarks previously studied by researchers [17-21].
as follows. The mathematical formulations of the structural optimization are presented in Section 2. The physical background of the VPS algorithm is presented in Section 3, and this new optimization method in detail is introduced in Section 4. The parameter settings are investigated in Section 5. The search behavior of the proposed method and four structural design examples are studied in Section 6. Finally, concluding remarks are provided in Sec-tion 7.
2. Formulation of the structural optimization problems
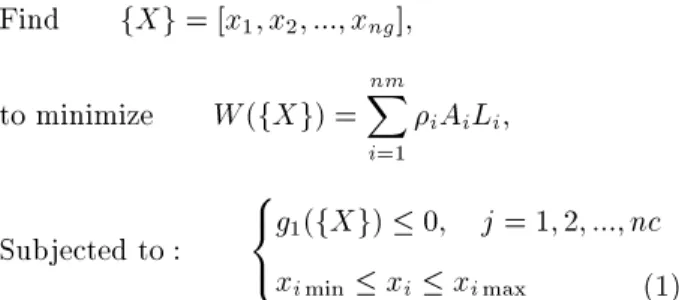
In this study, the objective is to minimize the weight of the structure while satisfying some constraints on stresses and/or buckling and/or deection and/or natu-ral frequencies. The design variables are cross-sectional areas of structural elements. The mathematical formu-lation of these problems is expressed as follows:
Find fXg = [x1; x2; :::; xng];
to minimize W (fXg) =
nm
X
i=1
iAiLi;
Subjected to : 8 < :
g1(fXg) 0; j = 1; 2; :::; nc
xi min xi xi max (1)
where fXg is a vector containing the design variables; ng is the number of design variable;, W (fXg) is the weight of the structure; nm is the number of elements of the structure; i, Ai, and Li denote the material
density, cross-sectional area, and the length of the ith member, respectively; xi min and xi max are the
lower and upper bounds of design variable; xi and
respectively; gj(fXg) denotes design constraints; and
nc is the number of constraints.
To handle the constraints, the well-known penalty approach is employed. Thus, the objective function is redened as follows:
f(fXg) = (1 + "1:v)"2 W (fXg);
v =Xnc
j=1
max[0; gi(fXg)]; (2)
where v denotes the sum of the violations of the design constraints. Constant "1 is set equal to 1, while "2
starts from 1.5 and linearly increases to 3. Such a scheme penalizes the unfeasible solutions more severely as the optimization process proceeds. As a result, in the early stages, the agents are free to explore the search space, but at the end, they tend to choose solutions with no violation.
3. The damped free vibration
A vibration is the oscillating motion of a particle or a body about a position of equilibrium. In general, there are two types of vibrations: (1) free vibration and (2) forced vibration. When the motion is maintained by the restoring forces only, the vibration is said to be a free one, and when a periodic force is applied to the system, the resulting motion is described as a forced vibration. In the study of a vibrating system, the eects of friction can be neglected, resulting in an undamped vibration. However, all vibrations are actually damped to some degree by friction forces. These forces can be caused by dry friction, or Coulomb friction, between rigid bodies by uid friction when a rigid body moves in a uid, or by internal friction between the molecules of a seemingly elastic body. In this section, the free vibration of single degree of freedom systems with viscous damping is studied. The viscous damping is caused by uid friction at low and moderate speeds. Viscous damping is characterized by the fact that the friction force is directly proportional and opposite to the velocity of the moving body [22].
The vibrating motion of a body or system of mass, m, having viscous damping can be characterized by a block and spring of constant, k, as shown in Figure 1. The eect of damping is provided by the dashpot connected to the block, and the magnitude of the friction force exerted on the plunger by the surrounding uid is equal to c _x (c is the coecient of viscous damping, and its value depends on the physical properties of the uid and the construction of the dashpot). If the block is displaced at distance x from its equilibrium position, the equation of motion can be expressed as:
mx + c _x + kx = 0: (3)
Before presenting the solutions to this dierential
equation, we dene critical damping coecient, cc, as:
cc = 2m!n; (4)
!n=
r k
m; (5)
where !n is the natural circular frequency of the
vibration.
Depending on the value of the coecient of viscous damping, three dierent cases of damping can be distinguished: (1) over-damped system (c > cc); (2)
critically damped system (c = cc); (3) under-damped
system (c < cc). The solutions to over-damped and
critically damped system correspond to a non-vibratory motion. Therefore, the system only oscillates and returns to its equilibrium position when c < cc.
The solution of Eq. (3) for under-damped system is as follows:
x(t) = e !ntsin(!
Dt + ); (6)
!D= !n
p
1 2; (7)
= c
2m!n; (8)
where and are constants generally determined from the initial conditions of the problem. !D and
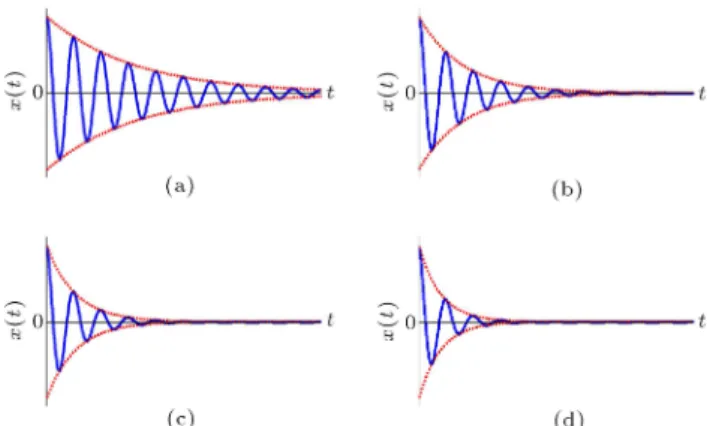
are damped natural frequency and damping ratio, respectively. Eq. (6) is shown in Figure 2, and the eect of damping ratio on vibratory motion is illustrated in Figure 3.
4. A new meta-heuristic algorithm based on the vibrating particles system
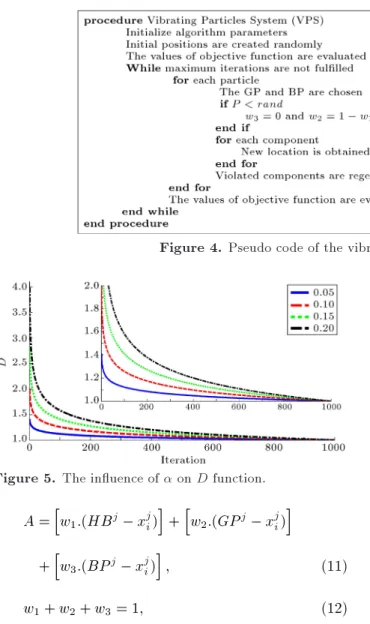
The vibrating particles system is a meta-heuristic method inspired by the free vibration of single degree of freedom systems with viscous damping. The VPS involves a number of candidate solutions representing the particles system. The particles are initialized ran-domly in an n-dimensional search space and gradually approach their equilibrium positions. The pseudo-code of VPS is provided in Figure 4, and the steps involved are given as follows:
Figure 2. Vibrating motion of under-damped system.
Figure 3. Free vibration of systems with four levels of damping: (a) = 5%, (b) = 10%, (c) = 15%, and (d) = 20%.
- Step 1: Initialization: The VPS parameters are set, and the initial positions of all particles are determined randomly in an n-dimensional search space.
- Step 2: Evaluation of candidate solutions: The objective function value is calculated for each par-ticle.
- Step 3: Updating the particle positions: For each particle, three equilibrium positions with dierent weights are dened that the particle tends to approach: (1) the best position achieved so far across the entire population (HB); (2) a Good Particle (GP ); and (3) a Bad Particle (BP ). In order to select GP and BP for each candidate solution, the current population is sorted according to their objective function values in an increasing order, and then GP and BP are chosen randomly from the rst and second halves, respectively.
Figure 3 shows the important eect of damping level on the vibration. In order to model this phenomenon in the optimization algorithm, a descending function that is proportional to the number of iterations is proposed as follows:
D =
iter itermax
; (9)
where iter is the current iteration number, and itermax is the total number of iteration for
optimization process. is a constant, and Figure 5 shows the eect of this parameter on D.
According to the mentioned concepts, the positions are updated by:
xji =w1:D:A:rand1 + HBj
+ w2:D:A:rand2 + GPj
Figure 4. Pseudo code of the vibrating particles system algorithm.
Figure 5. The inuence of on D function.
A =hw1:(HBj xji)
i
+hw2:(GPj xji)
i +hw3:(BPj xji)
i
; (11)
w1+ w2+ w3= 1; (12)
where xji is the jth variable of particle i; w1, w2, and
w3are three parameters to measure the relative
im-portance of HB, GP , and BP , respectively. rand1, rand2, and rand3 are random numbers uniformly distributed in the range of [0,1]. The eects of A and D parameters in Eq. (10) are similar to those of and e !nt in Eq. (6), respectively. Also, the
value of sin(!Dt + ) is considered unity in Eq. (10)
(x(t) = e !ntis shown in Figure 2 by red lines).
A parameter like p within (0, 1) is dened, and it is specied whether the eect of BP must be considered in updating position or not. For each particle, p is compared with rand (a random number uniformly distributed in the range of [0,1]); if p < rand, then w3= 0 and w2= 1 w1.
Three essential concepts, consisting of self-adaptation, cooperation, and competition, are con-sidered in this algorithm. Particle moves towards HB, so the self-adaptation is provided. Any particle has the chance to have inuence on the new position of the other one, so the cooperation between the
par-ticles is supplied. Due to p parameter, the inuence of GP (Good Particle) is more than that of BP (Bad Particle); therefore, the competition is provided.
- Step 4: Handling the side constraints: The particle moves in the search space to nd a better result, and it may violate the side constraints. If any component of the system violates a boundary, it must be regenerated by harmony search-based side constraint-handling approach [23]. In this technique, there is a possibility like HMCR (Harmony Memory Considering Rate) that species whether the violating component must be changed with the corresponding component of the historically best position of a random particle, or it should be determined randomly in the search space. Moreover, if the component of a historically best position is selected, there is a possibility like PAR (Pitch Adjusting Rate) that species whether this value should be changed with the neighboring value or not.
- Step 5: Terminating criterion controlling: Steps 2 to 4 are repeated until a termination criterion is fullled. Any terminating condition can be consid-ered, and in this study, the optimization process is terminated after a xed number of iterations. 5. Search behavior of the vibrating particles
system algorithm
In order to evaluate the eect of the algorithm pa-rameters on the optimization results, a spatial 120-bar dome shaped truss (Section 6.1) is considered as a benchmark. The eect of the population size, the maximum number of structural analyses (population size total number of iterations), , p, w1, and w2
are investigated in this section. In the rst step, these parameters are set to 20, 20000, 0.15, 70%, 0.3, and 0.3, respectively, and then their proper values are obtained one after another.
Tables 1 and 2 summarize the statistical results achieved for dierent values of population size (10,
Table 1. Sensitivity analysis on population size.
10 20 30 40
Best optimized weight (lb) 33,262.75 33,250.27 33,255.65 33,471.79 Worst optimized weight (lb) 33,413.99 33,282.16 33,432.60 33,903.75 Average optimized weight (lb) 33,322.28 33,258.58 33,315.24 33,668.73 Standard deviation on average weight (lb) 51.49 10.31 62.77 130.71 Number of structural analyses for the best design 8,920 19,780 13,060 9,780 Average number of structural analysis 10,106 16,930 12,746 7,958
Table 2. Sensitivity analysis on maximum number of iterations.
750 1000 1250 1500
Best optimized weight (lb) 33,251.34 33,250.27 33,250.83 33,250.24 Worst optimized weight (lb) 33,283.49 33,282.16 33,275.18 33,265.92 Average optimized weight (lb) 33,263.52 33,258.59 33,255.03 33,257.01 Standard deviation on average weight (lb) 12.75 10.31 7.71 5.97 Number of structural analyses for the best design 12,620 19,780 20,800 22,320 Average number of structural analysis 13,094 16,930 18,646 20,802
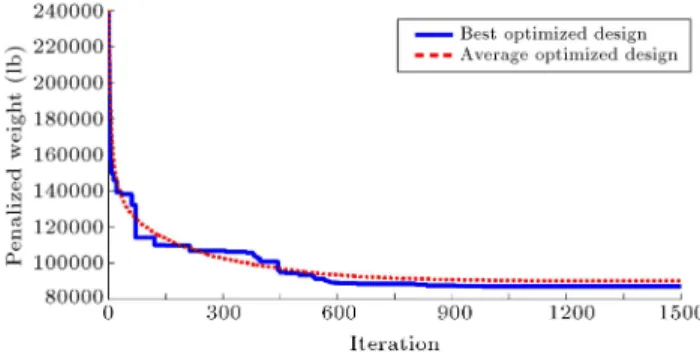
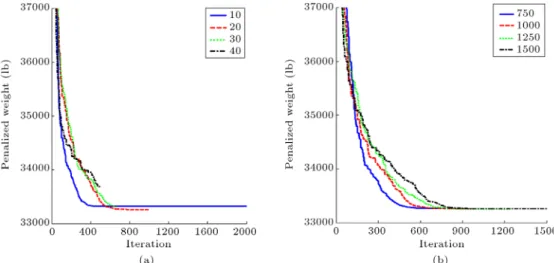
20, 30, and 40) and total number of iterations (750, 1000, 1250, and 1500), respectively. As it can be seen from Table 1, when population size is 20, the VPS has a better performance in terms of the best weight, worst weight, average optimized weight, and standard deviation on average weight. Table 2 demonstrates that considering 1500 iterations can surely be the most ecient value for the total number of iterations. The corresponding average convergence curves are shown in Figure 6. Since the maximum number of structural analyses is set to 20000 in Figure 6(a), the total number of iterations for 10, 20, 30, and 40 particles is 2000, 1000, 667, and 500, respectively, considered as the termination criterion.
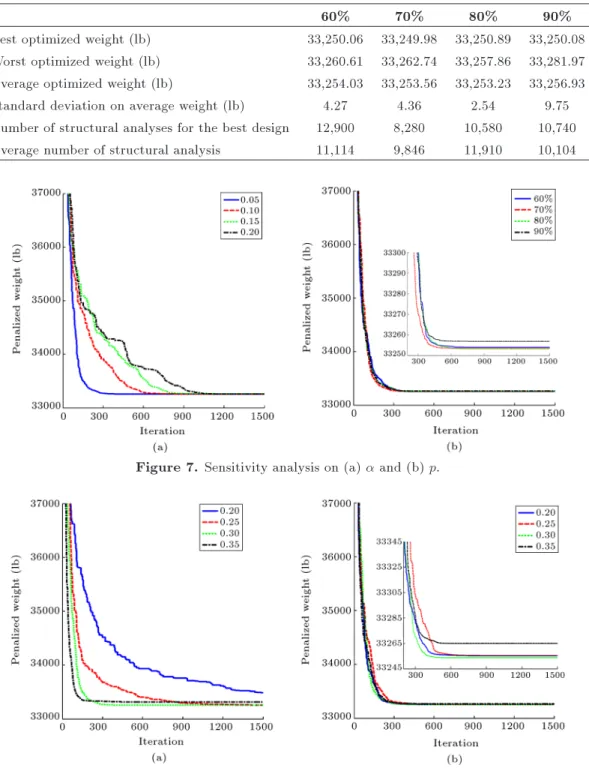
Performance of the VPS with dierent values of (0.05, 0.1, 0.15, and 0.2) and p (60%, 70%, 80%, and 90%) is compared in Tables 3 and 4, respectively. When
is considered as 0.1, the best weight is achieved; however, comparison of the other variables shows that 0.05 is generally the most suitable value for . It can be concluded from Table 4 that 70% is the most ecient value for p. Average convergence histories are depicted in Figure 7. As mentioned before, the inuence of damping level on vibration is similar to the eect of on particles convergence as can be seen in Figure 7(a). To make the curves of Figure 7(b) clearer, the magnied version of lower part is also shown.
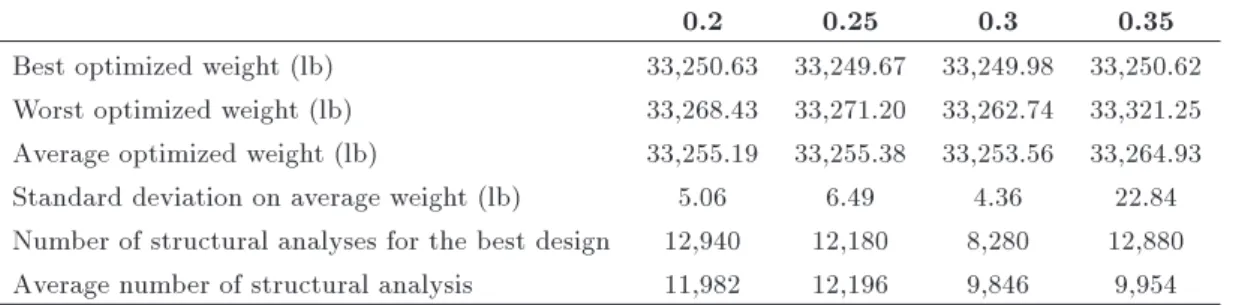
Results of sensitivity analysis on w1 and w2 are
shown in Tables 5 and 6. According to the statistical results reported in these tables, the most suitable performance of the VPS is obtained when the value of 0.3 is considered for w1 and w2. Figure 8 compares the
average convergence curves. It can be seen from Fig-ure 8(a) that by decreasing the value of w1(decreasing
Table 3. Sensitivity analysis on .
0.05 0.1 0.15 0.2
Best optimized weight (lb) 33,249.98 33,249.76 33,250.24 33,249.98 Worst optimized weight (lb) 33,262.74 33,283.46 33,265.92 33,261.82 Average optimized weight (lb) 33,253.56 33,254.91 33,257.01 33,254.02 Standard deviation on average weight (lb) 4.36 10.31 5.97 3.89 Number of structural analyses for the best design 8,280 17,500 22,320 24,180 Average number of structural analysis 9,846 17,794 20,802 24,834
Table 4. Sensitivity analysis on p.
60% 70% 80% 90%
Best optimized weight (lb) 33,250.06 33,249.98 33,250.89 33,250.08 Worst optimized weight (lb) 33,260.61 33,262.74 33,257.86 33,281.97 Average optimized weight (lb) 33,254.03 33,253.56 33,253.23 33,256.93 Standard deviation on average weight (lb) 4.27 4.36 2.54 9.75 Number of structural analyses for the best design 12,900 8,280 10,580 10,740 Average number of structural analysis 11,114 9,846 11,910 10,104
Figure 7. Sensitivity analysis on (a) and (b) p.
Table 5. Sensitivity analysis on w1.
0.2 0.25 0.3 0.35
Best optimized weight (lb) 33,386.52 33,250.16 33,249.98 33,252.79 Worst optimized weight (lb) 33,655.38 33,268.67 33,262.74 33,676.11 Average optimized weight (lb) 33,484.02 33,254.51 33,253.56 33,314.71 Standard deviation on average weight (lb) 83.68 5.38 4.36 130.57 Number of structural analyses for the best design 28,820 28,540 8,280 5,160 Average number of structural analysis 26,456 28,342 9,846 6,520
Table 6. Sensitivity analysis on w2.
0.2 0.25 0.3 0.35
Best optimized weight (lb) 33,250.63 33,249.67 33,249.98 33,250.62 Worst optimized weight (lb) 33,268.43 33,271.20 33,262.74 33,321.25 Average optimized weight (lb) 33,255.19 33,255.38 33,253.56 33,264.93 Standard deviation on average weight (lb) 5.06 6.49 4.36 22.84 Number of structural analyses for the best design 12,940 12,180 8,280 12,880 Average number of structural analysis 11,982 12,196 9,846 9,954
the eect of HB position in updating formula), the explorations are increased, and vice versa. To make the curves of Figure 8(b) clearer, the magnied version of lower part is also added.
In summary, the values of population size, the total number of iteration, , p, w1, and w2 are set
to 20, 1500, 0.05, 70%, 0.3, and 0.3 for all examples, respectively.
6. Test problems and optimization results Four skeletal structures are optimized for minimum weight with the cross-sectional areas of the members being the design variables to evaluate the performance of the proposed method. The examples are classied into 2 groups: The rst group consists of two truss structures with the number of truss bars of 120 and 200, respectively; the second group includes two steel frames having 105 and 168 members, respectively. For all the considered examples, 20 independent optimiza-tion runs are carried out as meta-heuristic algorithms have stochastic nature and their performance may be sensitive to initial population. The algorithm is coded in MATLAB, and the structures are analyzed using the direct stiness method by our own codes.
6.1. A spatial 120-bar dome shaped truss The schematic and element grouping of the spatial 120-bar dome truss are shown in Figure 9. The structure is divided into 7 groups of elements due to symmetry (for the sake of clarity, not all the element groups are numbered in Figure 9). The modulus of elasticity is 30,450 ksi (210 GPa), and the material density is 0.288 lb/in3 (7971.810 kg/m3). The yield stress of steel is
Figure 9. Schematic of the spatial 120-bar dome shaped truss.
taken as 58.0 ksi (400 MPa). The dome is considered to be subjected to vertical loading at all the unsupported joints. These loads are taken as -13.49 kips (-60 kN) at node 1, -6.744 kips (-30 kN) at nodes 2 through 14, and -2.248 kips (-10 kN) in the rest of the nodes. Element cross-sectional areas can vary between 0.775 in2(5 cm2)
Table 7. Performance comparison for the spatial 120-bar dome shaped truss structure. Element
group
Optimal cross-sectional areas (in2) CSS [25] IRO [26] MSPSO [27] CBO [11] TWO [14] WEO [16] Present work
1 3.027 3.0252 3.0244 3.0273 3.0247 3.0243 3.0244
2 14.606 14.8354 14.7804 15.1724 14.7261 14.7943 14.7536
3 5.044 5.1139 5.0567 5.2342 5.1338 5.0618 5.0789
4 3.139 3.1305 3.1359 3.119 3.1369 3.1358 3.1371
5 8.543 8.4037 8.4830 8.1038 8.4545 8.4870 8.4829
6 3.367 3.3315 3.3104 3.4166 3.2946 3.2886 3.3012
7 2.497 2.4968 2.4977 2.4918 2.4956 2.4967 2.4963
Weight (lb) 33,251.9 33,256.48 33,251.22 33,286.3 33,250.31 33,250.24 33,249.98 Average optimized
weight (lb) N/A 33,280.85 33,257.29 33,398.5 33,282.64 33,255.55 33,253.56 Standard deviation
on average weight (lb) N/A N/A 4.29 67.09 25.38 N/A 4.36
Number of
structural analyses 7,000 18,300 15,000 14,960 16,000 19,510 8,280
and 20.0 in2 (129.032 cm2). Displacement limitations
of 0.1969 in (5 mm) are imposed on all nodes in x, y, and z coordinate directions. Constraints on member stresses are imposed according to the provisions of the AISC [24] as follows.
The allowable tensile stresses for tension members are calculated as:
+
i = 0:6Fy; (13)
where Fy is the yield strength.
The allowable stress limits for compression mem-bers are calculated depending on two possible failure modes of the members, known as elastic and inelastic buckling. Therefore: i = 8 > > < > > : h 1 2i
2C2 c
Fy
i =h5
3+8C3ic
3 i
8C3 c
i
for i< Cc 122E
232
i for i Cc
(14) where E is the modulus of elasticity, i is the
slen-derness ratio (i= kli=ri), Cc denotes the slenderness
ratio dividing the elastic and inelastic buckling regions Cc =p22E=Fy, k is the eective length factor (k is
set equal to 1 for all truss members), Li is the member
length, and ri is the minimum radius of gyration.
This truss was previously optimized by CSS (Charged System Search algorithm) [25], IRO (Im-proved Ray Optimization) [26], MSPSO (Multi-Stage Particle Swarm Optimization) [27], CBO (Colliding Bodies Optimization) [11], TWO (Tug of War mization) [14], and WEO (Water Evaporation Opti-mization) [16].
Figure 10. Convergence curves obtained for the 120-bar dome shaped truss problem.
Comparison of the optimal designs obtained by this work with those of the other studies is given in Table 7. It can be seen that the lightest design (i.e., 33,249.98 lb) and the best average optimized weight (i.e., 33,253.56 lb) are found by the proposed method. The VPS converges with the optimum solution after 8,280 analyses. The CSS gives the best result as 33,251,9 lb in 7,000 analyses. However, the VPS achieves this result after 6,400 analyses. Figure 10 compares the convergence curves of the best and the average results obtained by the proposed method. 6.2. A 200-bar planar truss
The second structural optimization problem solved in this research is the optimal design of the 200-bar planar truss schematized in Figure 11. Due to the symmetry, the elements are divided into 29 groups. The modulus of elasticity and the material density of members are 210 GPa and 7,860 kg/m3, respectively. Non-structural
Figure 11. Schematic of the 200-bar planar truss.
A lower bound of 0.1 cm2 is assumed for the
cross-sectional areas. The rst three natural frequencies of the structure must satisfy the following limitations: (f1 5 Hz, f2 10 Hz, f3 15 Hz).
Table 8 presents the results of the optimal designs utilizing CSS-BBBC (a hybridization of the charged system search and the big bang-big crunch algorithms with trap recognition capability) [28], CBO (Colliding Bodies Optimization) [29], ECBO (Enhanced Colliding Bodies Optimization) [29], CBO-PSO (a hybrid of CBO and PSO algorithms) [30], and the proposed method. The weight of the best result obtained by VPS is 2,156.62 kg that is the best among the compared methods. Moreover, the average optimized weight for 20 independent optimization runs of the VPS is 2,159.46 kg which is less than those of all other methods. The rst three natural frequencies of the structure for the best design are 5.0000 Hz, 12.2086 Hz, and 15.0153 Hz. The proposed method requires 16,420 structural analyses to nd the opti-mum solution, while CBO, ECBO, and CBO-PSO require 10,500, 14,700, and 9,000 structural analyses, respectively. It should be noted that the designs found by VPS at 9,000th, 10,500th, and 14,700th analyses are 2,158.35 kg, 2,158.06 kg, and 2,157.72 kg,
Figure 12. Convergence curves obtained for the 200-bar planar truss problem.
Figure 13. Schematic of the 3-bay 15-story frame.
respectively. Comparison of the convergence rates between the best and the average curves of VPS is illustrated in Figure 12.
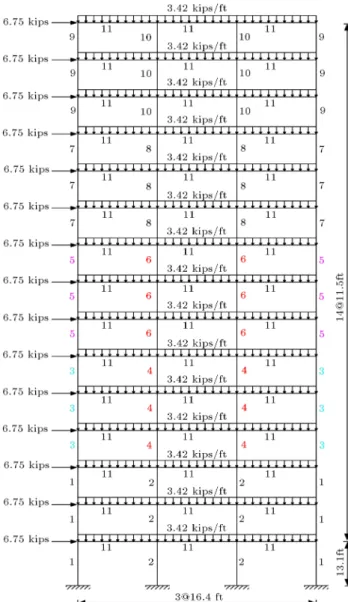
6.3. A 3-bay 15-story frame problem
Figure 13 represents the schematic of the 3-bay 15-story frame. The applied loads and the numbering
Table 8. Performance comparison for the 200-bar planar truss structure. Element
group
Members in the group
Areas (cm2) CSS-BBBC
[28]
CBO [29]
ECBO [29]
CBO-PSO [30]
Present work
1 1,2,3,4 0.2934 0.3059 0.2993 0.2797 0.3031
2 5,8,11,14,17 0.5561 0.4476 0.4497 0.6968 0.4496
3 19,20,21,22,23,24 0.2952 0.1000 0.1000 0.1000 0.1002
4 18,25,56,63,94,101,132,139,170,177 0.1970 0.1001 0.1000 0.1000 0.1000
5 26,29,32,35,38 0.8340 0.4944 0.5137 0.5796 0.5086
6 6,7,9,10,12,13,15,16,27,28,
30,31,33, 34,36,37 0.6455 0.8369 0.7914 0.8213 0.8204
7 39,40,41,42 0.1770 0.1001 0.1013 0.1279 0.1000
8 43,46,49,52,55 1.4796 1.5514 1.4129 1.0152 1.4210
9 57,58,59,60,61,62 0.4497 0.1000 0.1019 0.1000 0.1002
10 64,67,70,73,76 1.4556 1.5286 1.6460 1.5647 1.5900
11 44,45,47,48,50,51,53,54,
65,66,68,69, 71,72,74,75 1.2238 1.1547 1.1532 1.6465 1.1530
12 77,78,79,80 0.2739 0.1000 0.1000 0.2296 0.1277
13 81,84,87,90,93 1.9174 2.9980 3.1850 2.9007 2.9160
14 95,96,97,98,99,100 0.1170 0.1017 0.1034 0.1000 0.1009
15 102,105,108,111,114 3.5535 3.2475 3.3126 3.0133 3.2826
16 82,83,85,86,88,89,91,92,103,
104,106, 107,109,110,112,113 1.3360 1.5213 1.5920 1.6142 1.5856
17 115,116,117,118 0.6289 0.3996 0.2238 0.2755 0.2794
18 119,122,125,128,131 4.8335 4.7557 5.1227 5.0951 5.0680
19 133,134,135,136,137,138 0.6062 0.1002 0.1050 0.1000 0.1004
20 140,143,146,149,152 5.4393 5.1359 5.3707 5.5172 5.4760
21 120,121,123,124,126,127,129,130,141,
142,144,145,147,148,150,151 1.8435 2.1181 2.0645 2.2032 2.1169
22 153,154,155,156 0.8955 0.9200 0.5443 0.8659 0.6939
23 157,160,163,166,169 8.1759 7.3084 7.6497 7.6477 7.6912
24 171,172,173,174,175,176 0.3209 0.1185 0.1000 0.1000 0.1332
25 178,181,184,187,190 10.98 7.6901 7.6754 8.1273 7.9972
26 158,159,161,162,164,165,167,168,179,
180,182,183,185,186,188,189 2.9489 3.0895 2.7178 2.9665 2.7859
27 191,192,193,194 10.5243 10.6462 10.8141 10.2386 10.4331
28 195,197,198,200 20.4271 20.7190 21.6349 20.6364 21.2289
29 196,199 19.0983 11.7463 10.3520 11.6468 10.7392
Weight (kg) 2,298.61 2,161.15 2,158.08 2,195.469 2,156.62
Average optimized
weight (kg) N/A 2,447.52 2,159.93 N/A 2,159.46
Standard deviation on
average weight (kg) N/A 301.29 1.57 N/A 2.79
Number of
of member groups are also shown in this gure. The modulus of elasticity is 29 Msi (200 GPa), and the yield stress is 36 ksi (248.2 MPa). The eective length factors of the members are calculated as kx 0 for
a sway-permitted frame, and the out-of-plane eective length factor is specied as ky = 1:0. Each column is
considered as braced along its length, and the non-braced length for each beam member is specied as one-fth of the span length. Limitations on displacement and strength are imposed according to the provisions of the AISC [31] as follows:
(a) Maximum lateral displacement: T
H R 0; (15)
where T is the maximum lateral displacement, H is the height of the frame structure, and R is the maximum drift index which is equal to 1/300.
(b) The inter-story displacements: di
hi RI 0; i = 1; 2; :::; ns; (16)
where di is the inter-story drift, hi is the story
height of the ith oor, ns is the total number of stories, and RI is the inter-story drift index
(1/300).
(c) Strength constraints: 8
< :
Pu
2cPn+
Mu
bMn 1 0; for
Pu
cPn < 0:2
Pu
cPn+
8Mu
9bMn 1 0; for
Pu
cPn 0:2
(17) where Puis the required strength (tension or
com-pression), Pnis the nominal axial strength (tension
or compression), c is the resistance factor (c =
0:9 for tension, c = 0:85 for compression), Mu is
the required exural strengths, Mn is the nominal
exural strengths, and b denotes the exural
resistance reduction factor (b= 0:90).
The nominal tensile strength for yielding in the gross section is calculated by:
Pn= Ag:Fy: (18)
The nominal compressive strength of a member is computed as:
Pn= Ag:Fcr; (19)
where: 8 < :
Fcr= (0:6582c)Fy; for c 1:5
Fcr= (0:8772
c )Fy; for c> 1:5
(20)
c= rkl
r Fy
E; (21)
where Ag is the cross-sectional area of a member,
Figure 14. Convergence curves obtained for the 3-bay 15-story frame structure.
and k is the eective length factor calculated by [32]:
k = s
1:6GAGB+ 4:0(GA+ GB) + 7:5
GA+ GB+ 7:5 ; (22)
where GA and GB are stiness ratios of columns
and girders at the two end joints, A and B, of the column section, respectively.
Also, in this example, the sway of the top story is limited to 9.25 in (23.5 cm).
Table 9 presents the comparison of the results of the present algorithm with the outcomes of other algorithms. The proposed method yields the least weight for this example, which is 86,985 lb. The other design weights are 95,850 lb by HPSACO (a hybrid algorithm of harmony search, particle swarm, and ant colony) [33], 97,689 lb by HBB-BC (a hybrid big bang-big crunch optimization) [34], 93,846 lb by ICA (Imperialist Competitive Algorithm) [35], 92,723 lb by CSS [36], 86,986 lb by ECBO [37], 93,315 lb by ES-DE (Eagle Strategy with Dierential Evolution) [38], and 91,248 lb by DSOS (Discrete Symbiotic Organisms Search) [39]. The best design of VPS has been achieved in 19,600 analyses. It should be noted that the proposed method achieved about 92,000 lb (the best weight among the other methods except ECBO) after 10,800 structural analyses. Figure 14 provides the convergence rates of the best and average results found by the VPS. Element stress ratio and inter-story drift evaluated at the best design optimized by VPS are shown in Figure 15. The maximum stress ratio is 99.88%, and the maximum inter-story drift is 45.41.
6.4. A 3-bay 24-story frame problem
The last structural optimization problem solved in this study is the weight minimization of the 3-bay 24-story frame schematized in Figure 16. Frame members are collected in 20 groups (16 column groups and 4 beam groups). Each of the four beam element groups is chosen from all 267W-shapes, while the 16
Table 9. Performance comparison for the 3-bay 15-story frame structure. Element
group
Optimal W-shaped sections HPSACO
[33]
HBB-BC [34]
ICA [35]
CSS [36]
ECBO [37]
ES-DE [38]
DSOS [39]
Present work
1 W21111 W24117 W24117 W21147 W1499 W18106 W16100 W1490
2 W18158 W21132 W21147 W18143 W27161 W36150 W32152 W36170
3 W1088 W1295 W2784 W1287 W2784 W1279 W1279 W1482
4 W30116 W18119 W27114 W30108 W24104 W27114 W27114 W24104
5 W2183 W2193 W1474 W1876 W1461 W3090 W2193 W2168
6 W24103 W1897 W1886 W24103 W3090 W1088 W1279 W1886
7 W2155 W1876 W1296 W2168 W1448 W18 71 W2155 W2148
8 W27114 W1865 W2468 W1461 W14 61 W1865 W1461 W1461
9 W1033 W1860 W1039 W1835 W14 30 W828 W1422 W1230
10 W1846 W1039 W1240 W1033 W12 40 W1240 W1443 W1039
11 W2144 W2148 W2144 W2144 W21 44 W2148 W2148 W2144
Weight (lb) 95,850 97,689 93,846 92,723 86,986 93,315 91,248 86,985 Average optimized
weight (lb) N/A N/A N/A N/A 88,410 98,531 N/A 90,066
Standard deviation
on average weight (lb) N/A N/A N/A N/A N/A 3,294 N/A 2,533
Number of
structural analyses 6,800 9,900 6,000 5,000 9,000 10,000 N/A 19,600
Figure 15. Constraint margins for the best design obtained by VPS for the 3-bay 15-story frame problem: (a) Element stress ratio and (b) inter-story drift.
column element groups are limited to W14 sections. The material has a modulus of elasticity equal to E = 29:732 Msi (205 GPa) and a yield stress of fy = 33:4 ksi (230.3MPa). The eective length
factors of the members are calculated as kx 0 for a sway-permitted frame, and the out-of-plane eective length factor is specied as ky = 1:0. All columns
and beams are considered as non-braced along their lengths. Similar to the previous example, the frame
is designed following the LRFD-AISC specication, and it uses an inter-story drift displacement constraint (AISC [31]).
This steel frame structure has been previously optimized by GA (Genetic Algorithm) [40], ACO (Ant Colony Optimization) [41], HS (Harmony Search) [42], CSS [36], ECBO [37], ES-DE [38], and DSOS [39]. Table 10 presents a comparison between the results of the optimal designs reported in the literature and the
Table 10. Performance comparison for the 3-bay 24-story frame structure. Element
group
Optimal W-shaped sections GA
[40]
ACO [41]
HS [42]
CSS [36]
ECBO [37]
ES-DE [38]
DSOS [39]
Present work
1 838292194UB W3090 W3090 W3090 W30 90 W3090 W3090 W3090
2 30510225UB W818 W1022 W2150 W615 W2155 W2162 W818
3 45719182UB W2455 W1840 W2148 W2455 W2148 W2148 W2148
4 30510225UB W821 W1216 W12 19 W68.5 W1045 W2155 W68.5
5 30510225UC W14145 W14176 W14 176 W14145 W14145 W14176 W14176
6 305368129UC W14132 W14176 W14145 W14132 W14109 W14109 W14145
7 30530597UC W14132 W14132 W14109 W1499 W1499 W14120 W1499
8 356368129UC W14132 W14109 W14 90 W1490 W14145 W1482 W1482
9 305305 97UC W1468 W1482 W1474 W1474 W14 109 W1461 W1482
10 20320371UC W1453 W1474 W14 61 W1438 W1448 W1499 W1438
11 305305118UC W1443 W1434 W14 34 W1438 W1438 W1434 W1430
12 15215223UC W1443 W1422 W14 34 W1422 W1430 W1438 W1430
13 305305137UC W14145 W14145 W14145 W1499 W1499 W14120 W1490
14 305305198UC W14145 W14132 W14132 W1499 W14132 W14109 W1499
15 356368202UC W14120 W14109 W14109 W1499 W14109 W1490 W1499
16 356368129UC W1490 W1482 W14 82 W1482 W1468 W1490 W1490
17 356368129UC W1490 W14 61 W1468 W1468 W1468 W1482 W1461
18 356368153UC W1461 W14 48 W1443 W1461 W1468 W1438 W1461
19 20320360UC W1430 W14 30 W1434 W1430 W1461 W1438 W1434
20 25425489UC W1426 W1422 W14 22 W1422 W1422 W1422 W1426
Weight (lb) 251,547 220,465 214,860 212,364 201,618 212,492 209,795 202,998 Average optimized
weight (lb) N/A 229,555 222,620 215,226 209,644 N/A N/A 212,289
Standard deviation on
average weight (lb) N/A 4,561 N/A 2,448 N/A N/A N/A 8,292
Number of
structural analyses 30,000 15,500 13,924 5,500 15,360 12,500 7,500 16,220
present work. The lightest design (i.e., 201,618 lb) is found by ECBO algorithm, and after that, the best de-sign belongs to VPS (i.e., 202,998 lb). The best dede-sign has been achieved at 16,220 analyses for VPS, and it has obtained 209,532 lb after 8,800 analyses, which is the best result compared to the weight achieved by the other method. Figure 17 provides the convergence rates of the best and average results found by the proposed method.
7. Concluding remarks
This paper presents a new population-based meta-heuristic algorithm, called Vibrating Particles
Sys-tem (VPS). This method is inspired by the damped free vibration of a single degree of freedom system. In the optimization process, particles gradually ap-proach their equilibrium positions. To maintain the balance between local search and global search, these equilibrium positions are obtained from the current population and the historically best position. Two trusses and two frame benchmark structures are stud-ied in order to show the performance of the VPS in terms of diversication, intensication, local optima avoidance, and convergence speed. The proposed algorithm nds superior optimal designs for three of the four problems investigated, illustrating the capability of the present method in solving constrained problems.
Figure 16. Schematic of the 3-bay 24-story frame.
Moreover, the average optimized results and standard deviation on averages results obtained by VPS are competitive with the other optimization methods. The convergence speed comparisons also reveal the fast-converging feature of the presented algorithm. For future research, it would be interesting to apply VPS to other optimization problems in dierent elds of science and engineering.
Figure 17. Convergence curves obtained for the 3-bay 24-story frame problem.
Acknowledgments
The rst author is grateful to the Iran National Science Foundation for the support.
References
1. Holland, J.H. \Genetic algorithms", Sci Am., 267, pp. 66-72 (1992).
2. Kennedy, J. and Eberhart, R.C. \Particle swarm opti-mization", In Proceeding of IEEE of the International Conference on Neural Networks, pp. 1942-1948 (1995).
3. Dorigo, M., Maniezzo, V. and Colorni, A. \Ant system: optimization by a colony of cooperating agents", IEEE Trans Syst Man Cybernet Part B: Cybernet, 26(1), pp. 29-41 (1996).
4. Storn, R. and Price, K. \Dierential evolution-a simple and ecient heuristic for global optimization over continuous spaces", J. Global Optim., 11, pp. 341-359 (1997).
5. Geem, Z.W., Kim, J.H. and Loganathan, G.V. \A new heuristic optimization algorithm: harmony search", Simulat., 76(2), pp. 60-68 (2001).
6. Erol, O.K. and Eksin, I. \A new optimization method: big bang-big crunch", Adv. Eng. Softw., 37, pp. 106-111 (2006).
7. Karaboga, D. and Basturk, B. \A powerful and e-cient algorithm for numerical function optimization: articial bee colony (ABC) algorithm", J. Global Optim., 39, pp. 459-471 (2007).
8. Shah-Hosseini, H. \Principal components analysis by the galaxy-based search algorithm: a novel metaheuris-tic for continuous optimization", Int. J. Comput. Sci. Eng., 6, pp. 132-140 (2011).
9. Rao, R.V., Savsani, V.J. and Vakharia, D.P., \Teach-ing-learning-based optimization: a novel method for constrained mechanical design optimization prob-lems", Comput Aided Des., 43(3), pp. 303-315 (2011).
10. Eskandar, H., Sadollah, A., Bahreininejad, A., and Hamdi, M. \Water cycle algorithm-A novel meta-heuristic optimization method for solving constrained
engineering optimization problems", Comput. Struct., 110, pp. 151-166 (2012).
11. Kaveh, A. and Mahdavi, V.R. \Colliding bodies op-timization: A novel meta-heuristic method", Comput. Struct., 139, pp. 18-27 (2014).
12. Mirjalili, S., Mirjalili, S.M. and Lewis, A. \Grey wolf optimizer", Adv. Eng. Softw., 69, pp. 46-61 (2014).
13. Mirjalili S. \The ant lion optimizer", Adv. Eng. Softw., 83, pp. 80-98 (2015).
14. Kaveh, A. and Zolghadr, A. \A novel metaheuristic algorithm: tug of war optimization", Int. J. Optim. Civil. Eng., 6(4), pp. 469-492 (2016).
15. Mirjalili, S. and Lewis, A. \The whale optimization algorithm", Adv. Eng. Softw., 95, pp. 51-67 (2016).
16. Kaveh, A. and Bakhshpoori, T. \Water evaporation optimization: A novel physically inspired optimization algorithm", Comput. Struct., 167, pp. 69-85 (2016).
17. Lee, K.S. and Geem, Z.W. \A new structural optimiza-tion method based on the harmony search algorithm", Comput. Struct., 82, pp. 781-798 (2004).
18. Hasancebi, O., Carbas, S., Dogan, E., Erdal, F. and Saka, M.P. \Performance evaluation of metaheuristic search techniques in the optimum design of real size pin jointed structures", Comput. Struct., 87(5-6), pp. 284-302 (2009).
19. Baghlani, A., Makiabadi, M.H. and Rahnema, H. \A new accelerated rey algorithm for size optimization of truss structures", Sci. Iran., Transactions A, Civil Engineering, 20(6), pp. 1612-1625 (2013).
20. Baghlani, A. and Makiabadi, M.H. \An enhanced particle swarm optimization for design of pin con-nected structures", Sci. Iran., Transactions A, Civil Engineering, 20(5), pp. 1415-1432 (2013).
21. Kazemzadeh Azad, S. and Hasancebi, O. \Compu-tationally ecient discrete sizing of steel frames via guided stochastic search heuristic", Comput Struct., 156, pp. 12-28 (2015).
22. Beer, F.P., Johnston, Jr E.R., Mazurek, D.F., Corn-well, P.J. and Self, B.P., Vector Mechanics for En-gineers, McGraw-Hill Companies", New York, USA (2013).
23. Kaveh, A. and Talatahari, S. \Particle swarm opti-mizer, ant colony strategy and harmony search scheme hybridized for optimization of truss structures", Com-put. Struct., 87(5), pp. 267-283 (2009).
24. American Institute of Steel Construction (AISC)., Manual of Steel Construction: Allowable Stress De-sign., American Institute of Steel Construction (1989).
25. Kaveh, A. and Talatahari, S. \Optimal design of skeletal structures via the charged system search al-gorithm", Struct. Multidiscip. Optim., 41, pp. 893-911 (2010).
26. Kaveh, A., Ilchi Ghazaan, M. and Bakhshpoori, T. \An improved ray optimization algorithm for design
of truss structures", Period Polytech-Civ. Eng., 57(2), pp. 97-112 (2013).
27. Talatahari, S., Kheirollahi, M., Farahmandpour, C. and Gandomi, A.H. \A multi-stage particle swarm for optimum design of truss structures", Neural Comput. Appl., 23, pp. 1297-1309 (2013).
28. Kaveh, A. and Zolghadr, A. \Truss optimization with natural frequency constraints using a hybridized CSS-BBBC algorithm with trap recognition capability", Comput. Struct., 102-103, pp. 14-27 (2012).
29. Kaveh, A. and Ilchi Ghazaan, M. \Enhanced colliding bodies algorithm for truss optimization with frequency constraints", J. Comput. Civil Eng., 29(6), (2014).
30. Kaveh, A. and Mahdavi, V.R. \A hybrid CBO-PSO algorithm for optimal design of truss structures with dynamic constraints", Appl. Soft. Comput., 34, pp. 260-273 (2015).
31. American Institute of Steel Construction (AISC), Manual of Steel Construction: Load and Resistance Factor Design., American Institute of Steel Construc-tion (2001).
32. Dumonteil, P. \Simple equations for eective length factors", Eng. J. AISC., 29(3), pp. 111-115 (1992).
33. Kaveh, A. and Talatahari, S. \Hybrid algorithm of harmony search, particle swarm and ant colony for structural design optimization", Studies in Computa-tional Intelligence, 239, pp. 159-198 (2009).
34. Kaveh, A. and Talatahari, S. \A discrete Big Bang-Big Crunch algorithm for optimal design of skeletal structures", Asian J. Civil Eng., 11(1), pp. 103-122 (2010).
35. Kaveh, A. and Talatahari, S. \Optimum design of skeletal structure using imperialist competitive algo-rithm", Comput. Struct., 88, pp. 1220-1229 (2010).
36. Kaveh, A. and Talatahari, S. \Charged system search for optimal design of frame structures", Appl. Soft. Comput., 12, pp. 382-393 (2012).
37. Kaveh, A. and Ilchi Ghazaan, M. \A comparative study of CBO and ECBO for optimal design of skeletal structures", Comput. Struct., 153, pp. 137-147 (2015).
38. Talatahari, S., Gandomi, A.H., Yang, X.S. and Deb, S. \Optimum design of frame structures using the eagle strategy with dierential evolution", Eng. Struct., 91, pp. 16-25 (2015).
39. Talatahari, S. \Symbiotic organisms search for opti-mum design of frame and grillage system", Asian J. Civil Eng., 17(3), pp. 299-313 (2016).
40. Saka, M.P. and Kameshki, E.S. \Optimum design of frame multi-story sway steel frames to BS 5950 using a genetic algorithm", Advances in Engineering Computational Technology, pp. 135-141 (1998).
41. Camp, C.V., Bichon, B.J. and Stovall, S. \Design of steel frames using ant colony optimization", J. Struct. Eng., 131, pp. 369-379 (2005).
using harmony search algorithm", Struct Multidiscip Optim., 36, pp. 393-401 (2008).
Biographies
Ali Kaveh was born in 1948 in Tabriz, Iran. After graduation from the Department of Civil Engineering in the University of Tabriz in 1969, he continued his studies on Structures at Imperial College of Science and Technology in London University and received his MSc, DIC and PhD degrees in 1970 and 1974, respectively. He then joined the Iran University of Science and Technology. Professor Kaveh is the author
of 540 papers published in international journals and 145 papers presented at national and international conferences. He has authored 23 books in Persian and 8 books in English published by Wiley, Research Studies Press, American Mechanical Society, and Springer. Majid Ilchi Ghazaan was born in Karaj, Iran, in 1988. He is currently pursuing the Ph.D. degree in Earthquake Engineering from the Department of Civil Engineering, Iran University of Science and Technology (IUST), Tehran, Iran. His main research interests include evolutionary algorithms and their applications in real-world problems.

![Table 8. Performance comparison for the 200-bar planar truss structure. Element group Members inthe group Areas (cm 2 )CSS-BBBC [28] CBO[29] ECBO[29] CBO-PSO[30] Presentwork 1 1,2,3,4 0.2934 0.3059 0.2993 0.2797 0.3031 2 5,8,11,14,17 0.5561 0.4476 0.4497 0](https://thumb-us.123doks.com/thumbv2/123dok_us/8378967.2225852/10.892.66.811.179.1151/table-performance-comparison-planar-structure-element-members-presentwork.webp)