Sharif University of Technology
Scientia IranicaTransactions D: Computer Science & Engineering and Electrical Engineering www.scientiairanica.com
Multi-objective optimal location of SSSC and
STATCOM achieved by fuzzy optimization strategy
and harmony search algorithm
A. Esmaeili Dahej, S. Esmaeili
and A. Goroohi
Department of Electrical Engineering, Shahid Bahonar University of Kerman, Kerman, Iran. Received 15 July 2012; received in revised form 11 January 2013; accepted 6 May 2013
KEYWORDS Flexible Ac
Transmission Systems (FACTS);
Harmony Search Algorithm (HSA); Fuzzy system; Optimal location; Voltage stability; Power loss; Cost of investment; Total fuel cost.
Abstract. Some applications of FACTS devices prove them to be proper and eective instruments for controlling the technical parameters of the power systems. Applying a suitable objective function to optimal placement of FACTS devices plays a very important role in economic improvement of a power market. In this paper, an eective method has been presented for optimal placement of FACTS devices in order to increase the voltage stability and to decrease the losses, considering the investment cost of the FACTS devices and the total fuel cost of the power system. Therefore, the Harmony Search Algorithm (HSA) is applied in this paper for simultaneous locating as well and for determining the sizes of both the series and parallel devices (SSSC, STATCOM) in a multi-objective structure. Since the optimization is multi-purpose, a fuzzy system is used in order to nd the best solution. The eectiveness of the proposed method is demonstrated using the modied 30-bus IEEE test system. Comparing the results achieved by the suggested algorithm with those of the PSO and GA, the proper eciency of the presented algorithm will be enforced.
c
2013 Sharif University of Technology. All rights reserved.
1. Introduction
FACTS devices can facilitate networks to control the power ows in transmission lines with their unique structures. Thus, these devices can improve the stability of transmission lines and the system security as well [1].
Applying the FACTS devices seems to be more economical, since these devices do not impose any extra costs at the time of operation other than the installa-tion costs [2]. The FACTS devices can simultaneously control both the active and reactive powers and the
*. Corresponding author. Tel.: +98 3413202529; Fax: +98 3413235900
E-mail addresses: [email protected] (A. Esmaeili Dahej); s [email protected] (S. Esmaeili); ali.goroohi @gmail.com (A. Goroohi)
monitor voltage range. They can, moreover, reduce the power ow on the overloaded lines through creating an appropriate voltage level. On the other hand, FACTS devices can improve the whole voltage stability, thus reducing the power system losses [3,4].
A single-type FACTS device can be categorized into one of the three groups of parallel, series and/or parallel{series. Multi-type FACTS devices refer to employing two or more types of FACTS controllers (e.g. `series and shunt' or `shunt and combined'). Although using multi-type FACTS may impose higher installation costs, through improving the system op-erating condition, it provides more advantages com-pared to one or more single-type FACTS devices. In addition, multi-type FACTS devices can enhance dierent system parameters in a multi-objective op-timization problem. These FACTS devices are rea-sonable combinations of the new generation of FACTS
devices including SSSC (series), STATCOM (parallel) and UPFC (parallel-series) [5]. Some eects of the FACTS devices on the security of the power system are considered in the previous studies [6,7]. One of the distinct applications of FACTS devices is to overcome the voltage instability in power systems. Actually, the voltage stability is the capability of a system in keeping the acceptable magnitude of voltage for buses of the system under all present conditions [8-10]. The ability of transmitting the reactive power from the bus of pro-duction to the place of consumption in the persistent status of the power system is one of the most signicant issues in voltage stability. Generally, a power system becomes unstable in such situations as creation of an accident in the system, increase of the consumable load, or a change in the condition of the system due to a continuous and uncontrollable voltage decrease.
The issue of voltage stability can be analyzed using such methods as P-V and Q-V curves; the voltage stability is, thus, highly dependent on the balance of the reactive power, as well as that of the active power [11]. Increasing the loading on the power system will bring about a large number of errors, making the functions of the power systems more complicated and less secure. Voltage instability is a main issue concern-ing the design and function of the power system [12].
A number of the previous studies have worked on the heuristic approaches and intelligent algorithms in locating the FACTS devices in power systems, includ-ing the Genetic Algorithm (GA) [13], the Evolutionary Planning (EP) [14] and the Particles Swarm Optimiza-tion method (PSO) [15]; the majority of the studies carried out in this regard, however, have focused on one single objective such as cost reduction [16], increased percentage of system security limitations or system loadability improvement.
The present paper applied the HSA for an optimal allocation of STATCOM and SSSC in order to increase the voltage stability, and to decrease the losses of the system by considering the installation costs of these FACTS devices in a way that the total fuel cost becomes optimal. This type of formulation has not so far been considered in related studies. Also fuzzy system is employed in order to give appropriative weight to the terms of objective function. The HSA was rst presented by Geem, et al. in 2001; various similar studies conducted in this regard show that HSA can operate faster than other optimization methods and has been successfully applied to dierent discrete optimization problems such as Sudoku puzzle solving [17], and Travelling Salesperson Problem (TSP) [18].
Our proposed method was tested on the modied 30-bus IEEE system, indicating the eectiveness of the simultaneous use of both series and parallel types of FACTS devices in improving the voltage stability, as well as in decreasing the losses of the system. A
comparison of obtained results with those obtained using PSO and GA methods was also presented in order to emphasize the ability of our proposed method. The results further showed that the HSA method can signicantly increase both the convergence rate and the accuracy of the answers. Thus, Harmony Search Algorithm (HSA) may outperform other methods. The remainder of this paper is organized as follows: Sec-tion 2 explains the problem formulaSec-tion and objective function. Section 3 introduces the static voltage stability index. Modeling FACTS devices (SSSC and STATCOM) and the extended power ow algorithm including FACTS devices are presented in Section 4 and 5, respectively. Harmony Search Algorithm (HSA) is also addressed in Section 6. Section 7 presents numerical results of application of HSA algorithm in test system. Finally, the major contributions and conclusions are summarized in Section 8.
2. Problem formulation and objective function A multi-objective optimization was considered in this paper to nd the best capacity and location of SSSC and STATCOM to fulll the goal function including the following four objectives: loadability limit value, active power loss value, total fuel cost and investment cost of the proposed FACTS devices.
2.1. Objective function
As mentioned above, the problem was a multi-objective optimization, represented as normalized:
The rst function is related to voltage stability. The objective was to maximize the loadability limit value or minimize F1as follows:
minimizef1= Normal Loadability(Loadability) : (1) The formulation of loadability limit was expressed in Section 3.
The second objective function is to minimize the total fuel cost that can be expressed as:
minimizef2= NG X i=1
(ai+ biPGi+ ciPGi2 ) ($=h); (2) where PGiis the active power output of the ith gener-ator, NG is the total number of dispatched generators, and ai, bi, ci are the fuel cost coecients of the ith generator.
The third objective function is related to the active power loss, as well as the investment cost. The objective was to minimize the active power loss and investment cost of the proposed FACTS devices. It can be expressed as:
minimizef3= Investment cost Ploss: (3) In Eq. (3), the investment cost and Plossare normalized
by Eqs. (4) and (5), respectively: Investment cost
=total investment cost investment costinvestment cost min max investment costmin ; (4) Ploss= PPloss;t
loss,normal; (5)
where the parameters are as follows:
investment costmin and investment costmax: Mini-mum and maxiMini-mum of the investment cost of FACTS devices,
Ploss;t: The total active power loss,
Ploss,normal: Active power loss for the base case. Since dierent terms of the objective function were in various ranges, in order to balance the terms, normalization was employed in this study.
2.2. Multi-objective optimization-based fuzzy system
In the next step, using expert knowledge, fuzzy theory was employed to balance the ranges of dierent terms of objective function changes through which all the objective functions were combined with each other in the form of a Fuzzy Inference System (FIS). In this way, a multi-objective optimization problem can be converted into a single-objective one that can be expressed as:
F = min(f1; f2; f3):
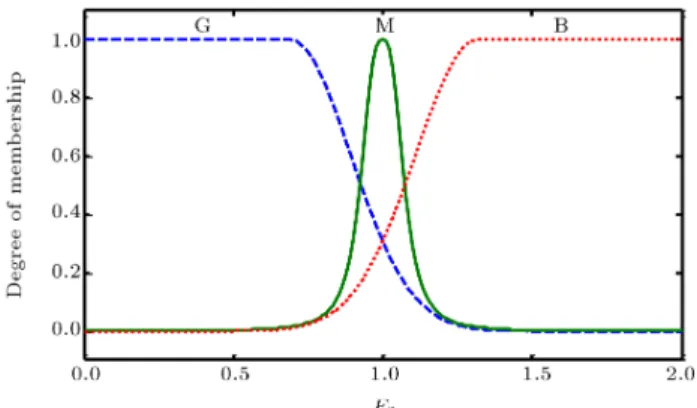
To achieve this goal, the values of each objective func-tions, considered as an input in fuzzy inference system, was rstly divided into several regions, using fuzzy membership functions. Then, the relations between the inputs and the nal output (i.e. the nal objective function to be optimized), was made by the appropriate rules [19].
Since it is possible to select dierent membership functions, as well as dierent rules, this can change the nal objective function which, in turn, may lead to dierent solutions.
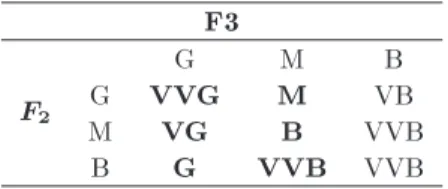
Figures 1 to 4 show the membership functions of the inputs and outputs of fuzzy system. Tables 1 to 3 illustrate those fuzzy rules employed for dening the optimum location of multi-type FACTS devices.
In Tables 1-3, G stands for good, M stands for moderate, B stands for bad, V stands for very and Ex stands for excellent.
2.3. FACTS devices cost function
Usinpagebreak[3] Siemens AG Database [20], the cost function for STATCOM and SSSC were developed as
Figure 1. Membership function for F1.
Figure 2. Membership function for F 2.
Figure 3. Membership function for F 3.
Figure 4. Membership function for output of fuzzy system.
Table 1. Fuzzy rules when the F1 is bad.
F3 F2
G M B
G G B VVB
M M VB VVB
B B VVB VVB
Table 2. Fuzzy rules when the F1 is medium.
F3 F2
G M B
G VVG M VB
M VG B VVB
B G VVB VVB
Table 3. Fuzzy rules when the F1 is good.
F3 F2
G M B
G Ex M VB
M VVG M VB
B VG VB VVB
follows:
CSTATCOM= 0:000375S2 0:3041S + 162:4
(US$/KVAr); (6)
CSSSC= 0:00039S2 0:324S + 173:42
(US$/KVAr): (7)
The optimal cost of installation of FACTS devices was as follows [21]:
Minimize IC = C S 1000
8760 5 ($/h); (8)
where IC is based on US$/h, C is the cost of FACTS devices based on US$/ KVAR, and S is the operating factor of FACTS devices based on MVAr, developed as follows:
S = jQ2j jQ1j ; (9)
here, Q2 is the reactive power of the network after installing the FACTS devices, and Q1 is the current reactive power in the network before installing the FACTS devices. In this paper, the ve-year planning period is applied to evaluate the cost function. 3. Static voltage stability index
The static voltage stability in a power system is imposed to the level of the capability of that system in keeping the magnitude of its own voltage against the increase of the consuming loads [8]. If such capability does not exist, the voltage instability might occur.
Evaluating the degree of security in the power systems requires an index from the viewpoint of the static voltage stability in order to:
1. Create an evident engineering perception for the user;
2. Be free from any need to future denitions and explanations;
3. Directly express the level of the tolerability of the system against the increase of the consuming load [9].
In this paper, index of the loadability level, showing the maximum imposable load on a power system with keep-ing its static stability of the voltage, was considered as the evaluative index of the degree of security. From the engineering point of view, the loadability limit is a realistic index, as far as it can provide the system operator a more practical sense of system security mar-gin in terms of such enmar-gineering parameters as system loading. Thus, the level of loading in the power systems can be modeled as a limited non-linear optimizing issue in which the limitations of equality are the algebraic equations of the power ow in a power system.
The presented model may be evaluated by means of a non-linear optimizing issue which can be solved us-ing the Repeated Power Flow (RPF); the RPF method can increase the loadability limit via increasing the complex load with uniform power factor at every load, thus increasing the injected real power at generator buses in the generation in incremental steps so much, so that a collapse will take place in the network and the power ow will not converge.
The mathematical formulation of the loadability limit, using RPF, can be described as follows:
Maximize Subject to:
8 > > > > > > > < > > > > > > > :
PGi PDi n P
j=1jUij : jUjj (Gijcos ij+ Bijsin ij) = 0 QGi QDi
n P
j=1jUij : jUjj (Gijsin ij+ Bijcos ij) = 0 (10)
: Scalar parameter representing the increase in bus load or generation, = 0 corresponds to base case, and = max corresponds to the collapse state;
PGi; QGi: Real and reactive power generation at bus i;
jUij ; jUjj : Voltage magnitude at bus i and bus j; Gij; Bij : Real and imaginary parts of the ijth
element of bus admittance matrix; ij : Voltage angle of bus i and bus j;
n : Total number of buses.
In the power ow, equations PGi, PDi and QDi are calculated as:
PGi= PGi0 :(1 + :KGi); (11)
PDi= PDi0 :(1 + :KDi); (12)
QDi = Q0Di:(1 + :KDi); (13)
where: P0
Gi: Original real power generation at bus i in the generation buses;
P0
Di; Q0Di: Original real and reactive load demands at bus i in the load buses; KGi; KDi: Constants used for specifying the
change rate in the generation and the load as varies.
Loadability limit was calculated as follows: max : PT =
n X i=1
PDi(max) Max.Loadability; (14)
where Pn
i=1PDi(max) represents the total load in power systems when = max.
4. Modeling the FACTS devices
In the present paper, the STATCOM and SSSC devices were applied to improve the voltage stability and to decrease the losses, considering the installation costs of the devices, as well as the total fuel costs of the power plants.
4.1. SSSC
SSSC is a series synchronous voltage-type compen-sator, analogous to an ideal electro-magnetic generator, which can produce a set of alternating voltages at the desired fundamental frequencies with controllable amplitude and phase angles [22]. If such series con-necting voltage-source is located between nodes i and j in a power system, the series voltage source can be modeled with an ideal series voltage Vse in series, with a reactance Xse , as shown in Figure 5. Vj models an ideal voltage source and V0
i represents a ctitious voltage behind the series reactance.
The series voltage source Vse was controllable in magnitude and phase, i.e. Vse = rViej, where 0 <
Figure 5. Representation of a series voltage source [19].
Figure 6. Replacement of voltage source by current source [19].
Figure 7. Injection model for a series-connected VSC [19].
r < rmax and 0 < < 2. The injection model was obtained by replacing the voltage source by the current source, Ise= jbseVsein parallel with line, where bse= 1=Xse was , as shown in Figure 6. The injection model for a series-connected voltage source converter is shown in Figure 7.
The current source Ise corresponded to the injec-tion powers Si;sssc and Sj;sssc, where [19]:
Si;sssc= Vi( Ise); (15)
Sj;sssc= Vj(Ise): (16)
The injection power Si;sssc and Sj;sssc were simplied into [19]:
Si;sssc=Vi[jbserViej]
= bserVi2sin jbserVi2cos ; (17) Sj;sssc= Vj[jbserViej]= bserViVjsin(i j+) + jbserViVjcos(i j+ ); (18)
Pi;sssc= rbseVi2sin(); (19)
Qi;sssc= rbseVi2cos(); (21)
Qj;sssc= rbseViVjcos(i j+ ): (22)
4.2. STATCOM
STATCOM is a second generation FACTS device used in shunt reactive power compensation. STATCOM is a combination of a voltage-sourced converter and an inductive reactance and shunt, connected to power system [23]. STATCOM circuit is shown in Figure 8. The DC circuit is described by the following dierential equations, in terms of the voltage Vdcof the capacitor.
V: dc= CVP
dc Vdc RCC
R(P2+ Q2) CV2
i Vdc : (23)
The power injection at the AC bus to which the STATCOM is connected had the following form:
Pi;STATCOM=Vi2G kVdcViG cos(i )
kVdcViB sin(i ); (24)
Qi;STATCOM= Vi2B + kVdcViB cos(i )
kVdcViG sin(i ); (25)
Figure 8. Voltage-source model of STATCOM [20].
where:
k =p3=8m:
Since the STATCOM device operates to compensate only the reactive power, there must be no active power produced by the device. Therefore, Pi;STATCOM= 0. 5. Power ow including FACTS devices
The discussed models of FACTS devices have been implemented in conventional Newton-Raphson (N-R) power-ow algorithm [24]. However, it is needed to extend the implementation for multi-type FACTS applications. Accordingly, the NRS equations can be presented as follows:
P = f1(V; ; G; B); (26)
Q = f2(V; ; G; B); (27)
P Q
n =
H N
J L
n
V=V n
; (28)
where P and Q are the real and the reactive power mismatch vector, respectively; V and are the vectors of the incremental changes in nodal voltages; H, N, J and L are the basic elements of the Jacobian matrix, and n stands for the iteration number. To include the FACTS devices in the above formulation, some additional elements of the Jacobian matrix ((H =
Horg+Hfacts) and for N, J, and L elements) should be
extracted due to the injections of the FACTS devices at the buses i and j. These new additional elements are shown in Table 4. Furthermore, the power-mismatches equations at bus i and bus j need to be changed based on the following equations:
Pi= Pi;G Pi;L+ Pi;facts Pi;cal; (29)
Pi= Pj;G Pj;L+ Pj;facts Pj;cal; (30)
Qi= Qi;G Qi;L+ Qi;facts Qi;cal; (31)
Qj = Qj;G Qj;L+ Qj;facts Qj;cal: (32)
Table 4. Additional elements of jacobian matrix including FACTS devices.
For bus i
When i = j Hiifacts Niifacts Jiifacts Lfactsii @Pi;facts
@i Vi
@Pi;facts
@Vi
@Qi;facts
@i Vi
@Qi;facts
@Vi When i 6= j Hijfacts Nijfacts Jijfacts Lfactsij
@Pi;facts
@j Vj
@Pi;facts
@Vj
@Qi;facts
@j Vj
@Qi;facts
@Vj
For bus j
When i = j Hjjfacts Njjfacts Jjjfacts Lfactsjj @Pj;facts
@j Vj
@Pj;facts
@Vj
@Qj;facts
@j Vj
@Qj;facts
@Vj When i 6= j Hjifacts Njifacts Jjifacts Lfactsji
@Pj;facts
@i Vi
@Pj;facts
@Vi
@Qj;facts
@i
@Qj;facts
Figure 9. Flow diagram of FDLF.
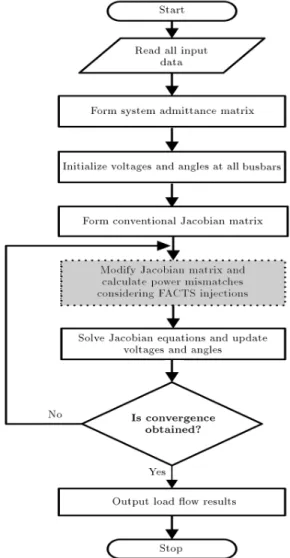
The extended algorithm for solving the power-ow problem including the FACTS devices was imple-mented in this study via Matlab code. The developed program was referred to as FACTS Devices Load-Flow (FDLF), being illustrated by a owchart depicted in Figure 9.
The gray and dashed blocks indicate the modi-cation on conventional NR method.
6. Harmony Search Algorithm (HSA)
HS algorithm has been originally inspired by making an analogy between music improvisation and optimization process. Just as musical instruments are played with certain discrete musical notes based on the musicians' experiences or the randomness in an improvisation process, the design variables can also be assigned with certain discrete values based on computational intelli-gence or randomness in the optimization process [25]. Moreover, as musicians improve their experiences based on an aesthetic standard, the design variables in computer memory can also be improved based on the
tness function (i.e. the Multi-Objective function in Section 2.1). The original HS algorithm performs based on the following ve steps in order to consider the computational intelligence or the randomness [18]: Step 1: Initializing the algorithm parameters; Step 2: Providing the harmony memory; Step 3: Improvising a new harmony; Step 4: Updating the harmony memory; Step 5: Checking the stopping criterion.
The optimum design algorithm, using HS, is basically sketched as shown in Figure 10.
Initializing the algorithm parameters and the problem is based on the following description:
min(f(x)jx 2 X); (33)
where f(x) is the main function and x is the set of variables with their upper-bound and lower-bound as xl< xi < xu. The algorithm parameters, consisting of the following parameters, are initialized in this step: - The Harmony Memory Size (HMS), or the number
of solution vectors in the harmony memory; - The Harmony Memory Considering Rate (HMCR); - The Pitch Adjusting Rate (PAR);
- The number of decision variables (N);
- The Number of Improvisations (NI), or stopping criterion;
- The Harmony Memory (HM) as a memory location where all the solution vectors (sets of decision vari-ables) are stored.
In the second step, to initialize the harmony memory, the HM matrix is lled with as many randomly-generated solution vectors, as the HMS:
HM = 2 6 6 6 4
x1
1 x12 x1N f(x1)
x2
1 x22 x2N f(x2)
... ...
xHMS
1 xHMS2 xHMSN f(xHMS)
3 7 7 7 5:(34) In the third step to improvise a new harmony, the following three rules must be considered:
- Rule 1: Memory consideration; - Rule 2: Pitch adjustment; - Rule 3: Random selection.
To implement the rst rule, the value of the rst decision variable x0
1 for the new vector was selected from any of the values in the specied HM range (x1
1 xHMS1 ); for other variables, we used the same method. The HMCR, varying between 0 and 1, was
Figure 10. Basic owchart diagram for HS algorithm [17].
dened as the rate of selecting one value from the historical values stored in the HM. Each component obtained by the memory consideration was tested in order to determine whether it should be pitch-adjusted or not. This operation used the PAR parameter as the rate of the pitch adjustment.
x0 i
8 > > > < > > > :
xi 2x1i; x2i; x3i; ; xHMSi with probability HMCR xi 2 Xi
with probablity(1 HMCR)
(35)
For instance, when an HMCR equals 0.8, it can be inferred that the HS algorithm will choose the decision variable value from historically stored values in the HM with an 80% probability or from the entire possible range with a 20% probability. This operation used the parameter PAR (i.e. the rate of pitch adjustment) as follows:
x0 i
8 > > > < > > > : x0
i rand(0; 1):bw with probability PAR x0
i
with probablity(1 PAR)
(36)
where bw is regularly the distributed random number between 0 and 1. Clearly, Step 3 is responsible for generating the new potential variation in the algorithm, and is comparable to mutation in standard EAs. Thus, either the decision variable is perturbed with a random number between 0 and bw, or otherwise it is left unaltered with a probability PAR, or else it is left unchanged with probability (1 - PAR).
In Step 4, when the new harmony vector x0 = (x0
1; x02; ; x0N) has a tness function better than the
Figure 11. Formation of one harmony.
worst harmony in the HM, then the new harmony is included in the HM, and the existing worst harmony is excluded from the, HM.
In the last step, the HS algorithm is stopped when the stopping condition (e.g. the maximum number of improvisations) has been fullled.
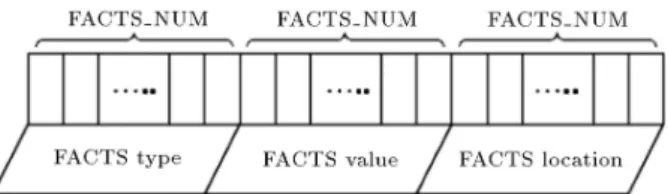
Each harmony vector consists of the type of FACTS devices, their values, and their locations with specied real numbers. Detail presentation of each harmony vector is shown in Figure 11. By this struc-ture, the FACTS devices including STATCOM and SSSC can be optimally allocated among the specic lines/buses candidate locations.
7. Case study & solution results
The modied IEEE 30-bus system [26] was applied in the present paper to show the eectiveness of the proposed technique to loss reduction, improving voltage prole and also increasing loadability limit and subsequently improving of the voltage stability by injection and replacement of active and reactive power in the network. Installing the FACTS device requires the cost that should be considered in technical and economic studies. Also, installing the FACTS device in additional capacitance and inappropriate locations not only did not improve system conditions, but increased total cost of system. On the other hand, FACTS
device reduce the cost of power plants, due to loss reduction and replacement of active power. Also, these devices are increasing the loadability limit of the power system and subsequently its stability, by injecting reactive power and improving voltage prole. But a compromise between the installation cost of the FACTS devices and improvement of the power system should be founded. The system data were in per-unit system where the base MVA value was assumed to be 100 MVA. The voltage magnitude limit of each bus was assumed to be within 0.95 and 1.05 pu. The test-system diagram is shown in Figure 12.
Figure 12. Single diagram of modied IEEE 30-bus system.
The system had 6 generators and 21 load buses. Bus 1 was the slack bus; buses 2, 13, 22, 23, and 27 were the PV buses. In order to achieve the base case value, the system was simulated under normal operating conditions, when = 0. The RPF was used for making a step increase in the powertransfer.
The system was tested under the following FACTS devices installation scenarios:
- Scenario 1: power system normal operation (without FACTS devices installation);
- Scenario 2: one STATCOM is installed; - Scenario 3: one SSSC is installed;
- Scenario 4: Multi-type (STATCOM and SSSC) FACTS devices are installed.
To demonstrate the eectiveness of the HSA algorithm, the HSA results were compared with those of the GA and PSO algorithms. Table 5 shows the PSO and GA parameters used for simulation purposes.
7.1. Solution results
The loadability limit at normal operating conditions was 822.32 MW. The total fuel cost and the total active power-loss at normal operating conditions were 59342 and 2.44 MW, respectively. The simulation results for this stage are shown in Table 6.
Table 5. Parameters set for HSA, PSO and GA.
HSA bw PAR HMCR HMS NI
1 0.3 0.9 25 100
PSO Swarm c1 = c2 Xmin Xmax Iterations
10 n 2 0.5 1 100
GA Population Crossover Mutation rate Iterations
150 0.8 0.001 100
Table 6. Results of simulation in dierent scenarios. Method
Loadability level (MW)
Losses (MW)
Installation cost ($/h)
Operation cost ($/h) Scenario 1
(Normal) - 822.321 2.4433 - 59342.21
Scenario 2
HSA 915.617 2.323 109.84 59058.8
PSO 912.824 2.341 109.69 59074.1
GA 915.579 2.374 109.93 59082.3
Scenario 3
HSA 898.572 2.1744 128.57 59112.6
PSO 897.168 2.1876 128.58 59118.4
GA 894.241 2.1839 128.61 59125.8
Scenario 4
HSA 960.669 2.0316 154.71 58830.1
PSO 961.319 2.0736 154.80 58847.1
In single-type devices case, it was shown that STATCOM and SSSC can be used for loadability-limit enhancement, thus decreasing the total fuel cost and minimizing the losses with minimum investment cost of FACTS devices. However, compared to the percentage of loadability-limit improvements, STAT-COM presented better results, since it had greater impact on improving the voltage prole, which is the main limitation to increase the power system security. Therefore, compared to SSSC, STATCOM can increase the loadability(-)limit more signicantly. SSSC had, in turn, faster impact on power-loss de-creases in comparison to STATCOM. Comparing the cost, even though SSSC showed good performance in improving the tness function, it was more costly than STATCOM. In the multi-type case for FACTS devices, the improvement of tness function was comparatively better than that of the single-type case.
In all cases, it was observed that FACTS devices improve the line power-ow nearer to its thermal limits, and improve the bus voltage proles at the same time. Figure 13 shows the voltage prole of the system in dierent scenarios.
The results in Table 6 show that installing the single-type FACTS devices does not improve the voltage-stability, nor does it decrease the losses of the system; the simultaneous installation of STATCOM and SSSC, nevertheless, will both improve the voltage stability and decrease the losses of the system. Table 7 shows the size and the place of installation of FACTS devices with HSA in dierent simulation scenarios.
Figure 14 depicts the loadability level of the systems in dierent scenarios, where the very index has
Figure 13. Voltage proles for dierent scenarios in normal operating condition.
Figure 14. P-V diagram for weakest bus in dierent scenarios.
improved the status of the simultaneous installation of multi-type FACTS devices, compared to other statuses. To validate the optimization algorithm, the re-sults obtained by HSA were then compared with those of the other algorithms like GA and PSO; it is obvious that the HSA had better performance than the other two methods for optimal allocation of FACTS devices. It is also worth mentioning that the HSA had better computational eciency, compared to the other methods for this study. To prove this, Figure 15 shows the average convergence diagram in 20 run for the three heuristic approaches. It can be observed that, for average convergence to be achieved, the HSA converges in about 70 iterations, while the GA and PSO iterate 89 and 93, respectively. This advantage contributes signicant reduction in simulation time for HSA.
Figure 15. Average convergence characteristics of GA, PSO and HSA for the 20 runs in Scenario 4.
Table 7. FACTS location and sizes results with HSA algorithm.
Devices/Type STATCOM SSSC
Size/Location Size (MVAr)
Location (bus)
Location (branch)
r (p.u)
(degree)
Scenario 2 31.4 9 - -
-Scenario 3 - - 8-28 0.64 21.17
8. Conclusion
This paper proposed an eective method for sizing and locating the multi-type FACTS devices, based on a multi-objective function, to improve the system operating conditions.
The FACTS devices of STATCOM and SSSC have parallel and series performances, respectively. Since a perfect multi-objective function consists of improving the voltage stability, minimizing the losses, and de-creasing the installation and total fuel cost of FACTS devices, it can be formulated for optimization problem. Here, the multi-objective problem was solved using fuzzy optimization strategy and a heuristic algorithm named HSA.
The multi objective proposed method was im-plemented on the modied IEEE 30-bus test system. The results indicated that simultaneous allocation and sizing of the multi-type FACTS devices had more advantages for improving the dened terms of the ob-jective functions, compared to the single-type FACTS. To verify the performances of the HSA, the results were compared with those obtained from other heuristic methods such as PSO and GA. Our results showed that HSA had better accuracy and convergence than GA and PSO when applied to the allocation of FACTS devices.
References
1. Xiao, Y., Song, Y.H., Chen-Ching, Liu. and Sun,
Y.Z. \Available transfer capability enhancement using FACTS devices", IEEE Transactions on Power Sys-tems, 18(1), pp. 305-312 (2003).
2. Shao, W. and Vittal, V. \LP-based OPF for corrective
FACTS control to relieve overloads and voltage viola-tions", IEEE Transactions on Power Systems, 21(4), pp. 1832-1839 (2006).
3. Baghaee, H.R., Jannati, M.B. and Vahidi, B.
\Im-provement of voltage stability and reduce power sys-tem losses by optimal GA-based allocation of multi-type FACTS devices", 11th Int. Conf. on Optimization of Electrical and Electronic Equipment (OPTIM), pp. 209-214 (2008).
4. Galiana, F.D., Almeida, K., Toussaint, M., Grin,
J. and Atanackovic, D. \Assessment and control of the impact of FACTS devices on power system perfor-mance", IEEE Transactions on Power Systems, 11(4), pp. 1931-1036 (1996).
5. Sung-Hwan, S., Jung-Uk, L. and Seung-Il, M. \FACTS
operation scheme for enhancement of power system se-curity", In Proc. of IEEE Power Tech Conf., Bologna, 3, pp. 36-41 (2003).
6. Al-Awami, A.T., Abido, M.A. and Abdel-Magid,
Y.L. \A comparative study on eectiveness of robust FACTS stabilizers for power system stability enhance-ment", The Arabian J. for Science and Engineering, 33(2B), pp. 519-526 (2008).
7. Gerbex, S., Chekaoui, R. and Germond, A.J. \Optimal
location of multi-type FACTS devices in a power system by means of genetic algorithm", IEEE Trans-actions on Power Systems, 16(3), pp. 537-544 (2001).
8. Aghamohamadi, M.R., Mohammadian, M. and Saitoh,
H. \Sensitivity characteristic of neural network as a tool for analyzing and improving voltage stability", IEEE PES Transmission and Distribution Conf. and Exhibition (Asia Pacic), pp. 1128-1132 (2002).
9. Aghamohamadi, M.R. and Mohammadian, M.
\Load-ability limit assessment in Iran Power Network with respect to voltage stability constrain", 11th Int. Power System Conf., Tehran, Iran, pp. 1-12 (1996).
10. Aghaei, J., Gitizadeh, M. and Kaji, M. \Placement
and operation strategy of FACTS devices using op-timal continuous power ow", J. of Scientia Iranica, Transactions D, 19(6) pp. 1683-1690 (2012)
11. Abido, M.A. \Power system stability enhancement
using facts controllers: A review", The Arabian J. for Science and Engineering, 34(1B), pp. 153-172 (2009).
12. Mohammadian, M., Aghamohammadi, M.R. and
Bathaee, S.M.T. \Power plants generation scheduling constrained to voltage stability limit based on sensivity characteristic of neural network", 17th Int. Power System Conf., Tehran, Iran (2002).
13. Gerbex, S., Cherkaoui, R. and Germond, A.J.
\Opti-mal location of multi-type FACTS devices by means of genetic algorithm", IEEE Power Engineering Review, pp. 59-60 (2001).
14. Ma, T.T. \Enhancement of power transmission
sys-tems by using multiple UPFC on evolutionary pro-gramming", IEEE Power Tech Conf., Bologna, 4, (2003).
15. Saravanan, M., Slochanal, S.M.R., Venkatesh, P. and
Abraham, J.P.S. \Application of particle swarm op-timization technique for optimal location of FACTS devices considering cost of installation and system loadability", J. of Electric Power Systems Research, 77(3), pp. 276-283 (2007).
16. SFLsbaoui, B. and Alaoua, B. \Ant colony
optimiza-tion applied on combinatorial problem for optimal power ow solution", Leonardo J. of Sciences, 14, pp. 1-17 (2009).
17. Geem, Z.W. and Choi, J.Y. \Music composition using
harmony search algorithm", Lecture Notes in Com-puter Science, 4448, pp. 593-600 (2007).
18. Geem, Z.W. \Harmony search algorithm for solving
sudoku", Lecture Notes in Articial Intelligence, 4692, pp. 371-378 (2007).
19. Seyedi, E., Farsangi, M.M., Barati, M. and
Nezam-abadipour, H. \SVC multi-objective VAr planning using SFL", Int. J. on Technical and Physical Problems of Engineering, ISSN 2077-3528 (2010).
20. Habur, K. and Oleary, D. \FACTS-exible AC
mission system for cost eective and reliable trans-mission of electrical energy", http://www.siemenstd. com/transSys/pdf/costEectiveReliabTrans.pdf .
21. Lashkar Ara, A., Kazemi, A. and Nabavi Niaki, S.A. \Multiobjective optimal location of FACTS shunt-series controllers for power system operation plan-ning", IEEE Transactions on Power Delivery, 27(2), pp. 481-490 (2012).
22. Kumar, D.M.V. \Real-time power system static
secu-rity enhancement using intelligent SSSC", IE (I) J., 86, pp. 249-254 (2006).
23. Natesan, R. and Radman, G. \Eects of STATCOM,
SSSC and UPFC on voltage stability", Thirty-Sixth IEEE conf. on System Theory, pp. 546-550 (2004).
24. Mete Vural, A. and Tumay, M. \Mathematical
mod-eling and analysis of a unied power ow controller: A comparison of two approaches in power ow studies and eects of UPFC location", J. of Electrical Power and Energy Systems, 29, pp. 617-629 (2007).
25. Chakraborty, P., Roy, G.G., Das, S. and Jain, D. \An
improved harmony search algorithm with dierential mutation operator", J. of Fundamenta Informaticae, 95(4), pp. 401-426 (2009).
26. Idris, R.M., Khairuddin, A. and Mustafa, M.W.
\Opti-mal allocation of FACTS devices for ATC enhancement using bees algorithm", World Academy of Science, Engineering and Technology, 54, pp. 313-320 (2009). Biographies
Abbas Esmaeili Dahej received his BS Degree in
Electrical Engineering from Shahid Chamran College, Kerman, Iran, in 2009 and his MS degree in Power Electrical Engineering from Shahid Bahonar Univer-sity, Kerman, Iran, in 2012. His eld of interest includes power system operation and control opti-mization techniques, renewable energy and FACTS devices.
Saeid Esmaeili received his BS degree in Power Electrical Engineering from K.N. Toosi University of Technology, Tehran, Iran, in 1999 and his MS degree in Power Electrical Engineering from Iran University of Science and Technology, Tehran, Iran, in 2002. He also received his PhD degree in Electrical Engineering from Amirkabir University of Technology, Tehran, Iran in 2007. He is currently an assistant professor in the Department of Electrical Engineering at the Shahid Bahonar University of Kerman, Kerman, Iran. His research interests include analysis and optimization of electrical power system, power quality and dynamics of electrical power systems.
Ali Goroohi received his BS degree in Electrical Engineering from Shahid Chamran College, Kerman, Iran, in 2010 and his MS degree in Power Electrical Engineering from Shahid Bahonar University, Kerman, Iran, in 2013.His research interests include renewable energy, photovoltaic systems, power electronics and FACTS devices.
![Figure 7. Injection model for a series-connected VSC [19].](https://thumb-us.123doks.com/thumbv2/123dok_us/8393278.2230037/5.892.475.776.512.635/figure-injection-model-for-a-series-connected-vsc.webp)
![Figure 8. Voltage-source model of STATCOM [20].](https://thumb-us.123doks.com/thumbv2/123dok_us/8393278.2230037/6.892.116.422.469.894/figure-voltage-source-model-of-statcom.webp)