REMOVAL OF FLUORIDE FROM DRINKING WATER BY
QUARTERNARY AMINATED RESINS FROM SAW-DUST
Anurag Choudhary,
[a]P. T. S. R. K. Prasad Rao,
[b]Shobha Sharma
[a]and
Vinita Sharma
[a]Keywords: Fluoride, removal, resins, saw-dust, water analysis, drinking water purification
Safe drinking water is a severe problem in many parts of the various countries including India a fast developing country. Authors have used some low-cost materials and their products as one of the best adsorbents for the removal of fluoride from water mainly used for drinking and other domestic purposes. Results are appreciable to be applied in large scale purposes.
* Corresponding Authors Fax:
E-Mail:
[a] a - Department of Chemistry, J.N.V. University, Jodhpur-342001, INDIA
[b] PG Department of Chemistry, P.B.Sidddharth College of Arts & Science, VIJAYWADA-520 010 INDIA.
Introduction
Fluoride has been recognized as an essential component in human diet. Skeletal and dental problems can be prevented by maintaining fluoride concentration of one ppm in dietary intake, however long term consumption of water having high fluoride concentrations lead to bone diseases such as osteofluorosis and systemic fluorosis, which is an endemic problem1 in many countries, the matter has been reviewed
by Susheela.2 Cases of endemic fluorosis have been reported
from all places of world, particularly China, Japan, Thialand, Persian Gulf, Saudi Arabia, Europe, USA, Canada, Argentina and African Countries2 In India cattle and human
fluorosis was detected in 1930 and 19373, respectively, the
population of 50 % districts of more than fifteen states are affected by high fluoride concentration in drinking water. Severely affected states are Andhra Pradesh, Uttar Pradesh, Tamil Nadu & Rajasthan. The fluoride level in the ground water used for drinking purposes in Thar and Aravali regions of Rajasthan, has been found as 12-90 ppm and 1.44-28.1 ppm respectably.4-6
Several defluoridation methods based on the adsorption, precipitation & ion exchange has been developed during last four decades, however none of these could solve this problem at a completely acceptable level.7 The materials
used include lime & related compounds,5-7 trivalent metal
oxides, hydroxides & carbonates,8,9 activated alumina,10
activated carbon and ion exchangers11 etc. Attempt has also
been made to tackle this problem by Government agencies, NGO’s, medical experts, Center of Community Economics and Development Consultant Society, Department of Science and Technology etc.12 Rajasthan Government had a
program to transfer and propagate a domestic defluoridation technology called Nalgonda Technique (NA) in selected villages.13 A more recent process of defluoridation is
KRASS, which is said to be simpler and effective, however the claims have not been substantiated.14
Nalgonda Technique involves direct addition of known quantities of lime and alum depending upon the [F-] in water,
unfortunately the technology is not very successful because of the difficulties in controlling the dose of alum and the lack of awareness among people. The process is suitable only for water having [F-] < 10 ppm. The defluoridation by
activated alumina (AA) has been studied at length by Bulusu and Nawlakhe.10 [F-] less than 1 ppm can be achieved easily
by using AA as an adsorbent, however it has certain operational, control and maintenance problems, the important one is the clogging of bed. In the KRASS process, water containing high [F-] was passed through a PVC
column of 64-122 cm in length & 5-6 cm in dia., filled with a low cost material under patent. The column after exhaustion is regenerated with 10% alum solution.
The residual [Al+3] in water treated by NA, AA and
KRASS methods was found 2.01-6.46, 0.1-0.3 and 0.1-0.15 ppm respectively. Aluminium is a neurotoxin and its concentration as low as 0.08 ppm in drinking water is reported to have caused Alzheimer’s disease,15 thus
generation of residual [Al+3] by these treatments may initiate
a secondary toxicity problem, greatest drawback of these processes. In the present communication the efforts have been made to remove [F-] from water by aluminium free
material, quarternary aminised saw dust (SD) derivatives
Experimental Section
Materials
All the reagents and chemicals used in this study are commercially available and are of high purity AR grade.
A 100 m mol L-1 stock solution of [F-] was prepared by
dissolving sodium fluoride in de-ionized water. These solutions were further diluted to suitable concentrations as & when required. The pH of solutions was adjusted by adding dilute HCl or NaOH solution.
AIMIL make MK II model spectrophotometer and Naina make pH meter model 303 with combined glass electrode were used for measuring residual [F-] & pH measurement
Table 1. Physical properties of SD derivatives
S.No Derivatives Particles Degree of substitution
Water retain, g g-1
Salt splitting capacity, meqv g-1
Weak acid exchange capacity ,
meqv g-1
amount , % size, mesh
1 TMAHP- SD 60 >100 0.25 2.52 0.66+0.03 0.25+0.05
40 60-100
2 TMAHP- SD 60 >100 0.24 2.64 0.58+0.02 0.25+0.03
40 60-100
3 TMAHP- SD 60 40-60 0.21 2.10 0.46+0.03 0.20+0.03 40 >60
Stability: 6-8 weeks at pH 3- 10; Swelling in water: slightly.
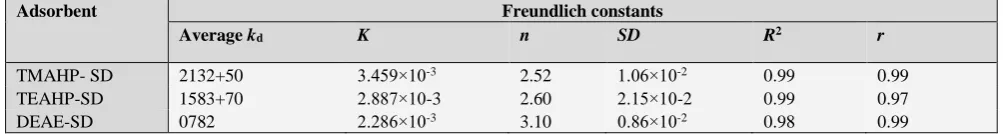
Table 2. Freundlich constants for the adsorption of fluoride ion on SD derivatives*
Adsorbent Freundlich constants
Average kd K n SD R2 r
TMAHP- SD 2132+50 3.459×10⁻³ 2.52 1.06×10⁻² 0.99 0.99 TEAHP-SD 1583+70 2.887×10⁻³ 2.60 2.15×10⁻² 0.99 0.97
DEAE-SD 0782 2.286×10⁻³ 3.10 0.86×10⁻² 0.98 0.99
([F-]=0.02 g dm-3, Time of contact =30 min, Adsorbent amount = 0.15 g, Temperature = 30 oC, Volume = 0.1 dm3, pH=8
The adsorbents used in this study are saw dust derivatives, namely quaternary aminised trimethylamino-hydroxypropyl-,
triethylamino-hydroxypropyl- and diethylaminoethyl-
sawdust referred onward as TMAHP-, TEAHP- & DEAE- SD, respectively. These were prepared as described earliar. The physical properties of SD derivatives viz. degree of substitution, particle size, water regain, salt splitting capacity, exchange capacity, swelling and stability were evaluated by known methods. These are reported in Table 1.
Distribution Coefficients
The uptake of fluoride on the derivatives was estimated in terms of distribution coefficient, Kd. The derivatives
(0.02-0.4 g) were stirred with 100 ml of 0.02 g dm-3 aqueous
solution at pH 7-8, until complete equilibrium was obtained. The adsorbent was then removed by filtration through glass wool and the residual [F-] in the solution was computed
spectrophotometricaly, from the linear optical density (OD) vs concentration curves by measuring OD at the max absorbance region of the complex18. The K
d values were
evaluated using the formula19:
where
V is the volume of solution in ml,
m is the weight of the adsorbent in grams and
x is the % of [F-] remaining in the solution.
Batch Adsorption Study
Adsorption experiments were performed by agitating 0.02- 0.2 g of SD derivatives with 100 ml aq. soln. of fluoride, 0.02 dm-3 in skew cap jars. The agitation was
continued for 30 min. at ambient temperature (30 + 0.02 oC).
The initial pH of the solution was adjusted by adding requisite amounts of acid or alkali solution. The equilibrated solutions were centrifuged for 10 min at 10,000 RPM in T 24 model (GDR) centrifuge and analyzed for the residual [F-].
Results and Discussions
The efficiency of SD derivatives for the removal of F
-from water was evaluated by calculating the Kd values for
fluoride ion at pH 8. The results (Table 2) show that all the SD derivatives have good affinity for fluoride ion and the order of adsorption for the fluoride ion towards the derivatives is – TMAHP-SD > DEAE-SD > TEAHP-SD
The results also indicate, that the Kd values increase with
the decrease in pH of the solution, which may be attributed to the neutralization of surface negative charge of SD derivatives17
Adsorption Isotherms
Adsorption isotherms (AI) for fluoride ions in water on SD derivatives, when the system is in equilibrium were found regular, positive and convex to the concentration axis followed by a plateau and another rise and formation of plateau. The sharp rise of isotherms in the initial stages of low equilibrium concentration indicates that there are plenty of readily available sites for fluoride ion. Eventually a plateau is reached in all the three cases, this indicates that the saturation of adsorbent surface at this stage. Further rise in the adsorption isotherms and the formation of another plateau probably indicates mono dispersity of adsorption accompanied by the formation of small sized ionic micelles on the surface. A similar behavior has been observed in the adsorption of merocynine over silver halides.20, 21
d
(100 x V)
K
xm
Table 3. Effect of pH on Kd and removal of fluoride (in %) by SD derivatives*
S.No. pH Fluoride removal in % and Kd values
TMAHP-SD TEAHP-SD DEAE-SD
% [F-] K
d % [F-] Kd % [F-] Kd
1 3 81 2842 76 2111 61 1043
2 4 72 1714 66 1294 55 815
3 5 66 1294 60 1000 49 640
4 8 61 1043 51 694 45 545
5 9 54 783 47 591 41 463
An average of three sets. [F-]=0.02 g dm –3;Time of contact=30 min; Adsorbent amount=0.15 g; Temperature = 30 oC; Volume = 0.1 dm3
Table 4. Effect of Absorbent dose on Kd and removal of F- (in %) by SD-derivatives*
Amount of absorbent TMAHP-SD TEAHP-SD DEAE-SD
% [F-] K
d % [F-] Kd % [F-] Kd
0.04 33 1203 30 1071 29 996
0.08 41 868 41 851 40 833
0.12 50 833 48 833 43 769
0.16 65 1135 58 845 51 680
0.20 74 1385 65 928 66 949
Average Kd 1126 976 918
An average of three sets. [F-] = 0.02 g dm –3; Time of contact = 30 min; pH = 8; Temperature =30 oC; Volume = 0.1 dm 3;
max= 570 nm
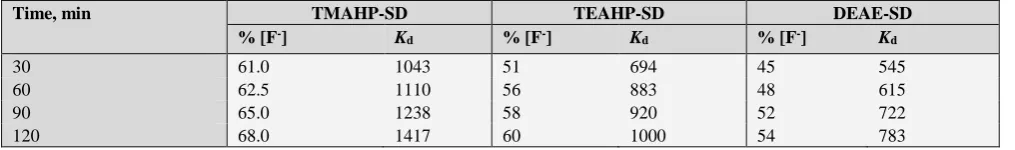
Table 5. Effect of time on Kd and removal of F- (in %) by SD-derivatives*
Time, min TMAHP-SD TEAHP-SD DEAE-SD
% [F-] K
d % [F-] Kd % [F-] Kd
30 61.0 1043 51 694 45 545
60 62.5 1110 56 883 48 615
90 65.0 1238 58 920 52 722
120 68.0 1417 60 1000 54 783
An average of three sets. [F-] = 0.02 g dm –3; pH = 8; Temperature =30 oC; Volume = 0.1 dm 3;
max= 570 nm; Adsorbent amount = 0.15 g
The experimental data was analyzed in the light of Freundlich22, Langmuir23 and BET24 equations to predict the
nature of adsorption. The A I do not strictly follow any one model, however at low concentrations of fluoride ion (1-10 ppm) as are generally available in the drinking waters, the Freundlich model is obeyed. The plots of log Ce against log
x/m were found linear yielding an intercept on the ordinate. The Freundlich constants K and1/ n were calculated from the intercept and slope of these curves using computerized LRG program and reported in Table 2. The Freundlich constant K is a measure of capacity of the adsorbent while n denotes the intensity of adsorption, a value of n between 1 and 10 is considered to be a favorable adsorption. The adsorption capacity was found maximum for TMAHP-SD. The extent of adsorption, n, was found in the range of 2.52 to 3.1, which is quite satisfactory.
Effect of pH
The effect of pH on the adsorption of F- on to SD
derivatives was studied at pH 3, 4, 5, 8 and 9. The % removal of fluoride ion at different pH is given in Table 3. It was observed that the adsorption occurred in the entire range of pH studied, however the uptake of F- increased with the
decreasing pH of the solution. The pH of the solution reportedly affect the surface charge of SD derivatives, the
decrease in pH helps in neutralizing the negative charge of SD derivatives and permit the easier movement of fluoride ion in the vicinity of the Vander-Waal’s forces, thereby increasing the % removal of fluoride ion at lower pH.
Effect of Adsorbent Dosage
Table 4 shows the amount of fluoride removed as a function of adsorbent dosage at pH 8 and 0.02 g dm-3 of
initial [F-] and at 30 oC. Adsorbent dosage was varied from
0.02 to 0.4 g per 100 ml and equilibrated for 30 min. From the results, it is evident that optimum dosage of adsorbent per 100 ml required for the maximum removal of fluoride is 0.1 g. It is interesting to note that the same dose of other adsorbents exhibit comparatively low fluoride removal capacity.
Effect of Time
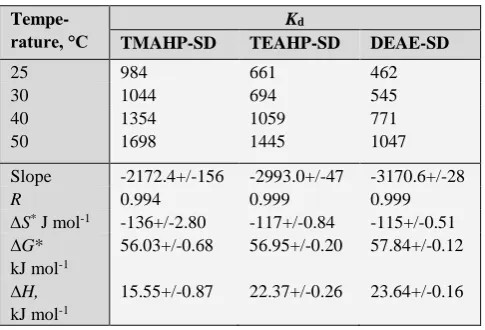
Table 6. Effect of temperature on Kd and removal of F- (in %) by SD-derivatives*
Tempe-rature, °C
Kd
TMAHP-SD TEAHP-SD DEAE-SD
25 984 661 462
30 1044 694 545
40 1354 1059 771
50 1698 1445 1047
Slope -2172.4+/-156 -2993.0+/-47 -3170.6+/-28
R 0.994 0.999 0.999
S* J mol-1 -136+/-2.80 -117+/-0.84 -115+/-0.51 ∆G*
kJ mol-1
56.03+/-0.68 56.95+/-0.20 57.84+/-0.12
∆H, kJ mol-1
15.55+/-0.87 22.37+/-0.26 23.64+/-0.16
An average of three sets. [F-] = 0.02 g dm –3; Time of contact = 30 min; pH = 8; Volume = 0.1 dm 3;
max= 570 nm; Adsorbent amount = 0.15 g
Table 7. Effect of nature and concentration of surfactants on the removal of fluoride by TMAHP-SD
Fluoride removal in % in the presence of Arkoline surfactants
Concentration SPW N-65 HCS
0.05 60 61 63
0.10 57 60 65
0.15 54 61 68
0.20 50 60 71
0.25 42 60 74
0.30 38 60 71
An average of three sets.; [F-] = 0.02 g dm-3; Adsorbent =0.15 g; pH = 8; Time of contact = 30 min; Volume = 0.1 dm3; Temperature = 30 oC.
Table 8. Effect of added ions on the removal of fluoride (in %) by TMAHP-SD
Concn., g dm-3 Cl- NO
3- SO42- HCO3
-0.01 60.0 60.0 60.0 58.0 0.02 61.5 61.0 59.0 56.5 0.03 60.5 60.5 60.0 55.0 0.04 60.0 61.5 60.5 54.0 0.05 61.5 61.0 61.5 52.0
An average of three sets; [F-] = 0.02 g dm-3; ime of contact=30 min; pH = 8; Volume = 0.1 dm3; Adsorbent = 0.15 g;
max = 5;
Effect of Temperature
The effect of temperature on the % removal of fluoride ion by starch derivatives was investigated at 30, 40 and 50
oC keeping all other parameters constant, these results are
summarized in Table 6. The % uptake is highly dependent on [F-] in solution and increase with the increase in
temperature, indicating that the process of adsorption is endothermic in nature.
Effect of Surfactants
The effect of nature and concentration of added surfactants on the adsorption of fluoride ion on the SD derivatives was investigated at room temperature. The
results in Table 7 show that the surfactants have a little effect on the adsorption of fluoride ion on the derivatives. The % removal of fluoride ion increased with the increase in added cationic surfactants concentration and decreased with the increasing [anionic surfactant], nonionic surfactants however have no effect. It appears that cationic surfactants neutralize some negatively charged sites of the adsorbent resulting in the improved migration of F- on the SD
derivative. The decreased adsorption by anionic surfactants may be attributed to the competitive adsorption of fluoride ion and the surfactants.
Effect of Added Co-ions
The effect of added co-ions e.g. Cl-, SO
42-, NO3- and
HCO3- on the % removal of fluoride ion was investigated
with TMAHP-SD. The results (Table 8) indicate that the addition of co-ions in the range investigated has no appreciable effect, however the increase in [HCO3-] slightly
decrease the adsorption efficiency. This may be due to the competitive rate of adsorption of fluoride and bicarbonate ions. The observation is in accordance with the studies on activated alumina and magnesia.
The Mechanism of Adsorption
The mechanism of adsorption may be considered as a mixed effect of classical as well as of chromatographic adsorption. The introduction of glycedyl trialkyl ammonium groups in the SD derivatives imparts it a strongly cationic anion exchanger’s character.25 At lower pH, these exist in
chloride form, the higher exchange capacity of these forms are well documented. Initially all the Cl- ions of the
TMAHP-SD are exchanged by F- ions with the formation of
first plateau, after the saturation point is reached i.e. the capacity of ion exchanger is exhausted the F - ions are held
by hydrogen bonding and weak VanderWaal’s forces showing the rise in adsorption isotherm and the formation of another plateau.
[R1-O-CH2-CHOH-CH2-NR3]Cl - + F- →
[R1-O-CH2-CHOH-CH2-NR3]F- + Cl
-where R1 stands for cross linked cellulose (SD) and R for
methyl or ethyl groups.
Saw-Dust is basically a wood cellulose which acquires a negative surface charge by virtue of primary hydroxyls on each D-glucopyranose units. The alkaline treatment of cellulose (SD), during the introduction of quaternary ammonium group, causes degradation of about 2 % with the loosening of the structure and the introduction of some acidic sites which do contribute to negative charge.26 In
Conclusion
The present study demonstrates that the cationic SD derivatives have potential to remove fluoride from drinking water without any other toxic affect. The study has following salient features:
The up take of fluoride ion is rapid in initial stages and decreases gradually while approaching equilibrium.
The major part of total adsorption, nearly 80 % of uptake at equilibrium takes in less than 30 minutes.
The up take of fluoride ion is significantly dependent on the pH of water, increases with the decrease in pH of water.
The up take of fluoride ion by SD derivatives is also influenced by the presence of surfactants. The up take of fluoride ion increases with the increase in [cationic surfactant], and decreases with the increase in [anionic surfactant], nonionic surfactants have no effect.
The material after the use can be burnt, thus pose no waste disposal problem.
References
1Dean, H. T., Arnold, F. A. Jr. and Evolve, E., Publ. Health Rep., 1942, 57, 115.
2Susheela, A. K., Proc. Rome Symp., 1994, IAHS Publ. No. 233. 3Shortt, H. E., Robert, G. R., Bernard, T. W. and Nayyar, A. S. M.,
Indian J. Med. Res.,1937, 25, 553.
4Choubisa, S. L., Choubisa, D. K., Joshi, S. C. and Choubisa L.,
Fluoride, 1997, 30,223.
5Gupta, S. C, Rathor, G. S. and Doshi, C. S, Indian J. Environ.
HLTH, 1993, 35, 97.
6Choubisa, S. L., Choubisa L. and Choubisa, D. K., Indian J.
Environ. Health, 2001, 43,177.
7Sujana, M. G., Thakur, R. S., Das S. N. and Rao, S.B., Asian J.
Chem.,1997, 9, 561.
8Tokunaga, S., Haron, M. J., Wasay, S. A., Wong, K. F., Laosangthum, K. and Uchimi, Int. J. Environ. Stud.,1995, 48,
17.
9Bulusu, K. R. and Nawlakhe, W. G, Indian J. Environ Health 1988, 30, 262.
10Bulusu, K. R. and Nawlakhe, Indian J. Environ. Health,1990, 32, 197.
11Bhatt, D. B., Bhatt, P. R., Prasad, H. H., Popat, K. M. and Anand, P. S., Indian J. Chem. Technol., 2004, 11, 299 and references therein.
12Nawlakhe, W. G, Kulkarni, D. N., Pathak, B. N. and Bulusu, K. R., Indian J. Environ. Health, 1975, 17, 26.
13Kumar, N., Yojana, 1999, 6, 45.
14Gupta, K. R., Gupta, S. K. and Gupta, A. B., Water Sci. Techn
.
1999,
40, 167.15Davidson, A. M., Walker, G. S., Oli, H. and Lewins, A. M., The
Lancet, 1982,785.
16Prakash A. and Prasadrao P. T. S. R. K., Chem Environ. Res., 2006, 15, 27.
17Prakash, A. and Solanki, S., Res. Ind.,1993, 38, 35.
18Standards methods for the examination of water and waste water, 1975, APHA, AWWA, WPCF, Wshington DC 2005. 19Srivastava, S. K., Bhattacharjee, G., Tyagi, R., Pant, N. and Pal,
N., Environ. Technol. Lett., 1988, 9, 1173.
20Gills, C. H. and MacEvan, T. H., J. Chem. Soc.,1960, 3973.
21Gills, C. H., Easton, I. A. and Mackay, G., J. Chem. Soc.,1964, 4495.
22Freundlich, H., Colloidal and Capillary Chemistry, 1928, Methuen, London.
23Langmuir, I., J. Am. Chem. Soc., 1918, 40, 1361.
24Brunauer, S., Emmet, P. H. and Teller, E., J. Am. Chem. Soc., 1938, 60, 309.
25Durolite Ion Exchange Manual 1960, Western Division of Diamond Alkali Company, Red Wood City, California USA.
26Young, R. A. and Liss, L., Cellul. Chem. Technol., 1985, 24, 273.