THE INFLUENCE OF HYDROGEN SULPHIDE AND
CONFIGURATION OF A DBD REACTOR POWERED WITH
NANOSECOND HIGH VOLTAGE PULSES ON HYDROGEN
PRODUCTION FROM BIOGAS
Miroslaw Dors,
[a]*Tomasz Izdebski,
[a]Mateusz Tański,
[a]Jerzy Mizeraczyk
[b]Keywords: hydrogen; biomethane; dielectric barrier discharge; plasma; hydrogen sulphide.
The production of hydrogen from CH4:CO2:H2S (70 % : 30 % : 1000 ppm) mixture, simulating dry biogas in a DBD reactor, supplied with nanosecond negative pulses, is presented. We have found that sulphur produced from H2S during the process changes the electrical parameters of the reactor with a RVC electrode. As a result, the production of syngas and the selectivity of methane conversion into hydrogen, decreases. Due to changed electrical parameters of the reactors, radicals formed from methane recombine into C2 and C3 hydrocarbons more efficiently, resulting in lower production of hydrogen. Major by-product of the methane processing is propane, concentration of which is comparable to hydrogen.
* Corresponding author
E-Mail: [email protected]
[a] Centre for Plasma and Laser Engineering, The Szewalski Institute of Fluid Flow Machinery, Gdańsk, Poland [b] Department of Marine Electronics, Gdynia Maritime
University, Gdynia, Poland
Introduction
So far, most of the plasma methods of the hydrogen production use such substrates, as natural gas, gasoline, heavy oils, and kerosene. Many of them use a combination of plasma and catalysts, either as a single-stage or two-stage system. The single-stage type is composed of the packing catalyst pellets within the plasma zone, or a coating catalyst on the surface of the electrode(s). As for the two-stage type, the plasma zone is located either upstream or downstream the catalyst bed, which is termed as the plasma preprocessing and plasma post-processing, respectively.
Unfortunately, the plasma-catalytic systems are not useful when biogas containing sulphides (mainly H2S) is going to
be processed, due to the catalyst poisoning. There are several publications claiming to describe the production of hydrogen from the biogas, using plasma-catalyst systems.1-4
However, the authors have used a mixture of methane and carbon dioxide simulating the biogas, without any additives which are present in the real biogas, such as water vapor, H2S and NH3. Such a simple simulation of the biogas is not
adequate when the outlet gas is going to be used with fuel cells, which are very sensitive to H2S traces. There are only
2 papers on using the real biogas and both of them were published by the same research group, in 2008 and 2010.5-6
Sekine et al studied the application of the pulsed corona discharge (PCD) reactor and the dielectric barrier discharge (DBD) reactor without any catalyst and they found, that the
PCD could convert the biomethane into the syngas and H2S
into the solid sulphur simultaneously.5-6 This is due to the high electron energy of the PCD - the electron has enough energy to dissociate a C–C bond and a C–S bond. On the other hand, the DBD could convert H2S into solid sulphur
too, but methane and CO2 in the biogas have not reacted at
the lower input power. In this work, we present the results of an experiment in which both the DBD and the pulsed power supply, are used. These results show the influence of the plasma reactor configuration, the catalyst typical for steam hydrocarbon reforming, and hydrogen sulphide polluting the biogas on the process of hydrogen production, methane conversion and its by-products formation.
Experimental set-up
In this paper the results obtained in three specific DBD reactors are presented. The schemes of the reactors are shown in Figs. 1-3. The reactor No. 1 represents basic construction which was used for the next two. It is made of a quartz glass tube of inner diameter 15 mm, in which a high voltage RVC (Reticulated Vitreous Carbon) electrode is placed. The glass tube is covered with an aluminum foil, remaining a 4 mm wide slit along the reactor. The RVC electrode is formed as a tube of outer diameter 8 mm, inner diameter 3 mm and length of 150 mm. Through that RVC tube, a mixture of methane, carbon dioxide and hydrogen disulfide (70 %:30 %:1000 ppm, respectively), simulating a dry biogas, was introduced into the reactor. Due to the relatively low porosity of the RVC tube, which is 80 ppi (pores per inch), the gas flow was not disturbed and was kept at 200 cm3 min-1 at the atmospheric pressure. An
average residence time for the processed gas in the discharge space of the reactor No. 1 is about 5.7 s.
Figure 1. DBD reactor with RVC electrode (Reactor No. 1)
Figure 2. DBD reactor with RVC electrode and porous ceramic tube as the second dielectric barrier (Reactor No. 2)
Figure 3. Images of DBD supplied by nanosecond pulses of 29 kV and 50 Hz in Reactor No.1 (a) and No.2 (b)
In the reactor No. 3 there is no additional dielectric barrier, but the gap between RVC electrode and the quartz glass tube is filled with glass beads (Fig. 4). This way, the DBD is transformed into the surface discharge developing on glass beads, instead of bridging the gas gap.
Figure 4. DBD reactor with RVC electrode and glass spheres
As a source of nanosecond pulses, we used the NPG-15/2000 pulse generator by Megaimpulse Ltd., producing negative voltage pulses of 29 kV with the repetition rate in the range of 50 Hz – 3.0 kHz. Typical voltage and current pulses are presented in Fig. 5. The voltage pulse is not influenced by the presence of H2S in the gas, but the current
pulse decreases significantly. Voltage pulses were measured using the Tektronix P6015A high voltage probe , whereas current pulses were measured using the Pearson 2877 coil. The discharge power was calculated by multiplying the repetition rate by a single discharge pulse energy (Ep), which
was obtained after the experiment by the integration of the pulse voltage (U) times the current (I) over the pulse duration (t):
p pulse
( ) ( )d( )
E
U t I t t (1)Figure 5. Typical voltage and current pulses in the Reactor No. 1 with and without H2S in the processed gas
The gas composition before and after the processing in the DBD reactor was analyzed using FTIR spectrophotometer and gas chromatograph. For the measurements of CO2, CO
and CS2, the FTIR Nicolet 380 spectrophotometer with gas
cell of 10 cm optical path length and CaCl2 windows was
used. It was calibrated using certificated mixtures delivered by Linde Gaz Polska Ltd.: N2:CO2 (50 % : 50 %), N2:CO
(90 % : 10 %) and N2:CS2 (99 % : 1 %). Every single
component was calibrated with a single mixture diluted in several proportions by nitrogen in a flowing regime, i.e. nitrogen stream was mixed with a stream of one compound and then introduced into the FTIR spectrophotometer. Mass flow controllers were used for accurate control of flow rates of each stream. The precision of the measurements of CO2,
CO and CS2 was 90 ppm, 7 ppm, and 1.3 ppm, respectively.
The diagnostics of H2 and CH4 was carried out using the
SRI 8610C gas chromatograph with the gas sampling valve, TCD, molecular sieve column and argon as a carrier gas. When the gas chromatograph was equipped with the FID and Hayesep Q column, then CH4 and other hydrocarbons
were detected. The gas chromatograph was calibrated towards H2, CH4, C2H2, C2H4, C2H6 and C3H8 with the same
with pure gases whereas C2 and C3 hydrocarbons were
calibrated using certified mixtures composed of 5 % of each
components and nitrogen. The precision of the
measurements of H2, C2H2, C2H4, C2H6 and C3H8 was 50
ppm, whereas for CH4 it was only 450 ppm.
Unfortunately, hydrogen sulphide could not be measured neither with FTIR spectrophotometer (too low sensitivity when using 10 cm gas cell) nor GC (no detection available). For monitoring H2S concentration we used colorimetric gas
detection tubes by Dräger Safety AG, Germany.
Since the DBD formed in our reactor emits relatively strong light when applying high voltage, it was possible to apply optical emission spectroscopy. For that purpose, Mechelle 5000 spectrometer with ICCD i-Star camera by Andor Technology, equipped with UV transmitting optical fiber, was used.
The temperatures of the processed gas at the inlet and outlet of the DBD reactor was measured with thermocouples. Initial gas temperature was kept at 19 °C all the time during the experiment.
Results and discussion
A. Gas composition
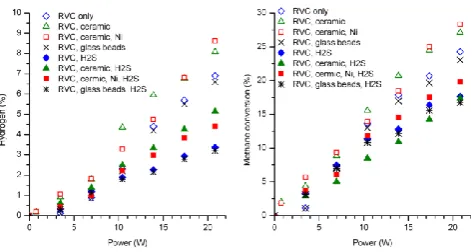
The hydrogen production is exactly the same in the DBD reactor without and with the porous ceramic barrier when no catalyst and no H2S is present (Fig. 6). It suggests the same
mechanism of hydrogen formation from methane. In the presence of Ni, the highest H2 concentration observed at the
discharge power of 22 W, is also the same as in the other cases, but the shape of the curve describing the hydrogen production is different. After extrapolating all 4 curves obtained when using all of the reactors, and without H2S,
one can conclude that concentration of hydrogen is about to the highest value when no catalyst is used, i.e. the H2
production is decreasing, whereas in the presence on Ni the production of hydrogen may still increase, with the potential of giving much more hydrogen. This leads to another conclusion, that the activity of Ni catalyst grows with the DBD power.
Figure 6. Concentrations of H2 and methane conversion in the gas mixture processed by DBD with RVC electrode in Reactors No.1-3
methane conversion degree (Fig. 6) and CO concentrations (Fig. 7). It is clear that at the highest discharge power of 22 W, in the experiment without the porous ceramic barrier, the CO concentration have reached the maximum, and with the ceramic free of the catalyst, it is close to a maximum, whereas in the presence of the catalyst in the porous ceramic the CO concentration still grows linearly. These differences in the shape of the curves may be explained by the different temperature of the gas in the plasma region. Simple modelling using a Thermodynamic Equilibrium Reactor (TER) shows a very similar tendencies at an assumption that the gas is heated up by the DBD to 300 K, 600 K and 800 K in the Reactor No. 2 with the catalyst, in the same reactor without the catalyst, and in the Reactor No. 1, respectively. This assumption is reasonable since, as seen in Fig. 3, the DBD in the reactor with the RVC electrode only forms a low number of filaments with plasma, which is more luminous and therefore hotter than uniform and less intensive plasma in the reactor with the additional ceramic barrier.
Figure 7. Concentrations of CO in the gas mixture processed by DBD with RVC electrode in Reactors No.1-3 and calculated using TER model.
It is clear from Figs. 6 and 7 that the addition of H2S to the
CH4:CO2 mixture inhibits the methane conversion and the
production of hydrogen and CO in the DBD reactors. In the group of results obtained when H2S was present in the gas
mixture, the lowest production of hydrogen was observed in the reactor with RVC only (Reactor No. 1) and in the reactor packed with glass beads (Reactor No. 3), whereas the highest – in the reactor with ceramic tube but not saturated with Ni catalyst (Reactor No. 2). Hydrogen concentrations are 40-60 % lower comparing to the results for the mixture without H2S. Such a high influence of H2S on the hydrogen
concentration cannot be explained by the gas phase reactions only, since the concentration of H2S is almost
1000 times lower than methane. Hydrogen sulphide (Fig. 8) is decomposed in 90-96 % simply into hydrogen and solid sulphur. The contribution of H2 from H2S into the total
balance of H2 is small, i.e. below 1000 ppm, which and can
be hardly distinguished. On the other hand, the formation of solid sulphur is clearly visible on the reactor wall (Fig. 9). The deposited sulphur forms a resistive layer which decreases the discharge current (Fig. 5). The only product of the H2S reactions with CH4, is CS2 seen in the FTIR spectra
(Fig. 10). Since CS2 is well recognized in the spectra, it
2H2S + CH4→ CS2 + 4H2, (2)
is the main one involving H2S. This conclusion is supported
by the results obtained experimentally and via modeling by Petherbridge et al.7 They proposed a scheme of subsequent
reactions:
CS2 + H → CS + HS, (3)
H + SH → S + H2, (4)
2HS → S2 + H2. (5)
Carbon disulfide is an intermediate by-product. It is
decomposed in reaction (3), causing a drop of CS2
concentration when H2S concentration is too low to support
high CS2 production. This process is well seen in Fig. 8,
showing a peak in CS2 concentration at the DBD power of
10 W. It is interesting that Sekine et al. have obtained exactly the same CS2 profile, when increasing the DBD
current.5 In their experiment, they were able to use much
higher power and obtain the complete decomposition of carbon disulfide. They also found, that the final product of H2S transformations is solid sulphur, depositing on the
reactor wall.
Figure 8. Concentrations of H2S and CS2 in the gas mixture processed by DBD with RVC electrode in Reactors No.1-3 and calculated using TER model (only H2S)
Figure 9. Sulfur deposited on the reactor cylinder
It is interesting to note, that the decrease in H2S
concentration in all of the reactors (Fig. 8) is close to the results obtained from the TER model, similarly as in the case of CO. This may prove the conclusion on the different temperature of the gas in the plasma region in all studied reactors.
The concentrations of the hydrocarbon by-products detected in the gas mixture processed by the DBD in the different reactors are shown in Fig. 11. The formation of acetylene, as was observed in our previous experiments, is not related to the syngas production.8 The biogas processing
in the DBD reactor with the RVC electrode only resulted in the small concentrations of acetylene, not exceeding 0.126 % at the maximum discharge power of 22 W.
Figure 10. Typical FT-IR spectra of gas exiting DBD reactors with RVC electrode. Discharge power 22 W.
Adding the porous ceramic barrier caused the increased production of acetylene. Up to the level of 14 W of the discharge power, the concentrations of C2H2 are similar
when the ceramic is free or impregnated with Ni. Further power increase reveals an activation of the Ni catalyst towards the decomposition of the acetylene, concentration of which drops dramatically down to 0.065 % at 22 W. In the presence of 1000 ppm H2S in the processed gas, this
drop is not observed. The most probable reason is poisoning of the Ni catalyst by sulphur, which suppresses the activation of the catalyst.
Figure 11. Concentrations of C2H2, C2H6, C2H4 and C3H8 in the gas mixture with H2S processed by DBD with RVC electrode in Reactors No.1-3.
C2 hydrocarbons still grow. On the other hand, the
production of propane is quite different. The concentration of C3H8 increases almost linearly till the last point of the
DBD power.
Generally, the lower concentrations of all detected hydrocarbons in the reactor with the RVC electrode only (Reactor No. 1) result from the lower methane conversion (Fig. 6), which also explains the differences in the results obtained using each of the reactors. According to the results of the modelling performed by De Bie et al., the increase in the methane conversion degree up to 20 % is accompanied with the increase in concentrations of acetylene, ethylene and ethane and decrease in propane concentration, exactly as we observed.9 Chemical reactions responsible for the
production and the consumption of C2H2, C2H4, C2H6 and
C3H8 are as follows. Acetylene and ethylene are produced
mainly in one reaction:
C2H3 + C2H3→ C2H2 + C2H4 (6)
where C2H3 radicals results from the recombination of CH
and CH3 radicals produced directly from CH4 in the
electronic reaction:
CH + CH3→ C2H3 + H (7)
In reactions of recombination and hydrogenation of C2H5
radicals ethane and propane molecules are formed:
C2H5 + C2H5→ C2H6 + C2H4 (8)
C2H5 + CH3→ C3H8 (9)
As predicted by the calculations of De Bie et al C2H5 is
formed mainly by hydrogen attachment to C2H4:9
C2H4 + H → C2H5 (10)
As can be seen in Fig. 11, hydrogen sulphide does not influence much higher hydrocarbons production, except acetylene. When comparing to the highly influenced methane conversion and hydrogen production, one can conclude that the formation of higher hydrocarbons is not controlled by the electronic reactions but by the gas temperature. Since in the experiment with H2S we observed
formation of the sulphur resistive layer causing the drop in the discharge current, it means that the rest of the power
gas temperature is enough to influence C2 and C3
hydrocarbons production, but not enough to play a role in CH4 dehydrogenation. Therefore, still the key reaction in the
methane conversion and hydrogen production is the dissociation of methane molecules by the energetic electrons.
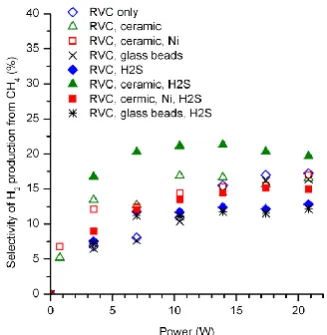
The selectivity of the hydrogen production (Fig. 12) shows that only up to 21 % of hydrogen atoms from the methane molecule leaves the DBD reactors as H2. The rest
forms higher hydrocarbons and water vapour. The highest selectivity was recorded in the experiment with H2S in the
gas processed in the reactor with the ceramic tube not saturated with Ni catalyst at the DBD power of 11 W. At the higher DBD power, the selectivity in this reactor drops slightly, whereas in the other cases H2 selectivity grows up
to the highest values at 22 W. The influence of the DBD reactor configuration and the presence of H2S on the
hydrogen selectivity is not so well seen as in the case of concentrations of all the measured products.
Figure 12. Selectivity of hydrogen production from methane in the gas mixture processed by DBD with RVC electrode in Reactors No.1-3.
B. Plasma diagnostics by OES
The typical spectra in the range of 250-450 nm recorded in this experiment are presented in Fig. 13. Increasing the DBD power results only in the increased intensity of each band. It means that more light from the increasing number of streamers generated during the discharge was emitted. At the same time the discharge energy transfer into the gas in the form of heat was very low. Temperature of the gas leaving the DBD reactors increased with the discharge power but only up to 38 C (at 15 W delivered to the discharge).
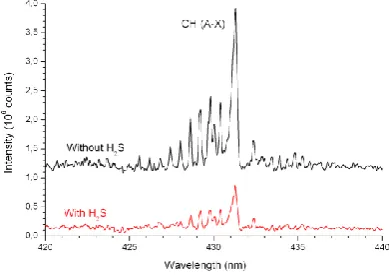
In the recorded spectra most of the bands originated from N2+ second positive system except those marked as CH
bands and C triplet. The highest CH band is from CH (A-X) transition. What is important when analyzing an influence of the hydrogen sulphide presence on the DBD plasma is that the CH (A-X) band (as well as other bands marked in Fig. 13) is less intensive comparing to the experiment without H2S (Fig. 14). The lower intensity of the bands can be
caused either by the lower discharge current in the gas with H2S or by the reaction (2), in which a portion of methane is
When comparing the spectra recorded in the experiments with 3 different reactor configurations, it is seen that in all cases plasma composition is similar (Fig. 15). There are no significant differences in those spectra except the CH (A-X) and CH (B-X) bands, which are higher in the reactor with the ceramic tube but without the Ni catalyst.
Figure 13. Optical emission spectra of the DBD in Reactor No. 1 for the repetition rate of nanosecond pulses 500-3000 Hz. Processed gas mixture CH4:CO2:H2S
Figure 14. Comparison of optical emission spectra obtained in the DBD reactor No. 1 with and without H2S in the CH4:CO2 mixture in the range of CH (A-X) band. Repetition rate of nanosecond pulses 1 MHz
Figure 15. Optical emission spectra of DBD plasma generated in CH4:CO2:H2S mixture processed in reactors No. 1-3. Repetition rate of nanosecond pulses 1 MHz.
Conclusions
Processing of the CH4:CO2: (70 % : 30 % : 1000 ppm) gas
mixture simulating dry biogas, using different dielectric barrier discharge reactors with reticulated vitreous carbon high voltage electrode and nanosecond high voltage pulses showed, that:
• Presence of the additional ceramic barrier in the DBD
reactor strongly influences plasma properties and
consequently the production of syngas and higher hydrocarbons. The plasma is more uniform and colder, which results in different kinetics, comparing to the reactor without the additional barrier.
• Nickel catalyst incorporated in the additional ceramic barrier can by activated by the discharge at higher power. After being activated it supports acetylene decomposition.
• Sulphur produced from H2S during the process changes
the resistivity of the DBD reactor causing decrease in the discharge current. As a result, the production of syngas and methane conversion decreases.
• Electron impact dissociation of CH4 resulting in the
formation of CH3 radical starts the conversion process. This
radical initiates recombination reactions towards higher hydrocarbons such as C2H6 and C3H8. A further play of
dissociation and recombination leads to the conversion towards C2H2 and C2H4. Finally, dissociation of CH4 and the
higher hydrocarbons also results in the formation of H2.
Production of CO is separated from the methane conversion. This work was carried out using gas of room temperature and without water vapor normally present in the real biogas. Thus, in the real biogas we may expect much higher hydrogen production efficiency and methane conversion degree as observed by other researchers conducting the plasma assisted steam reforming of methane. Moreover, at such conditions the reactions involving hydrogen sulphide and its influence on by-products may be different than those described in this paper.
Acknowledgements
This work was supported by the National Science Centre under the project No. 2011/01/B/ST8/04131.
References
1Nozaki, T., Tsukijihara, H., Fukui, W., Okazaki, K., Energy &
Fuels,2007, 21, 2525.
2Goujard, V. Tatibouet, J.M., Batiot-Dupeyrat, C., Appl. Catal. A,
2009, 353, 228.
3Yang, Y.C., Lee, B.J., Chun, Y.N., Energy, 2009, 34, 172.
4Chun, Y.N., Yang, Y.N., Yoshikawa, K., Catal. Today, 2009. 148, 283.
5Sekine, Y, Yamadera, J., Matsukata, M., Kikuchi, E., Energy &
Fuels, 2008, 22, 693.
6Sekine, Z., Yamadera, J., Matsukata, M., Kikuchi, E., Chem. Eng.
Ashfold, M. N. , Physical Chemistry Chemical Physics, 2002,
4(20), 5199.
8Dors, M., Izdebski, T., Berendt, A., and Mizeraczyk, J., Int. J.
Plasma Environ. Sci. Technol., 2012, 6(2), 93.
A., Plasma Process Polym., 2011, 8, 1033.