ISSN: 2501 - 1235 ISSN-L: 2501 - 1235 Available on-line at: www.oapub.org/edu
doi: 10.5281/zenodo.3265922 Volume 5 │ Issue 10 │ 2019
ASSESSMENT OF PRE-SEASON ANTHROPOMETRIC
TESTS OF RUGBY PLAYERS IN A CHAMPIONSHIP CLUB,
KENYAN RUGBY UNION
Anthony Muchiri Wangui1i,
Maximilla N. Wanzala2,
Micky O. Olutende1,
Edwin K. Wamukoya1
1Department of Health Promotion and Sport Science, School of Public Health, Biomedical Sciences and Technology, Masinde Muliro University of Science and Technology, Kakamega, Kenya 2Department of Public Health, Epidemiology and Biostatistics, Masinde Muliro University of Science and Technology,
Kakamega, Kenya
Abstract:
Objective: The objectives of the present study were to evaluate the anthropometric
factors of rugby players on preseason before the onset of the training in a championship club (Kisumu Rugby Rfc Setting: The study was carried out in a Kenya at a Kenya rugby union (Kisumu Rfc) championship club. Sample: Sampling frame consisting of 52 players who were registered in the club at the time of the study. (n =52) Analysis:
Data were analyzed through descriptive and inferential statistics, linear and multiple regression analyses. Main measures: Maximal Aerobic power, demographics and strength tests of back squat and Bench press. Results: The estimation of this hypothesized factors that affect maximal aerobic power were age, Primary position, weight, injury F (7,44) =.622, P<.735, R2=. There was correlation between several factors
that affect maximal aerobic factors with the linear regression formula generated being Maximal Aerobic Power (VO2Max) = 12.12 + (0.49xAge) - (017xWeight) –
(0.657xPosition) + (257X FMSTM (z-score) – (0.52x100m) + (.170xPlanks) +
(0.37xPush-ups) Conclusion: aerobic power (VO2Max) is influenced by several factors including
age of the rugby players, weight of the players and the playing positions of the players.
Recommendation: Future research should further clarify how preseason testing and
anthropometric tests of rugby players would influence the outcome on fitness before the start of the season which the ultimate goal of most rugby players and coaches.
│ │
Keywords: maximal aerobic power, injury, rugby players, bleep test, Kenya Rugby
Union, Kisumu
1. Introduction
Rugby is categorized among one of the most demanding sports that require players to make bouts of sprints, tackles and Contact physical collisions (Gabbett, Kelly & Peze, 2007) approximately, rugby players cover a distance of about 8 to 10 km each match and this highly depends on their playing position on the field (Meir, Newton, Curtis, Fardell & Butler, 2001). Rugby union is a contact sport in which players require high levels of physical fitness, composite of aerobic fitness and anaerobic endurance, muscle strength and power, speed, agility and body composition (Hene, Bassett & Andrews, 2011). This places a huge responsibility upon elite players to achieve and maintain good physical fitness pre-and in-season to sustain the physical demands of the game and avoid Injury (Caldwell & Peters, 2009). (Die samestelling van’ n rugbyspeler-indeks vir die suksesvolle
evaluasie van rugbyspelers, 2014) it’s important to note that several studies have reported
The study was conducted to among the championship players of Kenya rugby seeking to find out the anthropometric characteristics of the players prior to the start of the preseason. To date, no published study has monitored the physical fitness levels pre-season of Kenya rugby union players in the championship competition; hence, the purpose of our study. This is important because the primary goal of pre-season training is to optimize fitness and enhance performance during in-season competition (Granados, Izquierdo, Ibáñez, Ruesta & Gorostiaga, 2008). Thus, this study will be able to determine the physical characteristics of Kenyan championship rugby players in a selected club using the anthropometric evaluation and a battery of fitness tests which include Bleep test, bench press, Back squat test, 40m Acceleration, 100m Sprint sit and reach test, bleep test, Burpees, one-minute Sit-up and one minute Push-ups test. A FMSTM was utilized to identify the muscle imbalances of the players before
commencement of the test. The study hypothesized that there would be a significant difference between the physical fitness characteristics of male rugby players forwards and backs in the championship competition during the pre-season (Gabbett, 2005; Gabbett, King & Jenkins, 2008).
2.Procedure
A.Instruments
The data was collected using protocols which players were asked to fill their basic information, i.e. name, address, medical insurance cover and presence or history of injury on the player. A music system was tested for audibility of the Bleep test. Space markers were used to mark the 100 meters and 40 meters on a relatively flat surface on the rugby pitch. Stopwatches were used to time the 100meters sprint, 40meters acceleration and 1-minute sit-up and push-up test. Weights ranging from 5kgs plates to 20kgs plates were assembled with a chest press bench and a back-squat machine with bars availed. A meter rule and piece of masking tape were used on a flat wooden surface to evaluate the FMSTM on the players. All the results were recorded on the
players’ protocol form.
B.Subjects
│ │
were given to the players in detail. All procedures were approved by the institutional ethical review committee.
C.Anthropometry
The anthropometry data from the players was collected i.e. height, bodyweight and estimated maximal aerobic power (bleep test) were the test performed. The 40m acceleration test and 100m sprint test were done outdoor on the rugby pitch. The tests were performed outside on the field with the sit-ups, Push-ups, Chest press and the Back Squat were done indoors (temperature at 30 + 1.0oC and humidity at 70.0 + 5%). The players had been advised to take a rest 48 hrs prior to the testing with adequate rest and hydration.
D.Speed and Acceleration
Start speed, acceleration, and speed performance are critical factors affecting directly rugby player’s performance especially the Backs (Yıldız et al., 2018). The player’s acceleration was measured by the time taken to cover the 40m on the rugby pitch. Players were encouraged to go on full flight past the space marker to achieve the best times. For speed maintenance, players were asked to complete the 100m dash after resting from the 40m run. The time taken to cove the 100m was recorded as players were encouraged to run as fast as possible. The intraclass correlation coefficients for test-retest reliability were 0.95, 0.97, and 0.97, respectively, and typical errors of measurement were 1.8%, 1.3%, and 1.2%, respectively.
E.Maximal Aerobic Fitness
Depending on the level of competition, rugby union matches last 60–90 minutes averagely, with players covering 8,458– 9,929 m per match (Meir, Colla & Milligan, 2001). This shows how players require rugby union players require high levels of high levels of aerobic fitness to aid in recovery after high bouts of intensity activity (Ramsbottom, Brewer & Williams, 1988). Maximal Aerobic fitness (VO2max) was
assessed using the Multi-Stage Fitness Test (MSFT) CD (Multistage Fitness Test AA1CD; National Coaching Foundation, Leeds, UK) (Bleep Test). All participants performed the MSFT following the set procedures and protocols (Leger & Lambert, 1982) of running back and forth (i.e., Shuttle runs) along a 20m track. Participants’ scores were recorded as the level and number of shuttles immediately before the beep on which they were eliminated. participants’ scores (level and shuttle number) were then converted to predicted VO2 max values using the conversion table of Leger and Lambert (Leger & Lambert, 1982).
F.Maximal strength
are required to provide a fast play the ball speed and facilitate effective leg drive in tackles, scrums and rucks situations of the game. This has been examined by several studies concentrating on the strength characteristics of rugby players (Meir, Newton, Curtis, et al, 2001; O’Connor, 1996; Atkins, 2004; Baker, 2001; Baker, 2001; Baker, 2002; Baker, 2003; Baker, Nance, Moore, 2001; Warman, Humphries, Coutts, 2000; Coutts, Murphy, Dascombe, 2004). The 1RMBP was used to test for upper extremities strength.
Bench press (elbow extension, shoulder flexion, and horizontal adduction) was chosen because it seems most specific (Granados, Izquierdo, & Iba, n.d.) and the 1RMSQ was
used to measure for the lower body strength both in forwards and backs.
G.Muscular Endurance
Muscular endurance was evaluated using the 60s sit ups and push-ups method.
H.Functional Movement Screen (FMSTM)
The Functional Movement Screen™ (FMSTM) was designed to screen for the general
inability to move freely, symmetrically and without pain (Cook, Burton, Hoogenboom, & Voight, 2014). It was designed as a simple tool that could be used to identify compensatory motions, imbalances or asymmetries prior to the onset of exercise(Frost, Beach, Callaghan, & Mcgill, 2013). A Deep squat (SQT) with a dowel is placed over head with the arms outstretched and the individual squats as low as possible. Each participant was given three trials on each of the seven tests (deep squat, hurdle step, in-line lunge, shoulder mobility, active straight leg raise, trunk stability push-up and rotary stability). Each trial was scored on a scale of 0-3 with pointers as Good depth, weak Gluteal and Falling Over as observable cues during the test.
3.Statistical procedures
│ │
4.Results
A total of 52 players were involved in the study 76.92% of the respondents were Backs while 23.08% were forwards as their primary positions. The mean age of the respondents was 22.942 ±SD 3.208 and a range of 13.
Table 1: Age Statistics
Age
N 52
Mean 22.9423
Std. Error of Mean .44486
Median 22.5000
Std. Deviation 3.20792
Std. Error of Skewness .330
Range 13.00
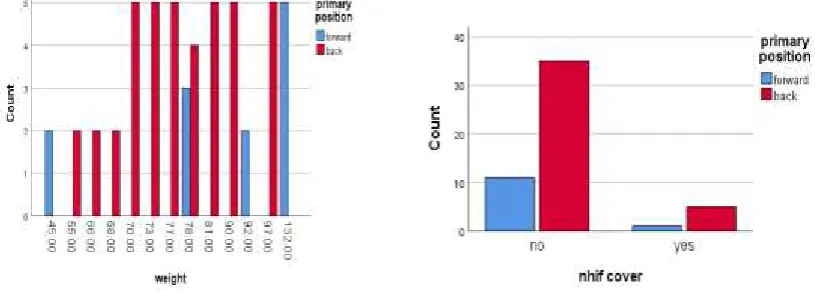
The players displayed a mean weight (kgs) of 82.654± SD 20.093 with a median weight 78.00 with a range of 87.00. A cross tabulation was conducted on the weight and primary positions of the players. This displayed that majority of the heavy players were the Backs 76.92% but despite this observation majority 9.615% of the forwards were the heaviest. There was a significant correlation between the weight and primary position of the players (ꭓ2=42.343, df=12, P˂.0001). Cross tabulation with other secondary
positions did not show any significant changes in the information. Majority 88.5% (46) of the players were not covered with any insurance cover despite Rugby being a contact and a sport that has injuries only 11.5% of the players were covered with the National Hospital Insurance Fund (NHIF). Most of the backs 76.1% did not possess an NHIF cover while 83.3% of the population that had NHIF cover was constituted of Backs.
Figure 1: Crosstabulation of primary position and weight and NHIF
1.9% were hypertensive. When subjected to the FMSTM 44.23% of the respondents
obtained a good depth, 30.77% were falling over while 25.00% had a combination of weak gluteus/core muscles. A cross tabulation on the injury and the FMSTM indicates
that there was a non-significant relationship between injury/ medical condition and FMSTM (ꭓ2=10.574, df=10, P˂.392), although majority of the players indicated they had
knee issues, majority of them were able to achieve a Good depth in FMSTM.
Figure 2: Crosstabulation of Injury and FMS
The statistics were run for the bleep test multistage descriptive depicting that the minimum level attained for the players was a level 5 shuttle 5 with the maximum level attained was a level 12 shuttle 2. The mean level of the participants was a level 9 shuttle 8.
Table 2: Bleep-Test/VO2Max Statistics
N Minimum Maximum Mean Std. Deviation Skewness Kurtosis Statistic Statistic Statistic Std. Error Statistic Std. Error
bleep test 52 5.50 12.20 9.8715 1.87834 -.766 .330 .235 .650
The mean speed on 100m of the players was 12.533s ±SD .627 range 2.35. although the forwards displayed a slower pace compared to the backs the correlation between player’s position and the speed showed that there was a non-significant relationship between the two (ꭓ2=16.322, df=17, P˂.501).
│ │ Figure 3: Speed of the Players
A recorded strength test was done using the bench press and squat test was conducted. A bench press means of 59.54kgs±SD16.713 with a range of 40 with the Back squat mean 107.615kgs±SD22.742 with a range of 84.0. a correlation between the primary position and the strength test was conducted with the bench press (ꭓ2=2.476, df=2, P˂.290) and
the Back squat (ꭓ2=11.564, df=8, P˂.172). A maximal exertion push up test was also
conducted yielding a mean 29.07±SD 9.376 with range of 37.
Figure 4: Bench press and Squat outcomes
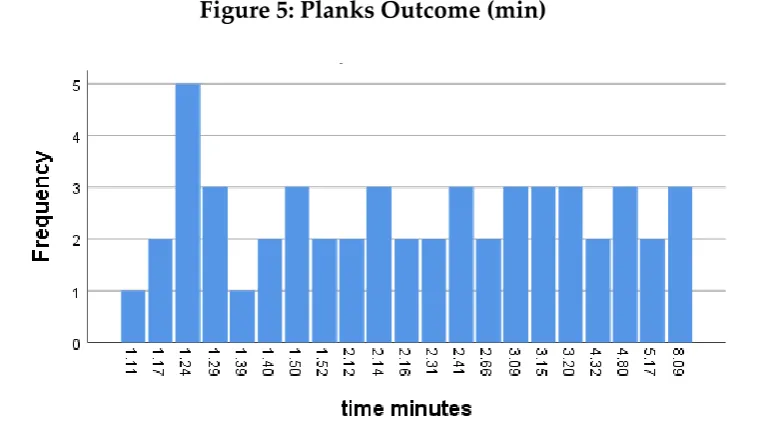
Figure 5: Planks Outcome (min)
A test of muscular endurance was done with one-minute maximum Burpees and Sit-ups. The results yielded on Burpees were a mean of 27.673±SD6.09 range 27 and on Sit up a mean 42.885±SD7.926 range 29. The correlation between primary position and sit-ups was done (ꭓ2=16.557, df=13, P˂.220) and between primary position and push-ups
(ꭓ2=11.564, df=8, P˂.172).
A linear regression correlation was done between age of the respondents, primary position of play and Bleep test outcomes.
An R, .080 shows a good measure of the quality of the prediction on the dependent variable Bleep test (VO2Max). The equation predicted a good of fit model
with an Anova scores of F (2,49) = .156, P<.856, R2=.006. The prediction formula yielded
was a Maximal Aerobic Power:
(VO2Max) = 10.479 - (.350 x Position) + (.001 x Age)
Table 3: Anova outcome bleep test regression
Model Sum of Squares df Mean Square F Sig.
1 Regression 1.138 2 .569 .156 .856b
Residual 178.798 49 3.649
Total 179.936 51
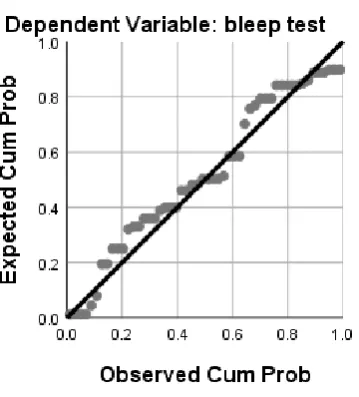
a. Dependent Variable: bleep test
│ │ Figure 6: P-P plot on Bleep test
Further regression was conducted to predict back squat strength vis a vis age of the respondents and their primary position. The predicted line of good fit was R= .I84 and a good measure of the quality of the prediction (Back Squat strength) the values are F
(2,49) = .873, P<.424, R2=.034.
Table 4: Anova back squat regression outcomes
Model Sum of Squares df Mean Square F Sig.
1 Regression 907.840 2 453.920 .873 .424b
Residual 25468.468 49 519.765
Total 26376.308 51
a. Dependent Variable: back squat
b. Predictors: (Constant), age, primary position
Figure 7: P-P plot for back squat regression
F (7,44) =.622,P<.735, R2=.090. The regression prediction equation was Maximal Aerobic
Power:
(VO2Max) = 12.12 + (0.49 x Age) - (017 x Weight) – (0.657 x Position) + (257 x
FMSTM (z-score) – (0.52 x 100m) + (.170 x Planks) + (0.37 x Push-ups)
Table 5: ANOVAa outcomes for multiple regression
Model Sum of Squares df Mean Square F Sig.
1 Regression 16.213 7 2.316 .622 .735b
Residual 163.724 44 3.721
Total 179.936 51
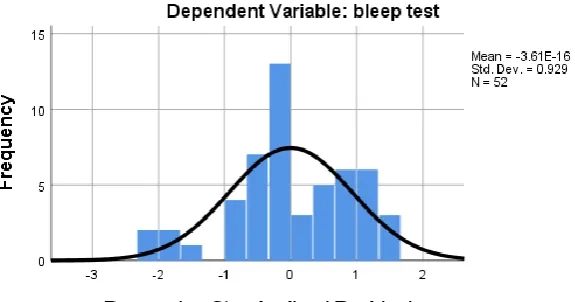
a. Dependent Variable: bleep test
b. Predictors: (Constant), push up , weight, speed 100 meters , FMSTM , primary position , planks , age
Figure 8: Bleep test Histrogram
│ │
5.Discussion
The total number of respondents was 52 with 76.92% of the respondents were Backs while 23.08% were forwards as their primary positions. The mean age of respondents was 22.9 yrs. ±SD3.208 this was a clear indication that most of the rugby team players were young players. The average weight of the players was 82.654Kgs± SD 20.093 with a median weight 78.00 with a and range of 87.00. backs were the heaviest with 96.15% being a bulk of them. There was a high significant correlation between the weight of the players and their primary position (ꭓ2=42.343, df=12, P˂.0001) consequently there was a
high significant correlation between the age of the players and their occupation (ꭓ2=40.206, df=20, P˂.005) although Majority 73.08% (38) of the respondents were
students while businessmen and those employed were 13.46% respectively. majority 38.5% did not have any injury during the study, 28.8% had a knee injury, 17.35% suffered an ankle injury, 3.8% had low back problems 9.6% had a shoulder injury while 1.9% were hypertensive, this indicates that injury in inherent in the sport of rugby (Maina, 2016). On the FMSTM 44.23% of the respondents obtained a good depth, 30.77%
were falling over while 25.00% had a combination of weak gluteus/core muscles this indicates that the most of the players presented with muscle imbalances during the test (Dorrien, 2015). Although injuries could be a clear causation to poor scores in the FMSTM
test (K Kiesel, Plisky, & Butler, 2011) results showed there was a was a non-significant relationship between injury/ medical condition and FMSTM (ꭓ2=10.574, df=10, P˂.392).
This explains the reason why despite majority of the players presented with knee issue they still managed a good depth score on the FMSTM.. (Kay & Blazevich, 2012)
On the maximal aerobic power VO2Max the minimum level attained for the
players was a level 5 shuttle 5 with the maximum level attained was a level 12 shuttle 2. The mean level of the participants was a level 9 shuttle 8. The Z-scores attained averaged showed that most of the players were on an average of 9.8715 depicting average fitness (Leger & Lambert, 1982). On speed maintenance 100m test the average time was 12.533s ±SD .627 range 2.35 but the forwards who are generally slower compared to the backs showed a non-significant correlation between player’s position and 100m speed (ꭓ2=16.322, df=17, P˂.501) (Yıldız et al., 2018).
Acceleration was evaluated using the 40m dash test which players presented with an average of 4.707±SD.268 range 1.04 median 4.720 sec. A correlation was carried out to test out the association and correlation between the player’s primary position and the 40m acceleration which showed a significant correlation between the 40m acceleration test and the players position (ꭓ2=29.467, df=17, P˂.030) while on the 100m
speed test there was an insignificant correlation between the player’s position and the 100m speed test (ꭓ2=16.322, df=17, P˂.501) this replicates the study on rugby positions
speed wise and performance (Pasin et al., 2017).
between bench press and primary position of the player (ꭓ2=2.476, df=2, P˂.290) (Chong
et al., 2014) while the Back squat indicated a stronger correlation significant correlation (ꭓ2=11.564, df=8, P˂.172) (Oprean et al., 2017).
The maximal exertion pus-ups yielded a mean of 29.07±SD 9.376 with range of 37 with the core stability plank test yielding a mean 2.757±SD1.762 with a range of 6.98. There was a strong correlation but a non-significant relationship between the plank test and the primary positions of the players (ꭓ2=23.646, df=20, P˂.258) this agrees with other
studies done on the same (Pasin et al., 2017; Frost et al., 2013; Kay & Blazevich, 2012). Burpees and sit-ups done yielded a mean of 27.673±SD6.09 range 27 and a mean 42.885±SD7.926 range 29 respectively. The Burpees showed a strong correlation but insignificant when (ꭓ2=16.557, df=13, P˂.220) while the sit-ups showed a high correlation
and non-significant relationship with the players’ primary position (ꭓ2=11.564, df=8,
P˂.172)(Gabbett, King, & Jenkins, 2008) explained in their study the correlations between the maximal power and its influence on players position.
A linear regression showed that maximal aerobic power (VO2Max) could be
depicted with a regression formula; Maximal Aerobic Power:
(VO2Max) = 12.12 + (0.49 x Age) - (017 x Weight) – (0.657 x Position) + (257 x
FMSTM (z -score) – (0.52x100m) + (.170 x Planks) + (0.37 x Push-ups)
This was made possible through linear regression where the variables were found to depict a good line of fit with a value of F (7,44) =.622,P<.735, R2=.090(Article,
2002).
6. Conclusions
From the study it is clear that maximal aerobic power (VO2Max) is influenced by several
factors including age of the rugby players, weight of the players and the playing positions of the players.
Muscles imbalances detected through the FMSTM is a clear predictor of injury
during preseason and should be utilized to inform coaches on the Frequency, Intensity Type and Time of training to be effected through the preseason training
7.Recommendations
│ │
Declarations
Ethics approval
Ethical clearance was obtained from Masinde Muliro University of Science and Technology Ethics Committee.
Competing interest
The authors declare that they have no competing interests.
Authors & contributions
Dr. Maximilla Wanzala and Prof Edwin Wamukoya conceived, designed and performed the study. Anthony Muchiri and Micky Olutende Oloo analyzed the data. All authors read and approved the final manuscript.
Disclaimer
The findings and conclusions presented in this manuscript are those of the authors and do not necessarily reflect the official position of Masinde Muliro University.
References
Article, O. (2002). Physiological characteristics of junior and senior rugby league players. Chong, L. C., Yaacob, A., Rosli, M. H., Adam, Y., Yusuf, A., Omar-Fauzee, M. S., &
Sutresna, N. (2014). Physical Evaluation of Selected Malaysian National Rugby Players. (February 2011).
Die samestelling van ’ n rugbyspeler-indeks vir die suksesvolle evaluasie van rugbyspelers. (2014). 4102. https://doi.org/10.4102/satnt.v33i1.1235
Dorrien, J. M. (2015). History of Concussion and Current Functional Movement Screen Scores in a Collegiate Recreational Population.
Frost, M., Beach, T. A. C., Callaghan, J. P., & McGill, S. M. (n.d.). Journal of Strength and
Conditioning Research Publish Ahead of Print DOI: 10.1 519 /JSC. 0b013e3182a95343.
Gabbett, T., King, T., & Jenkins, D. (2008). Applied Physiology of Rugby League. 38(2), 119– 138.
Granados, C., Izquierdo, M., & Iba, J. (n.d.). Effects of an Entire Season on Physical Fitness in Elite Female Handball Players. (6), 351–361.
Kay, A. D., & Blazevich, A. J. (2012). Effect of acute static stretch on maximal muscle performance: A systematic review. Medicine and Science in Sports and Exercise,
44(1), 154–164. https://doi.org/10.1249/MSS.0b013e318225cb27
Kiesel, K., & Hall, W. G. (2007). Can Serious Injury In Professional Football Be Predicted By
Kiesel, K., Plisky, P., & Butler, R. (2011). Functional movement test scores improve following a standardized off-season intervention program in professional football players. 287–292. https://doi.org/10.1111/j.1600-0838.2009.01038.x
Maina, J. W. (2016). Incidence and Pattern of Injuries during the National Rugby Sevens Circuit. A dissertation submitted in partial fulfilment of the requirements for the Degree of Master of Medicine in Orthopaedic Surgery of The University of Nairobi .
Oprean, A., Alexandru, U., Cuza, I., Cojocariu, A., Alexandru, U., Cuza, I., … Cuza, I. (2017). Correlations between General Strength and Body Composition in Rugby Players
– the Backs Line. (January 2018). https://doi.org/10.29081/gsjesh.2017.18.2.14
Pasin, F., Caroli, B., Spigoni, V., Cas, A. D., Volpi, R., Galli, C., & Passeri, G. (2017).
Performance and anthropometric characteristics of Elite Rugby Players. (August). https://doi.org/10.23750/abm.v88i2.5221
Schneiders, A. G., Davidsson, Å., Hörman, E., & Sullivan, P. S. J. (2011). Original Research Functional Movement Screen TM Normative Values in a Young, Active Population. 6(2), 75–82.
Yıldız, S., Ateş, O., Gelen, E., Erdem, Ç., Bakic, D., & Sert, V. (2018). The Relationship
between Start Speed, Acceleration and Speed Performances in Soccer. 6(8), 1697–1700.
https://doi.org/10.13189/ujer.2018.060810.
Gabbett T., Kelly J., Pezet T. (2008). A comparison of fitness and skill among playing positions in sub-elite rugby league players. J Sci Med Sport. Nov;11(6):585-92. Epub 2007 Aug 27.
Caldwell B. P., Peters D. M. (2009). Seasonal variation in physiological fitness of a semi- professional soccer team. J Strength Cond Res; 25(5):1370-1377. [http://dx.doi. org/10.1519/JSC.0b013e3181a4e82f].
Granados C., Izquierdo M., Ibáñez J., Ruesta M., Gorostiaga E. M. (2008). Effects of an entire season on physical fitness in elite female handball players. Med Sci Sports Exerc;40(2):351-361. [http://dx.doi.org/10.1249/mss.0b013e31815b4905.
Gabbett T. J. (2005). Changes in physiological and anthropometric characteristics of rugby league players during a competitive season. J Strength Cond Res;19(2):400-408. [http://dx.doi.org/10.1519/00124278-200505000-00027]
Gabbett T. J., King T., Jenkins D. (2008). Applied physiology of rugby league. Sports Med; 38(2):119-138. [http://dx.doi.org/10.2165/00007256-200838020-00003]
Hene N. M., Bassett S. H., Andrews B. S. (2011). Physical fitness of elite women’s rugby union players. Afr J Phys Health Educ Recr Dance;17(Suppl 1):1-8.
Baker, D., & Nance, S. (1999). The Relation Between Running Speed and Measures of Strength and Power in Professional Rugby League Players. The Journal of Strength & Conditioning Research, 13(3), 230- 235.
Gabbett T. J. (2002). Physiological characteristics of junior and senior rugby league players. Br J Sports Med;36:334—9.
│ │
Alan M. Batterham, Will G. Hopkins (2005). Making Meaningful Inferences About Magnitudes. Sportscience 9, 6-13.
Meir R., Newton R., Curtis E., Fardell M., Butler B. (2001). Physical fitness qualities of professional rugby league football players: determination of positional differences. J Strength Cond Res 15:450—8.
Leger, L. A. and Lambert, J. (1982). A maximal multistage 20 m shuttle run test to predict VO2 max. Eur JAppl Physiol 49: 1–5.
Meir, R., P. Colla, And C. Milligan (2001). Impact of the 10-meter rule change on professional rugby league: Implications for training. Strength Cond. J. 23:42–46. Ramsbottom, R., J. Brewer, and C. Williams (1988). A progressive shuttle run test to
estimate maximal oxygen uptake. Br. J. Sports Med. 22:141–144.
Meir R., Newton R., Curtis E., et al (2001). Physical fitness qualities of professional rugby league players: determination of positional differences. J Strength Cond Res; 15: 450-8.
Atkins S. J. (2004). Normalizing expressions of strength in elite rugby league players. J Strength Cond Res; 18: 53-8
Baker D. (2001). Comparison of upper-body strength and power be- tween professional and college-aged rugby league players. J Strength Cond Res; 15: 30-5
Baker D. The effects of an in-season of concurrent training on the maintenance of maximal strength and power in profession- al and college-aged rugby league football players. J Strength Cond Res 2001; 15: 172.
Baker D. (2002). Differences in strength and power among junior-high, senior-high, college-aged, and elite professional rugby league players. J Strength Cond Res; 16: 581-5Baker D (2003). The effects of systematic strength and power training during the formative training years: a comparison between. Physiology of Rugby League 137 younger and older professional rugby league players. Strength Cond Coach; 11: 9-11.
Baker D., Nance S., Moore M. (2001). The load that maximizes the average mechanical power output during jump squats in power-trained athletes. J Strength Cond Res; 15: 92-7
Warman G., Humphries B., Coutts A. (2000). The effect of a six-month pre-season conditioning program on muscular strength and aerobic endurance in semi-professional rugby league players [abstract]. Proceedings of the Pre-Olympic Congress. International Congress on Sport Science, Sports Medicine, and Physical Education; Sep 7-12; Brisbane (QLD), 527
Coutts A. J., Murphy A. J., Dascombe B. J. (2004). Effect of direct supervision of a strength coach on measures of muscular strength and power in young rugby league players. J Strength Cond Res; 18: 316-23
O’Connor D. (1996). Physiological characteristics of professional rugby league players. Strength Cond Coach; 4: 21.
Creative Commons licensing terms