Technical Loss Estimation and Reduction in
a Typical Nigerian Distribution System: A
Case Study
Joel Egwaile1, Kingsley Ogbeide2, Austin Osahenvemwen3
1, 2
Department of Electrical/Electronic Engineering, University of Benin, Benin City, Edo State, Nigeria;
3
Department of Electrical/Electronic Engineering, Ambrose Alli University Ekpoma, Edo State, Nigeria. Email: [email protected]; [email protected]; [email protected]
Abstract - Nigeria’s electric power distribution network is faced with high technical power losses arising mainly from the radial nature of distrib1ution systems, long length of feeders and poor voltage profile. This work estimates the financial implication of the technical losses in a typical Nigerian distribution network and proposes ways to reduce it.
The existing Benin Electricity distribution company (BEDC) Asaba government core area injection substation distribution network comprising of a 15MVA 33/11KV power transformer and its two number radially connected 11KV feeders – SPC and Anwai road with their aggregate of ninety six (96) number secondary distribution 11/0.415KV transformers was modelled with ETAP 7.0.0 software, and a load flow analysis was carried on the modelled network using Newton-Raphson method deployed in the ETAP 7.0 software. This was done to determine bus voltages, real and reactive power losses in the network. Data used for the study were obtained from BEDC Asaba business district between June and August, 2017.
Analysis of the load flow results show that using the current multi-year tariff order (MYTO) for BEDC with the cost of a KWh of energy at N31.27 for residential customers as base, N1, 065,569,028.00 worth energy will be lost in the network within a ten-year period. Further analysis shows that a savings of N640,742,713.10 will be made within 10 years if the distribution network is compensated by optimally locating reactive power compensating devices.
Keywords- Compensating Devices, Financial Implication, Technical Losses, Financial Implication.
I.INTRODUCTION
Energy is defined as the capacity or ability for doing work. Therefore, any nation that seeks development must have serious business with energy development. Energy plays a major role in the economic, social and political development of any nation. Insufficient supply of energy limits economic growth, restricts socio-economic activities and adversely hinders the quality of life [1].
Figure 1. Energy Consumption per Capital for Selected African Countries [2].
II.POWER LOSSES IN ADISTRIBUTION SYSTEM
In [4]-[6], power losses refer to the amounts of electricity injected into the distribution grids that are not paid for by users. Total power losses have two components: Technical and Non-Technical power losses. Technical power losses (TL) are naturally occurring and consist mainly of power dissipated in the system components such as Distribution lines, transformers, power control equipment and measurement systems. Technical power losses are possible to compute and control, provided the power system network in question consists of known quantities of loads
Non-technical losses, on the other hand, are caused by actions external to the power system. Notable among these are electricity theft, non-payment of the energy used by the customer, use of substandard current transformer for industrial metering and industrial usage of electricity on low power factor amounting to undercharging and hence under billing by the utility company. Accurate reading of meters, poor customer billing, collection of billed amounts and proper accountability are functions that require specific management tactics. Non-Technical losses are more difficult to measure because these losses are often unaccounted for by the system operators and thus have no record information.
[7] acknowledged that various methods of loss minimization for distribution system are available in literature. But the basic methods are:
(i) Distribution Network Reconfiguration, (ii) Optimal Capacitor placement, and (iii) Distributed Generations (DGs) allocation. Network reconfiguration methods presented in [8]-[10] are effective methods for reducing power losses mostly used in low voltage distribution systems.
In the Optimum Capacitor Placement (OCP) technique, shunt capacitors are generally placed near the main substation for power loss reduction, voltage profile improvement, compensation of reactive power and power factor correction [11].
It is the basic problem to determine the location and size of fixed shunt capacitor which is to be installed in the distribution system in such way that the total system power loss is minimized, voltage profile of the system is improved but net annual saving is reduced. Regarding investment
The overall cost function with capacitor placement and real power loss can be written by following equation (1) [12].
Cost = + ∑ (1)
III. METHODOLOGY
The existing Benin Electricity distribution company (BEDC) Asaba government core area injection substation distribution network comprising a one number 15MVA 33/11KV power transformer and its two number radially connected 11KV feeders – SPC and Anwai road with their aggregate of ninety six (96) number secondary distribution 11/0.415KV
transformers was modelled with ETAP 7.0.0 software, and a load flow analysis was carried on the modelled network using Newton-Raphson method deployed in the ETAP 7.0 software. This was done to determine
bus voltages, real and reactive power losses in the network. Data used for the study were obtained from BEDC Asaba business district between June and August, 2017.
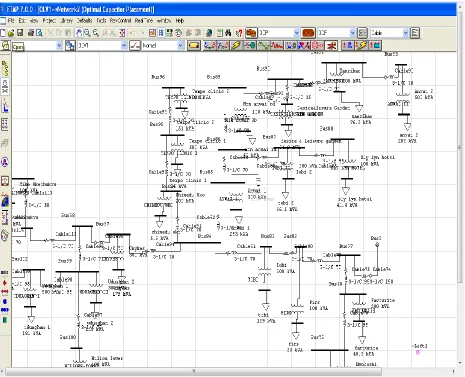
Samples of data collected for the individual substation in the network under review is presented in table 5 of Appendix A. A section of the network modelled in the ETAP 7.0 environment is presented in Figure 2.
Figure 2. A Section of the Network Modelled in ETAP 7.0 Environment
Table 1 presents extracts from the load flow analysis carried out on 15MVA 33/11KV BEDC Asaba government core area injection substation and its
TABLE 1. EXTRACTS FROM LOAD FLOW ANALYSIS.
Study ID Asaba transmission
Study Case ID LF
Data Revision Base
Configuration Normal
Loading Cat Design
Generation Cat Design
Diversity Factor Maximum Loading
Buses 232
Branches 231
Generators 0
Power Grids 1
Loads 96
Load-MW 10.675
Load-MVAr 5.455
Generation-MW 0
Generation-MVAr 0
Loss-MW 0.389
Loss-Mvar 0.818
Bus(es) with Voltage
Violation 64
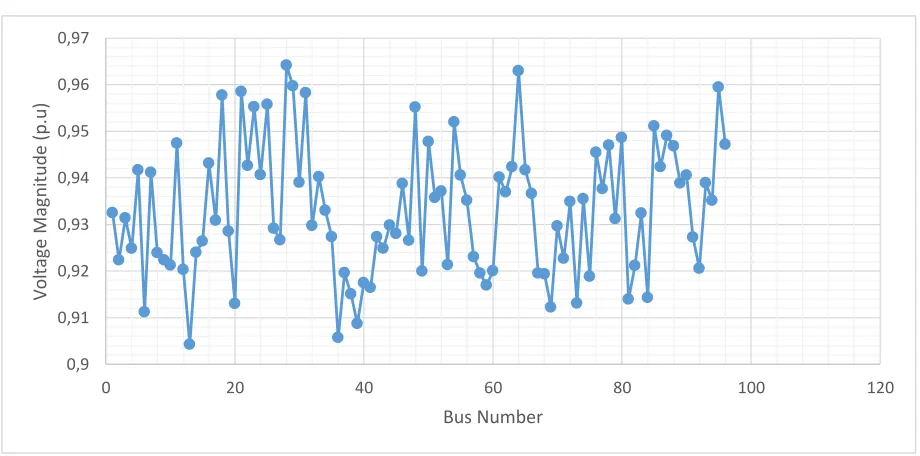
Figure 3. Variation of Voltage Profile for the 96 Bus Distribution System
0,9 0,91 0,92 0,93 0,94 0,95 0,96 0,97
0 20 40 60 80 100 120
V
o
lt
ag
e
M
ag
n
it
u
d
e
(p
.u
)
IV. DEDUCTIONS FROM THE LOAD FLOW ANALYSIS
The result obtained from load flow analysis of the Asaba 15MVA 33/11kV injection substation and its associated feeders indicate the following:
(a) The load flow analysis carried on the network shows that out of a total of ninety six (96) load buses in the network, voltage violation occurs in sixty four (64) buses. (Buses with a voltage magnitude less than 0.94 p.u.)
(b) Total average active and reactive power loss of the system during peak period is 389KW, 818KVAr.
V. POWER LOSS ESTIMATION /COSTING IN ASABA
GOVERNMENT CORE AREA INJECTION SUBSTATION
The multi-year tariff order (MYTO) approved by the Nigerian Electricity Regulation Council (NERC) stipulates that the cost of a KWh of electrical energy for residential customers would be N31.27 for the year 2017. Using this as a base, the cost of 389kW technical power loss in the network under review for a day, a year, five years and for ten was determined, and they are presented in table 2.
TABLE 2. COST ESTIMATE OF THE ENERGY LOST (TECHNICAL LOSS)IN THE NETWORK
Total Power Loss on the Network (KW)
Total Energy Loss in the Network per Day(KWh)
Cost of
Energy lost
Per Day
(Naira)
Cost of Energy Lost Per Year (Naira)
Cost of
Energy Lost in
5 Years
(Naira)
Cost of Energy Lost in 10 Years (Naira)
389 9,336 291,936.72 106,556,902.8 532,784,514 1,065,569,028 Table 2 shows that over two hundred and ninety
thousand Naira is lost in the network per day, and this would translate to a total of over one billion naira in ten years if the issue is not addressed.
VI. DETERMINING CAPACITOR SIZES
Shunt capacitor banks are able to compensate for Var requirement, but bank size, location, cost considerations are important issues that need to be optimized during the design phase. An ideal solution would be a tool able to weigh these factors and consider load levels. The solution should be able to place capacitors for voltage support and power factor correction, while minimizing cost of operation. The problem of locating capacitors can be solved using a variety of techniques; however, the issue for determination here is the capacitor bank sizing.
The Optimal Capacitor Placement (OCP) module of the ETAP 7.0.0 software provides such an application
VII. PROBLEM FORMULATION
Mathematically, the objective function of the problem is described as:
min f = min PLoss; subject to:
Vmin ≤ |Vi| ≤ Vmax (2)
For this study, the voltage constraint is given by :Vmin
= 0.94 pu and Vmax = 1.06pu.
The capacitor banks are to be placed in the candidate buses already selected. The criterion for selection is simply buses with high reactive power loss. Other data input needed for the program to run are same with the load flow data input.
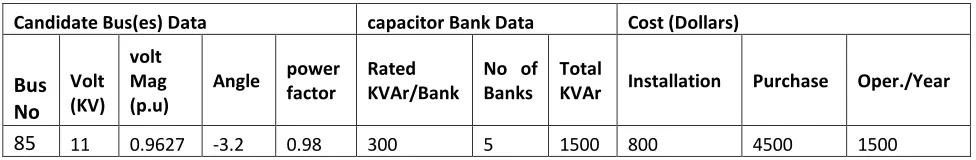
The OCP results are presented in table 3. The OCP module of the ETAP software, also gives the cost variables associated with the capacitors as shown in table 3.
TABLE 3. OCP RESULT
Candidate Bus(es) Data capacitor Bank Data Cost (Dollars)
Bus No Volt (KV) volt Mag (p.u)
Angle power factor
Rated KVAr/Bank
No of Banks
Total
KVAr Installation Purchase Oper./Year
The OCP result (table 3) shows that to minimize power loss in the system and satisfy the voltage constraints as set out in equation (2), we will need to install the following:
(a) A bank comprising of five-number (5nos) 300KVAr capacitors at bus 85 (i.e. at Anwai I substation at the 11KV side)
(b) with the network duly compensated, (capacitor bank in place,) all bus voltages are within acceptable limit, active and reactive power loss has been reduced to 147.82Kw and 237.22 KVAr respectively.
The capacitance and reactance of the banks per phase are calculated below:
Line Voltage = 11 kV Phase Voltage =
√ = 6.35 kV
The rated reactive power of the capacitor bank is 300KVAr. Thus:
Qc = 300KVar
Q per phase = Qcph = 300/3 = 100 KVAr
Xcph =
= 6.35 2
/100 = 403.225 Ω
Xcph = 1/2πfc ; f = 50Hz,
C = 1/2πXcphf= 394.7
Hence, the 300KVAr banks should be of capacitance not less than 394.7 These capacitor banks should be installed at location already stated.
VIII. COST OF INSTALLING CAPACITOR BANKS AT THE
DESIGNATED BUS
From table 3, the following information where extracted:
Cost of procuring the capacitor required for compensation of the network = $4500.00 Cost of Installation = $800.00
Operating Cost in 10 year (i.e. $1500.00 per
year) = $15000.00
If we assume it will cost 30% of the total cost of the capacitor banks to transport them to site, and another 20% of the cost of the banks as cost of procurement of other accessories, then the total cost of compensating the network to reduce power losses becomes:
$4500 + $800 + $15000 + $1350 +$900 = $22550.00 If we assume an exchange rate of 360 Naira to a U.S Dollar, the above amount translates to 8118000 Naira. i.e. approximately 8.1 million Naira. Table 4 compare the cost of energy loss in the network before and after compensation.
TABLE4.COST ESTIMATE OF ENERGY LOST IN THE NETWORK BEFORE AND AFTER COMPENSATION
Total Power
Loss on
the Network (KW)
Total Energy Loss in the Network per Day(KWh)
Cost of Energy lost Per Day (Naira)
Cost of
Energy Lost
Per Year
(Naira)
Cost of
Energy Lost in 5 Years (Naira)
Cost of
Energy Lost in 10 Years (Naira)
Before
Compensation 389 9336 291936.72 103345598.9 516727994.4 1033455989
After
Compensation 147.82 3547.68 110935.9536 39271327.57 196356637.9 392713275.7
SAVINGS 241.18 5788.32 181000.7664 64074271.31 320371356.5 640742713.1
IX. CONCLUSION
Within a period of 10 years, a savings of N640,742,713.10 (i.e. over 600 million Naira) would be made. If the cost of installing the capacitor banks and operating cost for a period of ten years is deducted from this amount, a total savings of over six hundred and
Consequent upon the foregoing; it becomes reasonably necessary that the BEDC compensates the distribution network under review as it makes economic sense and doing so will ultimately serve the best interest of both BEDC and her numerous customers in the network.
REFERENCES
[1] S. O. Oyedepo, Energy in Perspective of Sustainable Developement. Journal of Sustainable Energy, 1, 14 - 23. (2013). [2] Nigerian Power Sector Investment Opportunities and Guidelines [NPSIOG]. Published by the Federal Ministry of Power, Mines and Steel Development. (2016).
[3] N. S. AGM, (n.d.). Nigeria Vision 20:2020 program report. [4] L. M. Adesina & O. A. Fakolujo, Power Flow Analysis of Island Business District 33KV Distribution Grid System Real Network Simulations. International Journal of Engineering Research and Application (IJERA), 5(7 (part-1)). ( 2015).
[5] L. M Adesina and A. Ademola, Determination of Power Systems Losses in Nigeria Electricity Distribution Networks. International Journal of Engineering and Technology, 6(9), 322-326. (2016). [6] A. Mehehub, Y.S. Mohammad, and G. Mandela, A Review of Losses in Distribution Sector and Minimization Techniques. International Journal of Advance Research in Electrical Electronics and Instrumentation Engineering, 3(10), 12431-12437. ( 2014).
[7] M.Avik and G. Smarajit, Literature Survey on Different LossMinimization Techniques used in Distribution Networks. International Journal of Scientific Research and Education, 3(6), 3861-3877. (2015)
[8] C. Liu, X. Lv , L. Guo1, L. Cai1, J. Jie and K. Su. “Study on Power Loss Reduction Considering Load Variation with Large Penetration of Distributed Generation in Smart Grid’’. Proceedings from 2017 2nd Asia Conference on Power and Electrical Engineering (ACPEE 2017) Published under licence by IOP Publishing Ltd. (2017)
[9] Y. Ch, S.K. Goswami and D. Chatterjee: “Effect of network reconfiguration on power quality of distribution system”, International Journal of Electrical Power and Energy Systems, Vol.83, pp.87-95 (2016).
[10] H. W. Li, W. J. Mao, A. A. Zhang and C. Li: “An improved distribution network reconfiguration method based on minimun spanning tree algorithm and heuristic rules”, International Journal of Electrical Power and Energy Systems, Vol. 82, No.11, PP466-473 (2016).
[11]T. Taylor and D Lubkeman, Implementation of Heuristic Search Strategies for Disribution Feeder Reconfiguration. 5(1), 239-244. (1990)
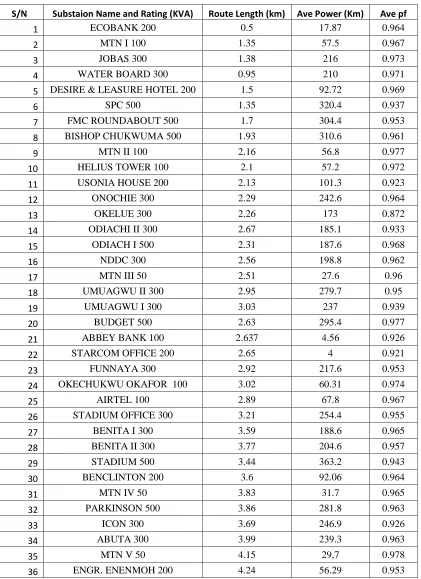
APPENDIX A
TABLE 5. SAMPLE OF SUBSTATION DATA USED FOR LOAD FLOW STUDY
S/N Substaion Name and Rating (KVA) Route Length (km) Ave Power (Km) Ave pf
1 ECOBANK 200 0.5 17.87 0.964
2 MTN I 100 1.35 57.5 0.967
3 JOBAS 300 1.38 216 0.973
4 WATER BOARD 300 0.95 210 0.971
5 DESIRE & LEASURE HOTEL 200 1.5 92.72 0.969
6 SPC 500 1.35 320.4 0.937
7 FMC ROUNDABOUT 500 1.7 304.4 0.953
8 BISHOP CHUKWUMA 500 1.93 310.6 0.961
9 MTN II 100 2.16 56.8 0.977
10 HELIUS TOWER 100 2.1 57.2 0.972
11 USONIA HOUSE 200 2.13 101.3 0.923
12 ONOCHIE 300 2.29 242.6 0.964
13 OKELUE 300 2.26 173 0.872
14 ODIACHI II 300 2.67 185.1 0.933
15 ODIACH I 500 2.31 187.6 0.968
16 NDDC 300 2.56 198.8 0.962
17 MTN III 50 2.51 27.6 0.96
18 UMUAGWU II 300 2.95 279.7 0.95
19 UMUAGWU I 300 3.03 237 0.939
20 BUDGET 500 2.63 295.4 0.977
21 ABBEY BANK 100 2.637 4.56 0.926
22 STARCOM OFFICE 200 2.65 4 0.921
23 FUNNAYA 300 2.92 217.6 0.953
24 OKECHUKWU OKAFOR 100 3.02 60.31 0.974
25 AIRTEL 100 2.89 67.8 0.967
26 STADIUM OFFICE 300 3.21 254.4 0.955
27 BENITA I 300 3.59 188.6 0.965
28 BENITA II 300 3.77 204.6 0.957
29 STADIUM 500 3.44 363.2 0.943
30 BENCLINTON 200 3.6 92.06 0.964
31 MTN IV 50 3.83 31.7 0.965
32 PARKINSON 500 3.86 281.8 0.963
33 ICON 300 3.69 246.9 0.926
34 ABUTA 300 3.99 239.3 0.963
35 MTN V 50 4.15 29,7 0.978
![Figure 1. Energy Consumption per Capital for Selected African Countries [2].](https://thumb-us.123doks.com/thumbv2/123dok_us/7806071.2085096/2.612.72.514.72.294/figure-energy-consumption-capital-selected-african-countries.webp)