The buck stops here:
Vanguard money market funds
Best practices for
portfolio rebalancing
Yan Zilbering; Colleen M. Jaconetti, CPA, CFP®; Francis M. Kinniry Jr., CFA
Vanguard Research November 2015
■
The primary goal of a rebalancing strategy is to minimize risk relative to a target asset
allocation, rather than to maximize returns. Over time, asset classes produce different
returns that can change the portfolio’s asset allocation. To recapture the portfolio’s
original risk-and-return characteristics, the portfolio should therefore be rebalanced.
■
In theory, investors select a rebalancing strategy that weighs their willingness to assume
risk against expected returns net of the cost of rebalancing. Vanguard research has found
that there is no optimal frequency or threshold for rebalancing, since risk-adjusted returns
do not differ meaningfully from one rebalancing strategy to another.
■
As a result, we conclude that for most broadly diversified stock and bond fund portfolios
(assuming reasonable expectations regarding return patterns, average returns, and risk),
annual or semiannual monitoring, with rebalancing at 5% thresholds, is likely to produce a
reasonable balance between risk control and cost minimization for most investors. Annual
rebalancing is likely to be preferred when taxes or substantial time/costs are involved.
Notes on asset-return distributions and risk
The asset-return distributions shown here represent Vanguard’s view on the potential range of risk premiums that may occur over the next ten years; such long-term projections are not intended to be extrapolated into a short-term view. These potential outcomes for long-term investment returns are generated by the Vanguard Capital Markets Model® (VCMM—see the description in Appendix I) and reflect the collective perspective of our Investment Strategy Group. The expected risk premiums—and the uncertainty surrounding those expectations—are among a number of qualitative and quantitative inputs used in Vanguard’s investment methodology and portfolio-construction process.
All investing is subject to risk, including the possible loss of the money you invest. Diversification does not ensure a profit or protect against a loss in a declining market. There is no guarantee that any particular asset allocation or mix of funds will meet your investment objectives or provide you with a given level of income.
Return data for Figures 2, 3, 5, 6, and 8 of this paper are based on the following stock and bond benchmarks, as applicable: Stocks are represented by the Standard & Poor’s 90 from 1926 through March 3, 1957; the S&P 500 Index from March 4, 1957, through 1969; the MSCI World Index from 1970 through 1987; the MSCI All Country (AC) World Index from 1988 through May 31, 1994; and the MSCI AC World IMI Index from June 1, 1994, through 2014. Bonds are represented by the S&P High Grade Corporate Index from 1926 through 1968; the Citigroup High Grade Index from 1969 through 1972; the Lehman Long-Term AA Corporate Index from 1973 through 1975; the Barclays U.S. Aggregate Bond Index from 1976 through 1989; and the Barclays Global Aggregate Bond Index (USD hedged) from 1990 through 2014. Except as noted, the portfolios are weighted 50% stocks/50% bonds.
1 See Brinson, Hood, and Beebower (1986); Brinson, Singer, and Beebower (1991); Ibbotson and Kaplan (2000); Davis, Kinniry, and Sheay (2007), and Wallick et al. (2012). 2 The bid-ask spread is the difference between the highest price a buyer is willing to pay for an asset and the lowest price a seller is willing to accept for it.
Vanguard believes that the asset allocation decision— which takes into account each investor’s risk tolerance, time horizon, and financial goals—is the most important decision in the portfolio-construction process. This is because asset allocation is the major determinant of risk and return for a given portfolio.1 Over time, however, as a portfolio’s investments produce different returns, the portfolio will likely drift from its target asset allocation, acquiring risk-and-return characteristics that may be inconsistent with an investor’s goals and preferences. By periodically rebalancing, investors can diminish the tendency for “portfolio drift,” and thus potentially reduce their exposure to risk relative to their target asset allocation.
As part of the portfolio-construction process, it’s important for investors to develop a rebalancing strategy that formally addresses “how often, how far, and how much”: that is, how frequently the portfolio should be monitored; how far an asset allocation can be allowed to deviate from its target before it is rebalanced; and whether periodic rebalancing should restore a portfolio to its target or to a close approximation of the target. Although each of these decisions has an impact on a portfolio’s risk-and-return characteristics, the differences in risk-adjusted returns among the strategies are not very significant. Thus, the how often, how far, and how much are mostly questions of investor preference. The only clear advantage for any of these strategies, so far as maintaining a portfolio’s risk-and-return characteristics, and without factoring in rebalancing costs, is that a rebalanced portfolio more closely aligns with the characteristics of the target asset allocation than a portfolio that is never rebalanced.
Costs of rebalancing
Throughout this paper, the term costs of rebalancing refers to:
• Taxes (if applicable): If rebalancing within taxable registrations, capital gains taxes may be due upon the sale if the asset sold has appreciated in value.
• Transaction costs to execute and process the trades: For individual securities and exchange-traded funds (ETFs), the costs are likely to include brokerage commissions and bid-ask spreads.2 For mutual funds, costs may include purchase or redemption fees.
• Time and labor costs to compute the rebalancing amount: These costs are incurred either by the investor directly or by a professional investment manager. The costs may include administrative costs and management fees, if a professional manager is hired.
Keep in mind that in addition to these costs, there may be trading restrictions that could limit the frequency of transacting on the accounts. Finally, since there is little difference in the results between the frequencies analyzed, these costs should be considered when selecting a rebalancing strategy.
For many investors, rebalancing can be difficult
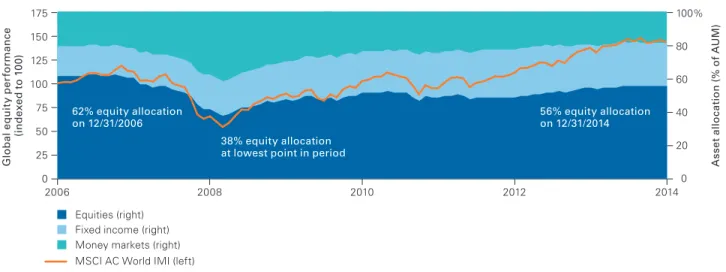
Rebalancing can be an emotional decision for many investors. After a prolonged period of the equity bull market, with global equities up nearly 200% since March 9, 2009 (according to Morningstar, Inc., as of December 31, 2014), rebalancing may seem counterintuitive: It involves selling the outperforming assets (stocks) and reallocating to the lagging ones (bonds). This may seem especially trying to some investors, given the current low interest rates on bonds and their low expected returns in the near future. The situation is typical in periods of prolonged one-directional markets, and was also the case when Vanguard first published the original research for this paper in 2010, shortly after the global equity markets lost nearly –60%. In fact, when looking at total assets under management in the mutual fund industry globally from 2006 through 2014, there is some evidence that investors may not readily embrace rebalancing. Figure 1 shows that the number of assets under management during those years for equity, fixed income, and money market funds tended to drift based on market performance (for example, the equity allocation declined from 62%
to 38% and then increased again to 56%, in line with the equity market’s performance during the period). This suggests that investors in aggregate may not rebalance, since rebalancing would have shown a relatively more stable asset mix for the entire period.
Benefit of rebalancing
Many investors spend substantial time defining their investment goals and selecting an asset allocation to help them achieve those goals, while also being mindful of their tolerance for risk. To be successful, however, they must be able to stick with their plan in all kinds of markets. Due to the equity risk premium, over long time horizons, the equity portion of the portfolio will likely grow faster than the bond portion, exposing a larger portion of the portfolio to potential equity market corrections. These corrections can lead investors to abandon their investment plan, possibly jeopardizing their chances of meeting their financial goals. By rebalancing the portfolio and bringing the risk level back to an acceptable level, investors are more likely to stick to their plan, endure
Figure 1. Global assets under management in open-end mutual funds and ETFs: 2006 through 2014
G lo b al e q u it y p er fo rm an ce (i n d ex ed t o 1 00 ) 0 50 25 125 100 150 75 175
2006 2008 2010 2012 2014
0 20 40 60 80 100% A ss et a llo ca ti o n ( % o f AU M ) Equities (right) Fixed income (right) Money markets (right) MSCI AC World IMI (left) 62% equity allocation
on 12/31/2006 56% equity allocationon 12/31/2014
38% equity allocation at lowest point in period
Notes: Global equity performance represented by MSCI AC World IMI, year-end 2006 through year-end 2014. AUM = assets under management.
Sources: Vanguard, based on data from Morningstar, Inc.
3 This assumes a portfolio of equity and fixed income investments; allocations to alternative asset classes or investments were not considered. Readers are referred to Vanguard research titled The Allure of the Outlier: A Framework for Considering Alternative Investments (Wallick et al., 2015), for further details on the implications of rebalancing when using alternatives. market downturns, and be in a better position to meet
their long-term financial goals within their investment time horizon.
Given the equity risk premium, it’s important to keep in mind that the primary benefit of portfolio rebalancing is to maintain the risk profile of an investment portfolio over time, rather than maximize returns. In fact, if a given investor’s portfolio can potentially hold either stocks or bonds, and the sole objective is to maximize return regardless of risk, then that investor should select a 100% equity portfolio.3 Equities have historically outperformed bonds over long time horizons; the trade-off is increased volatility. Figure 2 shows the historical return distributions for various balanced portfolios, moving from 100% bonds on the left-hand side of the figure to an all-stock portfolio on the right, in 10% increments. As expected, Figure 2 bears out that portfolios with larger allocations to equities have a much wider variability of annual returns (both positive and negative) as well as higher average annualized returns to compensate for the additional risk. Because
investors select an asset allocation based on the level of risk they are willing to bear, those who choose to include bonds must also accept the fact that they will likely receive a lower return on their portfolio over the long term, compared with an all-equity portfolio. Similar to the selection of a portfolio’s target asset allocation, a rebalancing strategy involves a trade-off between risk and return. As we discussed, the more risk an investor is willing to assume, the higher the expected return over the long term (the equity risk premium). If a portfolio is never rebalanced, it tends to gradually drift from its target asset allocation as the weight of higher-return, higher-risk assets increases. Compared with the target allocation, the portfolio’s expected return increases, as does its vulnerability to deviations from the return of the target asset allocation.
To illustrate this, we compared two hypothetical portfolios, each with a target asset allocation of 50% global stocks/50% global bonds for the period 1926
Figure 2. Distribution of calendar-year returns: 1926 through 2014
Sources: Vanguard calculations, based on data from FactSet.
Past performance is no guarantee of future returns. –60 –40 –20 0 40 20 60% 100%
bonds stocks/10% 90% bonds 32.6%
–8.1% –8.2% –10.2%
–14.3% –18.5%
–22.7% –26.8%
–31.0% –35.2%
–39.3% –43.5%
30.5% 28.4% 28.0% 30.0% 32.4% 36.8% 41.2%
45.6% 50.0% 54.4%
20% stocks/ 80% bonds 30% stocks/ 70% bonds 40% stocks/ 60% bonds 50% stocks/ 50% bonds 60% stocks/ 40% bonds 70% stocks/ 30% bonds 80% stocks/ 20% bonds 90% stocks/ 10% bonds 100% stocks
Range of calendar-year returns Annualized return for period
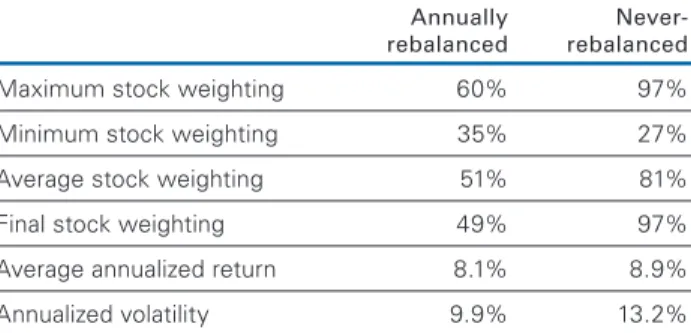
4 For further details, readers are also referred to Vanguard research titled Vanguard Global Capital Markets Model (Davis et al., 2014). through 2014; the first portfolio was rebalanced annually,
and the second portfolio was never rebalanced (see Figure 3). As the figure shows, and consistent with the risk-premium theory, the never-rebalanced portfolio’s stock allocation gradually drifted upward, to a maximum of 97%, and was 81% on average for the period. As the never-rebalanced portfolio’s equity exposure increased, the portfolio displayed higher risk (a standard deviation of 13.2%, versus 9.9% for the rebalanced portfolio) and a higher average annualized return (8.9% versus 8.1%, respectively).
Given that the equity risk premium is expected to continue in the future, we also performed the analysis on a forward- looking basis, using the Vanguard Capital Markets Model (VCMM) to simulate 10,000 potential scenarios for global balanced portfolios (see Figure 4).4 As expected, in most of our simulations (more than 70%), a nonrebalanced 50% stocks/50% bonds portfolio resulted in 30-year returns that were greater than those of an annually rebalanced 50%/50% portfolio. The median return of the drift portfolio was 7.6%, compared to the median rebalanced portfolio return of 7.1%. However, nearly 70% of the higher return simulations came with additional volatility. For comparison, the median volatility of the drift portfolios was 11.9%, compared to the median rebalanced portfolio volatility of 9.2%. The higher returns and volatility were driven by the growing equity allocations through time.
Figure 4 shows the distribution of the average equity allocation for our 10,000 simulations, as well as their ending portfolio weights. Although the average and ending equity allocations varied greatly, the majority of each was above 50%. In fact, in more than 90% of our scenarios, both the average and ending equity allocations were above the starting 50% target, and in 25% of cases they ended above the 90% allocation.
When faced with the decision to rebalance, investors may not realize that by not rebalancing they could be exposing their portfolio to a much higher level of risk than they had intended or were willing to assume in their target portfolio. This is particularly important, because not only does the equity exposure increase relative to investors’ targets, but as they approach their investment goal, or time horizon, their risk tolerance may be decreasing, magnifying their relative risk exposure even further. Figure 3. Comparing a hypothetical 50% global stocks/
50% global bonds annually rebalanced portfolio versus a 50%/50% never-rebalanced portfolio:
1926 through 2014
Annually Never-
rebalanced rebalanced
Maximum stock weighting 60% 97% Minimum stock weighting 35% 27% Average stock weighting 51% 81% Final stock weighting 49% 97% Average annualized return 8.1% 8.9% Annualized volatility 9.9% 13.2% Notes: This illustration is hypothetical and does not represent the returns of any particular investment. We assumed a portfolio of 50% global stocks/50% global bonds. All returns in nominal U.S. dollars. For benchmark data, see box on page 2. There were no new contributions or withdrawals. Dividend payments were reinvested in equities; interest payments were reinvested in bonds. There were no costs. All statistics were annualized.
Sources: Vanguard calculations, based on data from FactSet. Stock weightings rounded to nearest whole number.
5 Although the analysis throughout this paper examines a 50% global stock/50% global bond portfolio, we also analyzed more conservative (30%/70%) and more aggressive (70%/30%) portfolios, which produced similar patterns of results for the various combinations of time and threshold.
Selecting a rebalancing strategy
A rebalancing strategy measures risk and return relative to the performance of a target asset allocation (Leland, 1999; Pliska and Suzuki, 2004). The decisions that can ultimately determine whether a portfolio’s actual performance is in line with the portfolio’s target asset allocation include how frequently the portfolio is monitored; the degree of deviation from the target asset allocation that triggers a rebalancing event; and whether a portfolio is rebalanced to its target or to a close approximation of the target. First we address ways an investor can determine when to trigger a rebalancing event. Although various triggers can be used, we focus primarily on three: “time-only,” “threshold-only,” and “time-and-threshold.” The decision as to which rebalancing strategy to implement largely
depends on the investor’s risk tolerance, the correlation of the portfolio’s assets, and the costs involved in rebalancing. We analyzed the historical results of each of these strategies for the period 1926 through 2014. In each case, we assumed a portfolio consisting of 50% global stocks/50% global bonds that was rebalanced according to the strategy under consideration.5 Strategy #1: ‘Time-only’
When using the “time-only” strategy, the portfolio is rebalanced at a predetermined time interval—daily, monthly, quarterly, annually, and so on. As the strategy’s name implies, the only variable taken into consideration is time, regardless of how much or how little the portfolio’s asset allocation has drifted from its target.
Figure 4. Distribution of average and ending equity allocations for a nonrebalanced 50%/50% portfolio over 30 years (Vanguard projections)
Important note: The projections or other information generated by the VCMM regarding the likelihood of various investment outcomes are hypothetical in nature, do not reflect actual investment results, and are not guarantees of future results. Distribution of return outcomes from the VCMM is derived from 10,000 simulations for each modeled asset class. Simulations as of December 31, 2014. Results from the model may vary with each use and over time. For more information, see Appendix I.
Source: Vanguard Capital Markets Model.
P
er
ce
n
ta
ge
o
f o
cc
u
rr
en
ce
s
Equity allocation (% of total portfolio) 0
10 20 30 40%
Equity allocation greater than 50% target portfolio in more than 90% of stimulations
Average equity allocation Ending equity allocation
90% to 100% 0%
to 10%
10% to 20%
20% to 30%
30% to 40%
40% to 50%
50% to 60%
60% to 70%
70% to 80%
80% to 90%
6 Although daily rebalancing is certainly an option, we excluded this option from our analysis in Figure 5 because of the limited availability of daily return data. The data in Figure 5 compare hypothetical results for the
time-only rebalancing strategy using several different frequencies: monthly, quarterly, annually, and never.6 The figure assumes that each portfolio is rebalanced at the predetermined interval, regardless of the magnitude of deviation from the target asset allocation. As the figure shows, changing the rebalancing frequency from monthly to quarterly to annually did not meaningfully change the portfolio average equity allocations, average annualized returns, or volatilities. However, a significant difference does exist between the results of portfolios that were rebalanced and the rebalanced portfolio. The never-rebalanced portfolio drifted to an average equity allocation of about 81%, which significantly increased the volatility to 13.2%, compared to that of about 10% for the monthly, quarterly, and annually rebalanced portfolios. Deciding which frequency to choose comes down to costs. The number of rebalancing events was significantly higher with more frequent rebalancing—1,068 for a monthly rebalanced portfolio, versus 88 for one rebalanced annually; the former would obviously result in higher trading costs.
Strategy #2: ‘Threshold-only’
We next compare the “threshold-only” strategy, which ignores the time aspect of rebalancing. Investors following this strategy rebalance the portfolio only when the portfolio’s asset allocation has drifted from the target asset allocation by a predetermined minimum rebalancing threshold such as 1%, 5%, or 10%, regardless of the frequency. The rebalancing events could be as frequent as daily or as infrequent as every five years, depending on the portfolio’s performance relative to its target asset allocation.
To analyze the impact of threshold-only rebalancing strategies, we conducted a historical analysis for rebalancing thresholds of 1%, 5%, and 10%, assuming daily monitoring, which is required with this strategy to determine each rebalancing event. If the hypothetical portfolio’s allocation drifted beyond the threshold on any given day, it would be rebalanced back to the target allocation. Due to the limited availability of daily data (and therefore lack of comparability to the other figures in the body of this paper), the details of the analysis are included in Appendix II (see Figure A-1).
Again with this strategy, the magnitude of the differences in the average equity allocation, average annual return, and annualized volatility may not warrant the additional costs associated with a 0% threshold (8,826 rebalancing events) versus a 10% threshold (6 rebalancing events). The primary drawback to the threshold-only strategy is that it requires daily monitoring, which investors can either perform themselves or pay an advisor to do for them (ultimately lowering the portfolio’s total return because of the additional cost). The preferred strategy depends primarily on investor preference.
Strategy #3: ‘Time-and-threshold’
The final strategy analyzed, “time-and-threshold,” calls for rebalancing the portfolio on a scheduled basis (e.g., monthly, quarterly, or annually), but only if the portfolio’s asset allocation has drifted from its target asset allocation by a predetermined minimum rebalancing threshold such as 1%, 5%, or 10%. If, as of the scheduled rebalancing date, the portfolio’s deviation from the target asset allocation is less than the predetermined threshold, the portfolio will not be rebalanced. Likewise, if the portfolio’s Figure 5. Comparing hypothetical portfolio
rebalancing results for ‘time-only’ strategy: Various frequencies, 1926 through 2014
Monitoring
frequency Monthly Quarterly Annually Never
Threshold 0% 0% 0% NA
Average equity allocation 50.1% 50.2% 50.6% 80.6%
Costs of rebalancing
Annual turnover 2.6% 2.2% 1.7% 0.0% Number of
rebalancing events 1,068 355 88 0
Absolute framework
Average annualized return 8.0% 8.2% 8.1% 8.9% Annualized volatility 10.1% 10.1% 9.9% 13.2% Notes: This illustration is hypothetical and does not represent the returns of any particular investment. We assumed a portfolio of 50% global stocks/50% global bonds. All returns in nominal U.S. dollars. For benchmark data, see box on page 2. There were no new contributions or withdrawals. Dividend payments were reinvested in equities; interest payments were reinvested in bonds. There were no costs. All statistics were annualized.
asset allocation drifts by the minimum threshold or more at any intermediate time interval, the portfolio will not be rebalanced at that time.
To analyze the impact of time-and-threshold rebalancing strategies, we conducted a historical analysis over the period 1926 through 2014 on the performance of several hypothetical portfolios. As Figure 6 demonstrates, there were no meaningful differences in the average equity allocations, returns, or volatilities among the various combinations of both time and threshold for the rebalanced portfolios, similar to our findings for the other rebalancing strategies. Average equity allocations for all rebalanced strategies were in a tight range of 50.1% to 52.4%, with returns and volatility differences that were relatively insignificant. Once again, costs played a larger part than other factors in the time-and-threshold decision. A rebalancing strategy that included monthly monitoring and a 1% threshold was more costly to implement (423 rebalancing events) than one that included annual monitoring and 10% rebalancing thresholds (19 rebalancing events). (Again, we note that the never-rebalanced portfolio
drifted to an average equity allocation of nearly 81%, significantly increasing its volatility to 13.2%, compared with a volatility of about 10% for the rebalanced portfolios.) Although this simulation implies that portfolios that are rebalanced more frequently track the target asset allocation more closely, it also suggests that the cost of rebalancing may place upper limits on the optimal number of rebalancing events. Transaction costs and taxes (when applicable) detract from the portfolio’s return, potentially undermining the risk-control benefits of some rebalancing strategies. In our simulation, the number of rebalancing events and the annual turnover were proxies for costs, with actual costs depending on a portfolio’s unique transaction costs and taxes.
After taking into consideration reasonable expectations for return patterns, average returns, and risk, we concluded that for most broadly diversified stock and bond portfolios, annual or semiannual monitoring, with rebalancing at 5% thresholds, produced a reasonable balance between risk control and cost minimization.
Figure 6. Comparing portfolio rebalancing results for ‘time-and-threshold’ strategy: Various frequencies and thresholds, 1926 through 2014
Monitoring
frequency Monthly Quarterly Annually Never
Threshold 0% 1% 5% 10% 1% 5% 10% 1% 5% 10% NA
Average equity
allocation 50.1% 50.1% 51.2% 52.2% 50.2% 50.9% 51.0% 50.6% 51.2% 52.4% 80.6%
Costs of rebalancing
Annual turnover 2.6% 2.3% 1.6% 1.3% 2.1% 1.5% 1.2% 1.7% 1.6% 1.5% 0.0% Number of
rebalancing events 1,068 423 64 24 227 50 22 79 36 19 0
Absolute framework
Average annualized
return 8.0% 8.0% 8.1% 8.3% 8.2% 8.3% 8.3% 8.1% 8.2% 8.3% 8.9% Annualized volatility 10.1% 10.1% 10.1% 10.2% 10.1% 10.2% 10.1% 9.9% 9.8% 10.0% 13.2% Notes: This illustration is hypothetical and does not represent the returns of any particular investment. We assumed a portfolio of 50% global stocks/50% global bonds. All returns in nominal U.S. dollars. For benchmark data, see box on page 2. There were no new contributions or withdrawals. Dividend payments were reinvested in equities; interest payments were reinvested in bonds. There were no costs. All statistics were annualized.
7 A concentrated or aggressive, actively managed portfolio of stocks and bonds may also behave differently from our illustrated examples. Such portfolios tend to be more volatile than broadly diversified stock and bond portfolios, requiring more frequent rebalancing to maintain similar risk control relative to the target asset allocation.
8 The sweep process just described can improve the after-tax return of the portfolio at the margin; however, investors should weigh the time and effort required against the potential increased returns.
There are two important qualifications to this conclusion. First, this analysis assumed that some approximation of the stock and bond markets’ historical return patterns, average returns, volatility, and low-return correlation can be expected to persist in the future. Second, we assumed that a portfolio holds a broadly diversified group of liquid assets with readily available market prices.7
Implementing a rebalancing strategy
In translating this conceptual rebalancing framework (summarized in Figure 7) into practical strategies, it’s important to recognize two real-world limitations to the framework’s assumptions. First, conventional wisdom among financial practitioners suggests that investor preferences may be less precise than theory assumes. Investors’ target asset allocations are typically flexible within 5% to 10% ranges, indicating that they are mostly indifferent to small risk-or-return deviations. Second, some costs of rebalancing—time, labor, and market impact—are difficult to quantify. Such costs are often included indirectly in advisory fees or reflected as trading restrictions, making it difficult to explicitly consider
rebalancing costs. Several practical strategies discussed next aim to capture the risk-control benefits illustrated by our theoretical framework while minimizing the costs of rebalancing.
Rebalance with portfolio cash flows. Rebalancing a portfolio with dividends, interest payments, realized capital gains, or new contributions can help investors both exercise risk control and trim the costs of rebalancing. Typically, investors can accomplish this by sweeping their taxable portfolio cash flows into a money market or checking account and then redirecting these flows to the most underweighted asset class as part of their scheduled rebalancing event.8
Figure 8 illustrates how dividend and interest payments can be used to reduce potential rebalancing costs for several hypothetical portfolios. The “Redirecting income” column shows a 50% stock/50% bond portfolio that was rebalanced by investing the portfolio’s dividend and interest payments in the underweighted asset class from 1926 through 2014. An investor who had simply redirected his or her portfolio’s income would have
Figure 7. Summary of various rebalancing strategies
Rebalancing strategy Trigger Key considerations
1. Time-only Based on set time schedule, such as daily, monthly, quarterly, annually, etc.
Only variable taken into consideration is time.
Disregards how much, or how little, the portfolio’s asset allocation has drifted from its target.
2. Threshold-only Target asset allocation deviates by a predetermined minimum percentage, such as 1%, 5%, 10%, etc.
Only variable taken into consideration is asset allocation. Disregards the frequency of rebalancing events. Requires daily monitoring to determine if rebalancing is needed.
3. Time-and-threshold Based on set time schedule, but only rebalances if the target asset allocation deviates by a predetermined amount, such as 1%, 5%, 10%, etc.
Both frequency and drift from target allocation are considered. If portfolio drifts by the minimum threshold or more at any intermediate time frequency, the portfolio will not be rebalanced at that time.
achieved most of the risk-control benefits of more labor- and transaction-intensive rebalancing strategies at a much lower cost.
For example, a portfolio that was monitored monthly and rebalanced at 5% thresholds had 64 rebalancing events and annual portfolio turnover of 1.6% (see Figure 8). The portfolio that was rebalanced by simply redirecting income had no rebalancing events and portfolio turnover of 0%. For taxable investors, using income to rebalance means no securities (or funds) need to be sold, and therefore no capital-gains or income taxes are paid, resulting in a strategy that is very tax-efficient. The differences in risk among the various rebalancing strategies were very modest.
One caution: The high levels of dividends and interest rates during this 89-year period may not be available in the future. An effective approach independent of the level of dividends and bond yields is to use portfolio contributions and withdrawals to rebalance the portfolio.
However, the potential tax consequences of these transactions may require more customized rebalancing strategies.
Rebalance to target asset allocation or some intermediate asset allocation. Finally, the decision to rebalance either to the target asset allocation or to some intermediate allocation (an allocation short of the target allocation) depends primarily on the type of rebalancing costs. When trading costs are mainly fixed and independent of the size of the trade—the cost of time, for example—rebalancing to the target allocation is optimal because it reduces the need for further transactions. On the other hand, when trading costs are mainly proportional to the size of the trade—as in commissions or taxes, for example—rebalancing to the closest rebalancing boundary is preferred, minimizing the size of the transaction. If both types of costs exist, the preferred strategy is to rebalance to some intermediate point.
Figure 8. Impact of rebalancing with portfolio cash flows: 1926 through 2014
Redirecting
Monitoring frequency Monthly Monthly Quarterly Annually Never income
Threshold 0% 5% 5% 5% NA NA
Average equity allocation 50.1% 51.2% 50.9% 51.2% 80.6% 53.3%
Costs of rebalancing
Annual turnover 2.6% 1.6% 1.5% 1.6% 0.0% 0.0%
Number of rebalancing events 1,068 64 50 36 0 0
Absolute framework
Average annualized return 8.0% 8.1% 8.3% 8.2% 8.9% 8.1%
Annualized volatility 10.1% 10.1% 10.2% 9.8% 13.2% 9.7%
Notes: This illustration is hypothetical and does not represent the returns of any particular investment. We assumed a portfolio of 50% global stocks/50% global bonds. All returns are in nominal U.S. dollars. For benchmark data, see box on page 2. There were no new contributions or withdrawals. Except in the “Redirecting income” column, dividend payments were reinvested in equities; interest payments were reinvested in bonds. The “Redirecting income” column shows a 50% stock/50% bond portfolio that was rebalanced by investing the portfolio’s dividend and interest payments in the underweighted asset class from 1926 through 2014. There were no costs. All statistics were annualized.
Conclusion
Just as there is no universally optimal asset allocation, there is no universally optimal rebalancing strategy. The only clear advantage so far as maintaining a portfolio’s risk-and-return characteristics is that a rebalanced portfolio more closely aligns with the characteristics of the target asset allocation than with a never-rebalanced portfolio. As our analysis has shown, the risk-adjusted returns are not meaningfully different whether a portfolio is rebalanced monthly, quarterly, or annually; however, the number of rebalancing events and resulting costs increase significantly. As a result, we conclude that a rebalancing strategy based on reasonable monitoring frequencies (such as annual or semiannual) and reasonable allocation thresholds (variations of 5% or so) is likely to provide sufficient risk control relative to the target asset allocation for most portfolios with broadly diversified stock and bond holdings, without creating too many rebalancing events over the long term.
References
Brinson, Gary P., L. Randolph Hood, and Gilbert L. Beebower, 1986. Determinants of Portfolio Performance. Financial Analysts Journal 42(4): 39–48.
Brinson, Gary P., Brian D. Singer, and Gilbert L. Beebower, 1991. Determinants of Portfolio Performance II: An Update. Financial Analysts Journal 47(3): 40–48.
Davis, Joseph H., Francis M. Kinniry Jr., and Glenn Sheay, 2007. The Asset Allocation Debate: Provocative Questions, Enduring Realities. Valley Forge, Pa.: The Vanguard Group.
Davis, Joseph, Roger Aliaga-Díaz, Harshdeep Ahluwalia, Frank Polanco, and Christos Tasopoulos, 2014. Vanguard Global Capital Markets Model. Valley Forge, Pa.: The Vanguard Group.
Ibbotson, Roger G., and Paul D. Kaplan, 2000. Does Asset Allocation Policy Explain 40, 90, or 100 Percent of Performance? Financial Analysts Journal 56(1): 26–33.
Leland, Hayne E., 1999. Optimal Portfolio Management With Transactions Costs and Capital Gains Taxes. Research Program in Finance Working Paper No. 290. Berkeley, Calif.: Institute of Business and Economic Research, University of California. Pliska, Stanley R., and Kiyoshi Suzuki, 2004. Optimal Tracking for Asset Allocation With Fixed and Proportional Transaction Costs. Quantitative Finance 4(2): 233–43.
Vanguard Group, The, 2003. Sources of Portfolio Performance: The Enduring Importance of Asset Allocation. Valley Forge, Pa.: The Vanguard Group.
Wallick, Daniel W., Julieann Shanahan, Christos Tasopoulos, and Joanne Yoon, 2012. The Global Case for Strategic Asset Allocation. Valley Forge, Pa.: The Vanguard Group.
Wallick, Daniel W., Douglas M. Grim, Christos Tasopoulos, and James Balsamo, 2015. The Allure of the Outlier: A Framework for Considering Alternative Investments. Valley Forge, Pa.: The Vanguard Group.
Appendix I. About the Vanguard Capital Markets Model
IMPORTANT: The projections or other information generated by the Vanguard Capital Markets Model regarding the likelihood of various investment outcomes are hypothetical in nature, do not reflect actual investment results, and are not guarantees of future results. VCMM results will vary with each use and over time.
The VCMM projections are based on a statistical analysis of historical data. Future returns may behave differently from the historical patterns captured in the VCMM. More important, the VCMM may be underestimating extreme negative scenarios unobserved in the historical period on which the model estimation is based.
The Vanguard Capital Markets Model is a proprietary financial simulation tool developed and maintained by Vanguard’s Investment Strategy Group. The model forecasts distributions of future returns for a wide array of broad asset classes. Those asset classes include U.S. and international equity markets, several maturities of the U.S. Treasury and corporate fixed income markets, international fixed income markets, U.S. money markets, commodities, and certain alternative investment strategies. The theoretical and empirical foundation for the Vanguard Capital Markets Model is that the returns of various asset classes reflect the compensation investors require for bearing different types of systematic risk (beta). At the core of the model are estimates of the dynamic statistical relationship between risk factors and asset returns, obtained from statistical analysis based on available monthly financial and economic data from as early as 1960. Using a system of estimated equations, the model then applies a Monte Carlo simulation method to project the estimated interrelationships among risk factors and asset classes as well as uncertainty and randomness over time. The model generates a large set of simulated outcomes for each asset class over several time horizons. Forecasts are obtained by computing measures of central tendency in these simulations. Results produced by the tool will vary with each use and over time.
The primary value of the VCMM is in its application to analyzing potential client portfolios. VCMM asset-class forecasts—comprising distributions of expected returns, volatilities, and correlations—are key to the evaluation of potential downside risks, various risk–return trade- offs, and diversification benefits of various asset classes. Although central tendencies are generated in any return distribution, Vanguard stresses that focusing on the full
range of potential outcomes for the assets considered, such as the data presented in this paper, is the most effective way to use VCMM output.
The VCMM seeks to represent the uncertainty in the forecast by generating a wide range of potential outcomes. It is important to recognize that the VCMM does not impose “normality” on the return distributions, but rather is influenced by the so-called fat tails and skewness in the empirical distribution of modeled asset-class returns. Within the range of outcomes, individual experiences can be quite different, underscoring the varied nature of potential future paths. Indeed, this is a key reason why we approach asset-return outlooks in a distributional framework.
Index simulations
The long-term returns of our hypothetical portfolios are based on data for the appropriate market indexes through December 2014. We chose these benchmarks to provide the most complete history possible, and we apportioned the global allocations to align with Vanguard’s guidance in constructing diversified portfolios. Asset classes and their representative forecast indexes are as follows:
• U.S. equities: MSCI US Broad Market Index.
• Global ex-U.S. equities:MSCI All Country World ex USA Index.
• U.S. REITs: FTSE/NAREIT US Real Estate Index.
• Commodity futures: Bloomberg Commodity Index in USD.
• U.S. cash: U.S. 3-Month Treasury–constant maturity.
• U.S. Treasury index: Barclays U.S. Treasury Bond Index.
• U.S. credit bonds: Barclays U.S. Credit Bond Index.
• U.S. high-yield corporates: Barclays U.S. High Yield Corporate Bond Index.
• U.S. bonds: Barclays U.S. Aggregate Bond Index.
• Global ex-U.S. bonds: Barclays Global Aggregate ex-USD Bond Index.
• U.S. TIPS: Barclays U.S. Treasury Inflation Protected Securities Index.
• U.S. short-term Treasury index: Barclays U.S. 1–5 Year Treasury Bond Index.
• U.S. long-term Treasury index: Barclays U.S. Long Treasury Bond Index.
Appendix II. ‘Threshold-only’ rebalancing analysis
To analyze the impact of “threshold-only” rebalancing strategies, we conducted a historical analysis for minimum rebalancing thresholds of 0%, 1%, 5%, and 10%, assuming daily monitoring of a hypothetical 50% stock/50% bond portfolio. If the portfolio’s allocation drifted beyond the rebalancing threshold on any given day, it would be rebalanced back to the target allocation. As shown in Figure A-1, the portfolio that is rebalanced daily with no threshold over the period 1980 through 2014 had an average equity allocation of 50.0% (and an average annualized return of +9.5%), whereas the portfolio that was monitored on a daily basis with a 10% threshold had an average equity allocation of 52.8% (and an average return of +9.6%).
Once again, the magnitude of the differences in the average equity allocation, the average annualized return, and the volatility may not warrant the additional costs associated with a 0% threshold (8,826 rebalancing events) versus a 10% threshold (6 rebalancing events). The chosen strategy depends primarily on investor preference.
Appendix Figures A-2, A-3, and A-4 have been included for comparison purposes and are based on data from 1980 through 2014.
Figure A-1. Comparing daily portfolio rebalancing results for ‘threshold-only’ strategy: Various thresholds, 1980 through 2014
Monitoring frequency Daily Daily Daily Daily Never
Threshold 0% 1% 5% 10% NA
Average equity allocation 50.0% 50.1% 50.5% 52.8% 63.6%
Costs of rebalancing
Annual turnover 8.3% 5.5% 2.4% 1.6% 0.0%
Number of rebalancing events 8,826 414 23 6 0
Absolute framework
Average annualized return 9.5% 9.6% 9.6% 9.6% 9.5%
Annualized volatility 7.7% 7.7% 7.7% 7.9% 10.5%
Notes:This illustration ishypothetical and does not represent the returns of any particular investment. We assumed a portfolio of 50% global stocks/50% global bonds. All returns in nominal U.S. dollars. Stocks represented by Russell 3000 Index, 1980 through 1985; FTSE World Index, 1986 through 1993; FTSE All-World Index, 1994 through September 11, 2003; FTSE Global All Cap Index thereafter through 2014. Bonds represented by Thomson Reuters U.S. All Lives Government Total Market Index, 1980 through 1988; Barclays U.S. Aggregate Bond Index, 1989 through May 31, 2000; and Barclays Global Aggregate Bond Index (USD hedged) thereafter through 2014. There were no new contributions or withdrawals. Dividend payments were reinvested in equities; interest payments were reinvested in bonds. There were no costs. All statistics were annualized.
Sources: Vanguard calculations, based on data from FactSet.
Limited availability of daily return data
It is important to note that the average annualized returns for the 50% stock/50% bond portfolio in Figure A-1, which incorporates daily returns, are higher than those of tables in the body of this paper, owing to the fact that the returns here are based on the period 1980 through 2014, whereas all the other returns in the paper (except where noted) are based on data from 1926 through 2014. The shorter time period was necessitated due to the limited availability of reliable daily data. Accompanying this appendix are comparable tables for monthly, quarterly, and annual rebalancing statistics for the period 1980 through 2014. These tables have been added for comparison purposes. We believe that incorporating the longer time series provides more valuable insight and have only included the 1980 through 2014 results because of the limited availability of daily returns.
Figure A-2. Comparing monthly portfolio rebalancing results for ‘time-and-threshold’ strategy: Various thresholds, 1980 through 2014
Monitoring frequency Monthly Monthly Monthly Monthly Never
Threshold 0% 1% 5% 10% NA
Average equity allocation 50.1% 50.1% 50.6% 52.8% 63.6%
Costs of rebalancing
Annual turnover 4.5% 3.8% 2.5% 1.7% 0.0%
Number of rebalancing events 420 159 21 6 0
Absolute framework
Average annualized return 9.6% 9.6% 9.7% 9.6% 9.5%
Annualized volatility 8.6% 8.6% 8.6% 8.9% 10.5%
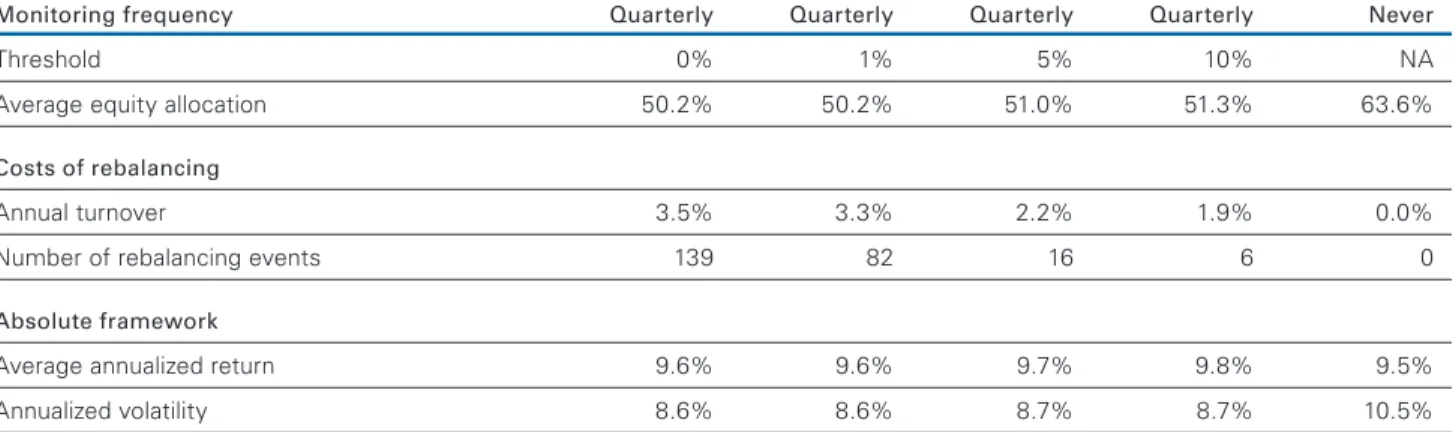
Figure A-3. Comparing quarterly portfolio rebalancing results for ‘time-and-threshold’ strategy: Various thresholds, 1980 through 2014
Monitoring frequency Quarterly Quarterly Quarterly Quarterly Never
Threshold 0% 1% 5% 10% NA
Average equity allocation 50.2% 50.2% 51.0% 51.3% 63.6%
Costs of rebalancing
Annual turnover 3.5% 3.3% 2.2% 1.9% 0.0%
Number of rebalancing events 139 82 16 6 0
Absolute framework
Average annualized return 9.6% 9.6% 9.7% 9.8% 9.5%
Annualized volatility 8.6% 8.6% 8.7% 8.7% 10.5%
Figure A-4. Comparing annual portfolio rebalancing results for ‘time-and-threshold’ strategy:
Various thresholds, 1980 through 2014
Monitoring frequency Annually Annually Annually Annually Never
Threshold 0% 1% 5% 10% NA
Average equity allocation 50.4% 50.5% 50.6% 52.3% 63.6%
Costs of rebalancing
Annual turnover 2.6% 2.5% 2.2% 0.8% 0.0%
Number of rebalancing events 34 31 12 3 0
Absolute framework
Average annualized return 9.7% 9.7% 9.7% 9.6% 9.5%
Annualized volatility 8.6% 8.6% 8.7% 8.9% 10.5%
Notes for appendix Figures A-2, A-3, and A-4: These illustrations are hypothetical and do not represent the returns of any particular investment. We assumed a portfolio of 50% global stocks/ 50% global bonds. All returns in nominal U.S. dollars. Stocks represented by Russell 3000 Index, 1980 through 1985; FTSE World Index, 1986 through 1993; FTSE All-World Index, 1994 through September 11, 2003; FTSE Global All Cap Index thereafter through 2014. Bonds represented by Thomson Reuters U.S. All Lives Government Total Market Index, 1980 through 1988; Barclays U.S. Aggregate Bond Index, 1989 through May 31, 2000; and Barclays Global Aggregate Bond Index (USD hedged) thereafter through 2014. There were no new contributions or withdrawals. Dividend payments were reinvested in equities; interest payments were reinvested in bonds. There were no costs. All statistics were annualized.
Vanguard Research P.O. Box 2600
Valley Forge, PA 19482-2600
© 2015 The Vanguard Group, Inc. All rights reserved.
Vanguard Marketing Corporation, Distributor.
Connect with Vanguard
®>
vanguard.com
For more information about Vanguard funds, visit vanguard.com or call 800-662-2739 to obtain a prospectus. Investment objectives, risks, charges, expenses, and other important information about a fund are contained in the prospectus; read and consider it carefully before investing.