B I O C H E M I S T R Y Copyright © 2017 The Authors, some rights reserved; exclusive licensee American Association for the Advancement of Science. No claim to original U.S. Government Works. Distributed under a Creative Commons Attribution NonCommercial License 4.0 (CC BY-NC).
Solving protein structures using short-distance
cross-linking constraints as a guide for discrete
molecular dynamics simulations
Nicholas I. Brodie,1* Konstantin I. Popov,2* Evgeniy V. Petrotchenko,1
Nikolay V. Dokholyan,2†Christoph H. Borchers1,3,4,5†
We present an integrated experimental and computational approach for de novo protein structure determination in which short-distance cross-linking data are incorporated into rapid discrete molecular dynamics (DMD) simulations as constraints, reducing the conformational space and achieving the correct protein folding on practical time scales. We tested our approach on myoglobin and FK506 binding protein—models fora helix–rich andbsheet–rich proteins, respectively—and found that the lowest-energy structures obtained were in agreement with the crystal structure, hydrogen-deuterium exchange, surface modification, and long-distance cross-linking validation data. Our approach is readily applicable to other proteins with unknown structures.
INTRODUCTION
Since the publication in 2000 of the landmark paper on fold recogni-tion using cross-linking data (1), the idea of solving protein structures using cross-linking distance constraints has attracted the attention of researchers worldwide. It seems intuitively obvious that the three-dimensional structure of a protein should be able to be unequivocally defined by a collection of pairwise short interresidue distances or inter-residue contacts. Unfortunately, there are only a few rare opportunities for the formation of zero-length cross-links, which can be directly translated into interresidue contacts in proteins. These are amide bond formation between adjacent amino and carboxyl groups (2), cross-linking of adjacent tyrosine residues (3), and disulfide bond formation between cysteine residues. Traditional amine-reactive cross-linking reagents can provide only long-distance constraints (>15 Å) between amino groups that have a relatively sparse distribution and are usually only found on the protein surface. Recently, nonspecific short-distance heterobifunctional (4) and homobifunctional (5) photoreactive reagents have been designed for this purpose. These reagents have the potential to form cross-links between pairs of nearby amino acid residues and therefore should beabletoprovide therequired number ofshort-distance constraints for finding the true protein structure.
For the past decade, computational approaches have provided an alternative for protein structure determination (6–8) and have become powerful and widely used tools for computational structural biology (9–13). Great progress is currently being made in knowledge-based prediction methods that take advantage of both multiple protein structures determined by nuclear magnetic resonance (NMR) and x-ray crystallography and advanced homology detection algorithms
(13). De novo structure prediction methods rely solely on energy-based calculations and are attractive because they are knowledge-independent approaches for protein structure prediction (14, 15). For smaller proteins (<100 residues), because of the smaller confor-mational space that needs to be sampled, computational methods can accurately predict native-like structures (16,17). However, larger proteins (>100 residues) fold on a microsecond time scale, which often makes prediction of these structures computationally unrealistic, even if highly efficient computational algorithms and specialized hardware are used (18,19). Energy functions themselves can cause biasing toward or against specific protein structural motifs during protein folding simulations (20–22). Inclusion of experimental data as con-straints on the modeling process has the potential to overcome these issues and increase the accuracy of the predictions. Experimentally derived data on a protein’s structure simultaneously decrease the “allowed”protein conformational space and prevent computational bias toward incorrect protein folds or configurations.
Of the available types of experimentally derived structural data, residue-level or atom-level structural data are preferred. Cross-linking analysis in combination with modern mass spectrometry (MS) provides interresidue distances that can be incorporated into the modeling process. However, cross-linking results can produce inconsistent data because of fluctuations in the solution structure of the protein during the experiment (23,24). Thus, incorporation of cross-linking constraints will define a structural ensemble rather than a single protein structure. This must be taken into considera-tion when selecting the“best fit”models from computationally gen-erated ensembles of conformations (25, 26) and when directly incorporating distance constraints into an energy-based simulation process (23,27).
Here, we present a method for predicting protein structures by adding experimental short-distance cross-linking constraints into dis-crete molecular dynamics (DMD) simulations (28,29). The incorpo-ration of these experimental data considerably reduces the allowed conformational space during simulations, helping to guide the folding of the protein toward conformational ensembles with minimum en-ergies at shorter time scales. We consider this workflow to be the first step in an ongoing effort that will allow the incorporation of multiple types of residue-level experimental constraints—derived from struc-tural proteomics—into the modeling process.
1University of Victoria–Genome British Columbia Proteomics Centre, Vancouver
Island Technology Park, #3101-4464 Markham Street, Victoria, British Columbia V8Z7X8, Canada.2Department of Biochemistry and Biophysics, University of North Carolina, Genetic Medicine Building, 120 Mason Farm Road, Chapel Hill, NC 27599, USA.3Department of Biochemistry and Microbiology, University of Victoria, Room
270d, Petch Building, 3800 Finnerty Road, Victoria, British Columbia V8P 5C2, Canada.
4
Gerald Bronfman Department of Oncology, Jewish General Hospital, Suite 720, 5100 de Maisonneuve Boulevard West, Montreal, Quebec H4A 3T2, Canada.5Proteomics
Centre, Segal Cancer Centre, Lady Davis Institute, Jewish General Hospital, McGill University, 3755 Côte-Sainte-Catherine Road, Montreal, Quebec H3T 1E2, Canada. *These authors contributed equally to this work.
We have tested our workflow on proteins with well-known and well-defined structures, and we have shown that our approach suc-cessfully predicts model structures that agree with known x-ray structures. We have also independently validated the predicted structures with additional experimental structural proteomics tech-niques, such as hydrogen-deuterium exchange (HDX), chemical sur-face modification (SM), and long-distance cross-linking (LD-CL).
RESULTS
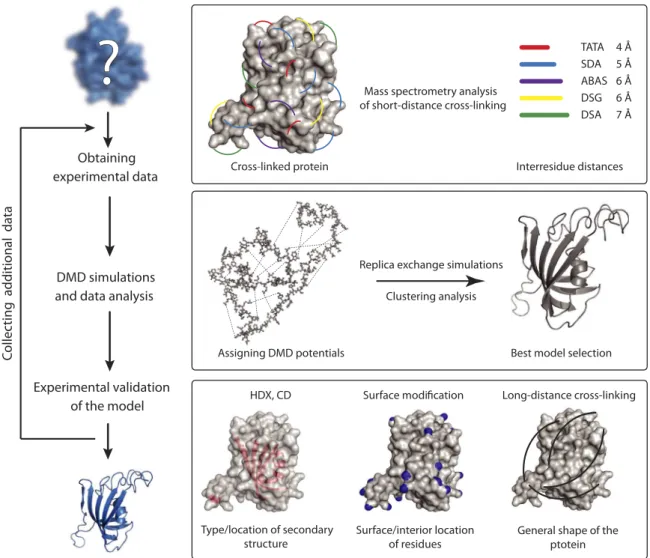
Cross-Linking Discrete Molecular Dynamics (CL-DMD) workflow The workflow for the method is shown in Fig. 1. The overall workflow consists of three main steps: the acquisition of short-distance cross-linking data, the performance of DMD simulations guided by these cross-linking constraints, and the validation of the obtained structures with additional structural proteomics methods. If the model does not meet the validation criteria, the workflow can be repeated after adding additional sets of cross-linking data.
Short-distance cross-linking
The key to this approach is to obtain multiple interresidue short-distance cross-linking constraints covering most of the protein. To
obtain these distance constraints, we used a panel of cross-linking reagents that can produce zero-length (no cross-linker spacer) and short (~5 Å) cross-links. To obtain numerous cross-links for every region of the protein, we used nonselective photoreactive, heterobi-functional and homobiheterobi-functional cross-linkers (4,5). For the proof-of-concept experiments shown here, we used myoglobin (Mb) and the FK506 binding protein (FKBP) models forahelix–andbsheet– rich proteins, respectively. We used a panel of cross-linking reagents consisting of disuccinimidyl adipate (DSA), disuccinimidyl glutarate (DSG), succinimidyl 4,4′-azipentanoate (SDA) (4), azidobenzoic acid succinimide (ABAS) (4), and triazidotriazine (TATA) (fig. S1) (5). DSA and DSG are amine-reactive reagents, SDA and ABAS are het-erobifunctional amino group–reactive and photoreactive reagents, and TATA is a homobifunctional photoreactive reagent. Cross-linked proteins were digested with proteolytic enzymes (trypsin or proteinase K), and the resulting peptides were analyzed by liquid chromatography–tandem mass spectrometry (LC-MS/MS) (fig. S2 and tables S1 and S2). Cross-links were found to be evenly distrib-uted throughout the protein structures, connecting the secondary structure motifs and loops (fig. S3), which were known to be adja-cent. These short-distance cross-links were used as constraints for the DMD simulations.
Obtaining experimental data
DMD simulations and data analysis
Experimental validation of the model
Assigning DMD potentials
Replica exchange simulations
Clustering analysis
Best model selection
?
Mass spectrometry analysisof short-distance cross-linking
Interresidue distances Cross-linked protein
Cross linked protein
TATA 4 Å SDA 5 Å
DSA 7 Å DSG 6 Å ABAS 6 Å
HDX, CD Surface modi cation Long-distance cross-linking
General shape of the ptotein Surface/interior location
of residues Type/location of secondary
structure
C
ollec
ting additional data
DMD simulations
DMD is a physics-based efficient computational algorithm for the structural simulation of proteins and complexes (17,28–30). DMD uses physical principles of ballistic motion to describe the time evo-lution of the atom positions. In the event of a collision, the atoms involved instantaneously exchange their velocities according to energy and momentum conservation laws (17). This algorithm has been shown to provide more efficient sampling of the protein confor-mational space than traditional molecular dynamics simulations, allowing more rapid folding of large proteins. Also, the discrete energy representation allows for the incorporation of experimental pairwise atom proximity constraints (31,32); for each experimental constraint, we have introduced an additional potential to the force field developed (32,33). The combination of these potentials con-strains the positions of the cross-linked atoms during simulations. The width of the potential well is defined by the spacer length of the cross-linker (see Computational methods for details).
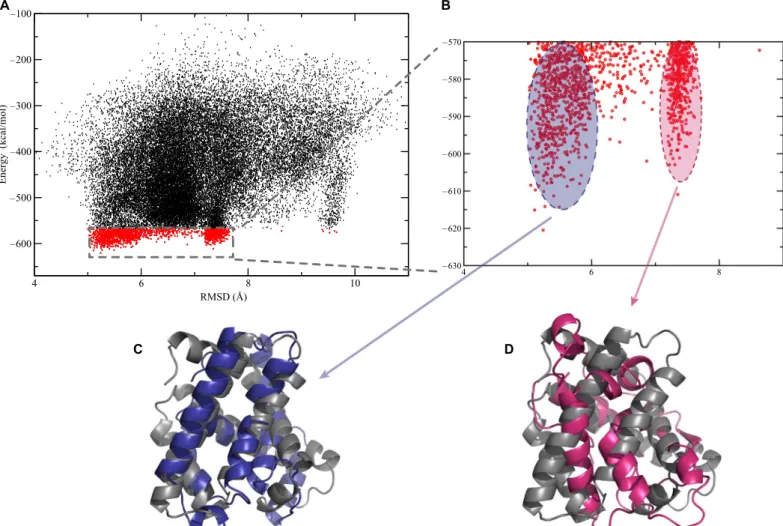
For each protein, all-atom replica exchange simulations were per-formed, starting from the unfolded conformation. During the data analysis, 10% of the structures that had the lowest energies in our DMD simulations were selected, and distance-based clustering was performed among them. These clusters represent conformational
ensembles predicted for the given protein. As a result of the discrete nature of potentials in DMD, there are no continuous forces driving the system to satisfy all of the constraints at the same time. Thus, each of these clusters might satisfy only some of the constraints. For further study, centroids of the most populated clusters with the lowest energies were selected and scored by our energy function as our“best models.” To visualize how the predicted models aligned with known structures (Figs. 2, C to E, and 3, C and D), we determined the root mean square deviation (RMSD) values for all structures generated dur-ing the DMD simulations of Mb and FKBP. The RMSD of Caatom positions quantifies the similarity of the models to the x-ray structures of the proteins [Protein Data Bank (PDB) IDs: 2V1H and 2MPH]. The RMSD values were plotted versus the corresponding energy scores, as provided by the Medusa force field energy function (Figs. 2A and 3A) (29,33). Each point on the plot corresponds to a snapshot of the struc-ture taken during the simulation. In general, it can be seen that during the simulation, the structures cluster in areas with small RMSD values and low energies. This indicates that our approach can accurately ex-plore the conformational space of these proteins. The data in Figs. 2B and 3B represent the states with the 10% lowest energy cutoff. It can be seen that these structures populate several major clusters (see Compu-tational methods for analysis). The models corresponding to each of
2 4 6 8 10
RMSD (Å)
–500
–400
–300
–200
Energy (kcal/mol)
2 4 6 8
–500 –495 –490 –485 –480
A
C D E
B
these clusters, which are aligned with the corresponding x-ray structures, are presented in Figs. 2 (C to E) and 3 (C and D). The RMSD values of the lowest energy models compared to the x-ray structures are 5.4 Å for Mb and 2.7 Å for FKBP. Another strength of the approach presented here is that, based on structures found in the clusters, we can show possible dynamics and fluctuation of the protein structure in the vicinity of the predicted model (fig. S4).
Experimental validation of the models
For experimental validation of the final models, we used circular di-chroism (CD), HDX, chemical SM, and LD-CL techniques. In the current form of the workflow (Fig. 1), for well-structured proteins, such as those used in this study, all of the experimental validation data have to agree with the final models.
Similar to CD, the HDX method provides data on the secondary structure content and the location of the secondary structure motifs within the protein sequence. Here, we used our recently developed top-down HDX method, which combines Fourier transform MS (FTMS) with fragmentation via electron capture dissociation (ECD) (34). A key advantage of this approach is the ability to deter-mine the degree of HDX on the individual residue level (fig. S5). The secondary structure content, as determined both by CD (fig. S5) and
by HDX (fig. S6), was in agreement with that obtained from the final models (fig. S7). Delineation of the secondary structure motifs by ECD-FTMS HDX analysis was also in agreement with the location ofahelices andbstrands in the protein sequences (fig. S8) in the final DMD models.
According to the FKBP CL-DMD model, 78 backbone amides are involved in hydrogen bonding, compared to 72 in the crystal structure. Of these, 38 residues are involved in the formation ofbsheets in the model, compared to 37 in the crystal structure. Thesebsheet residues represent 27 and 26% of the entire protein, respectively. On the basis of the CD data, 35% of the residues are involved inbsheets. On the basis of both the model and the crystal structure, seven residues (repre-senting 5% of the protein) are involved in the formation of a singlea helix. CD data indicate that 4% of the protein is involved inahelices. According to the model, the remaining 40 protected backbone amides form hydrogen bonds with other parts of the protein and are not involved in secondary structure, compared to the 35 in the crystal structure. The model is in agreement with the HDX data, which indi-cate that 79 residues of FKBP are protected from exchange. For Mb, the agreement between the model and CD and HDX data was similarly good. In the CL-DMD model of Mb, there are 88 hydrogen bonds with-in theahelices, whereas in the crystal structure, there are 84. These
4 6 8 10
RMSD (Å)
–600
–500
–400
–300
–200
–100
Energy (kcal/mol)
4 6 8
–630
–620
–610
–600
–590
–580
–570
A B
C D
correspond to 58 and 55% of the total number of residues, respectively. From our CD data, we observed that 55% of the protein wasa-helical. On the basis of the HDX experiments, 90 of 153 residues are protected from exchange.
To further evaluate the models, we performed differential SM experiments with isotopically coded reagents, comparing the folded state with the unfolded state, which was generated by denaturing the protein with 8 M urea. This differential labeling allows us to quan-titatively determine the degree of surface exposure of amino acid resi-dues of the protein. The protein samples in the folded and unfolded states were modified with light and heavy isotopic forms of the reagent, respectively. Reactions were quenched, mixed, and digested with pep-sin, and the resulting peptides were analyzed by LC-MS/MS. In this experimental design (fig. S9), surface-exposed residues equally mod-ified in both folding states appear as doublets of ion signals with equal intensities in the mass spectra. In contrast, buried residues show a higher degree of modification in the unfolded state, resulting in a doublet of peaks with unequal intensities in the mass spectra. For this study, we used the isotopically coded reagent pyridine carboxylic acid N-hydroxysuccinimide (PCAS)-12C6or PCAS-13C6(35), which modifies Lys, Tyr, Ser, and Thr residues. The SM method allowed the detection of specific buried or exposed residues in the proteins (table S3). The locations of all of these residues were in agreement with the final models (fig. S10).
Long-distance Lys-Lys cross-linking using amine-reactive reagents with spacer lengths of >10 Å generally cannot be directly used for the DMD simulations because these constraints are too loose to be reason-ably used. Nevertheless, these long-range constraints can be used to validate the protein structures predicted by our method. Here, we used the amine-reactive cross-linker cyanurbiotindipropionylsuccinimide (CBDPS) (spacer length, ~14 Å) (36). The long-distance intraprotein CBDPS cross-links were in good concurrence with the final models of the proteins (fig. S11).
In summary, application of this new CL-DMD procedure for the de novo protein structure prediction of Mb and FKBP gave results that were in agreement with their known crystal structures. In-solution experiments with HDX, SM, and LD-CL, which were performed to val-idate the DMD-predicted structures, consistently confirmed the modeling results, indicating that CL-DMD can be successfully used to predict unknown protein structures.
DISCUSSION
Here, we describe a method for the determination of protein structures based on DMD simulations guided by short-distance cross-linking con-straints, followed by validation of the obtained solutions by CD, HDX, SM, and LD-CL data. We have tested the proposed approach on the mainlyastructure and mainlybstructure proteins, Mb and FKBP, respectively, and have obtained agreement of the results with known structures of these proteins. Experimentally determined interresidue distance data provide valuable structural information and have the potential to be helpful in any computational approach, such as conventional molecular dynamics or NMR structure prediction algo-rithms (25,37). DMD provides computational efficiency and discrete representation of potential energies, which naturally allow for the gen-eration of conformational ensembles satisfying only a portion of the constraints. This makes DMD a perfect computational platform for the methodology proposed in this study. Short-distance constraints were directly incorporated into the DMD force field energy function, thus
influencing the entire folding process. This allows the software to restrict the conformational space and achieve the folding of native structures on a practical time scale. We believe that both short-distance cross-links and the DMD algorithm are essential for the success achieved by the predictions. For example, when we attempted simulations of the Mb and FKBP proteins without any constraints, we were not able to find any close-to-native structures for a simulation time of 3 × 10⁶steps. We also found that the use of long-distance constraints (>25 Å) did not have any noticeable effect on the simulations (when compared to non-constrained simulations) because the length of the cross-link was com-parable to the size of the protein. However, long-distance constraints can be used for additional validation of the predicted models.
The existence of ensembles of structures, where only a portion of the constraints are satisfied, is an intrinsic property of the discrete energy representation of DMD. The algorithm energetically penalizes structures where the distances between the atoms do not satisfy the experimentally obtained constraints (see Computational methods). However, there is no continuous force during the simulations, which drives the system to a single state that satisfies all of the constraints. In contrast, our method allows for the generation of possible conforma-tional ensembles, to which different energy scores are assigned by the Medusa force field function.
For well-structured proteins, such as those presented in this study, we observe clear separation of the low-energy clusters and a narrow distribution of structures within the clusters. However, in the case of intrinsically disordered proteins, multiple CL-DMD clusters with simi-lar energies are observed, which probably represent coexisting ensembles of conformations. Analysis of the structures within each cluster reveals some aspects of structural dynamics. In fig. S4, we show a tube diagram that indicates particular regions of the proteins that have higher flexibility. Regions of increased flexibility can be located by thicker tubes or by“blurring”of areas of the contact map (fig. S4). The contact frequency map in fig. S4 indicates how often each par-ticular interresidue contact appears in the different structures within the cluster.
In the current form of this approach, we use only cross-linking data as constraints. It is possible to add other types of experimental data to the DMD simulations as additional constraints. We have already shown that limited proteolysis data can be converted to values for incorporation into DMD (38). Secondary structure information from HDX, in cases where it is possible to distinguish betweenaandbstructures, can also potentially be incorporated into the algorithm, especially if the data are from high-resolution experiments where it is possible to delineate the boundaries of the secondary structure motifs at single-residue resolu-tion (34). If residue exposure information from SM experiments can be converted to values and incorporated into the algorithm, this would be another valuable addition to the procedure. All of this experimental information would enhance the computational power of this ap-proach, which would be advantageous to solve the structures of larger proteins. These efforts are currently under way in our laboratories. In addition to the inclusion of experimental data—such as those currently used for the validation step—into the DMD algorithm, alternative types of experimental data, not necessarily at residue-level resolution, can be added to the algorithm for structure validation purposes.
MATERIALS AND METHODS
Materials and reagents
All materials were from Sigma-Aldrich unless otherwise noted. The FKBP protein was a gift from C. J. Nelson (University of Victoria, Canada) and was expressed and purified as in the study by Gudavicius
et al.(39).
Short-distance cross-linking
Aliquots (40ml) of horse Mb (from skeletal muscle) at a concentration of 1 mg/ml in phosphate-buffered saline (PBS) were cross-linked using either 0.40 mM ABAS, 0.6 mM DSA, or 0.6 mM DSG (all from Creative Molecules Inc.). The structures of these cross-linking reagents are shown in fig. S1.
A solution of Mb (0.28 mg/ml) containing SDA (0.328 mM) was used for the SDA cross-linking reactions. FKBP25 was prepared at a concentration of 0.14 mg/ml, and 105ml were cross-linked using either DSA or TATA, at a concentration of 0.46 mM. These re-action mixtures were incubated for 10 min in the dark to allow the
N-hydroxysuccinimide ester reaction to take place, followed by 10 min of ultraviolet (UV) irradiation under a 25-W UV lamp (Mineralight Lamp UVGL-58, UVP) at 254 nm for ABAS and TATA or 366 nm for SDA. Samples were then acidified with formic acid (FA) before LC-MS/MS analysis.
Computational methods
Simulation details
We used an all-atom protein model with a united atom representa-tion in which all of the heavy atoms and the polar hydrogens are explicitly represented. The discrete Medusa force field used in DMD approximates atomic interactions (such as van der Waals and electrostatic interactions as well as hydrogen bonding) by multi-step square-well potentials (30,32). The Lazaridis-Karplus implicit solvation model (40) was used to account for the solvation energy. In addition, we used the Andersen thermostat (41) to control the temperature during the simulations.
To incorporate interresidue proximity constraints into DMD sim-ulations, we introduced additional square-well potentials between the cross-linked atoms into the Medusa force field
H¼HMedusaþ
∑
Ncl
i<jEðrijÞ
where the first term is the Hamiltonian corresponding to the
orig-inal Medusa force field (30,32). The second term represents the sum
of pairwise interactions for the cross-linked atoms.Nclis the number
of cross-links. For each pair of cross-linked atoms,E(rij) has a
well-like shape
EðrijÞ ¼ e; rij≤r ij
min
0; rijmin<rij<rijmax
e; rij≥rijmax 8
> < > :
whererijis the distance between two cross-linked atoms during the
simulations;rijminandrijmaxare the minimum and maximum interatom
distances allowed by each particular cross-linker, respectively; ande
is the energetic value assigned for the depth of the well (here, we used 20 kcal/mol).
This potential allows the atoms to freely move within the wells and will energetically penalize any motion outside the potential wells. Thus, the addition of a set of these cross-link–based potentials will make the corresponding portion of the conformational space energet-ically prohibitive for trajectories during protein folding simulations.
To reduce the degree of complexity of the folding protein, we did not explicitly model the heme group during Mb simulations. Instead, we introduced a few additional structural constraints between the Mb residues that directly interact with the heme group [based on the x-ray structure of the protein (PDB ID: 2V1H)].
Using these constraints, we used a replica exchange approach (42,43) for the DMD simulations. Starting with the unfolded confor-mation, we ran multiple parallel simulations for different replicas of the same system at different temperatures. The replicas periodically ex-change their temperatures, allowing the system to overcome local energy barriers and explore a larger conformational space. For each run, we analyzed 24 parallel replicas with temperatures ranging from 0.375 to 0.605 kcal/(mol*kB), corresponding to ~187 to 302 K. We ran simulations for 2 × 10⁶time steps and saved snapshots of the structures every 1000 steps per replica.
Clustering
The trajectories obtained were then analyzed, and the 10% of the structures that had the lowest energy were selected. We performed a clustering analysis on these structures using the algorithm implemented in Wordom and GROMACS (44,45).
We calculated the distribution for the pairwise RMSD values be-tween the Caatoms of the selected structures and defined the highest peak of the obtained distribution as a threshold value for the distances between the structures within a single cluster. Last, we selected a centroid of the most populated cluster that had the lowest average energy as the model.
Model dynamics
The strength of this new approach lies in the incorporation of exper-imentally derived constraints as part of the force field, which is used to computationally predict the protein structure, instead of using these constraints as filters during the last stage of structure determi-nation. This approach allows the user (i) to identify a native-like pro-tein conformation and (ii) to capture its intrinsic dynamic and structural fluctuations.
The final models for FKBP and Mb and their dynamics are presented in fig. S4. Figure S4 (B and E) shows an overlay of the regions and amplitudes of the fluctuations with the model structures. Figure S4 (C and F) illustrates how often different residue-residue contacts appeared during the model dynamics.
A static contact map is a binary two-dimensional matrix in which a value of 1 is assigned for every two residues (iandj) of the protein, if the distance between their Caatoms is less than a specified cutoff distance (8 Å in our case). Contacts of a residue with itself,i=j, are omitted. The map is symmetrical with respect toiandj; thus, only half of the map is needed to show the contacts for an entire protein. The static contact maps for our predicted models are plotted below the diagonals in fig. S4 (C and F).
this cluster. To calculate this value, we counted the number of the structures within this cluster for which residuesiandjare in the con-tact, normalized by the total number of structures within the cluster.
LC-MS/MS analysis
MS analysis was performed using a nano–HPLC (high-performance liquid chromatography) system (EASY-nLC II, Thermo Fisher Sci-entific), coupled to the electrospray ionization source of the LTQ Orbitrap Velos or Fusion (Thermo Fisher Scientific), using conditions described in the study of Petrotchenkoet al.(46). Briefly, samples were injected onto a trapping column [inner diameter (ID), 100mm; outer diameter (OD), 3 × 60mm] packed with Magic C18AQ (pore size, 100 Å; particle size, 5mm) (Bruker-Michrom), prepared in-house, and desalted by washing with 5ml of solvent A (2% acetonitrile and 98% water, both containing 0.1% FA). Peptides were separated with a 60-min gradient [0 to 60 min: 4 to 40% solvent B (90% acetonitrile, 10% water, and 0.1% FA); 60 to 62 min: 40 to 80% B; and 62 to 70 min: 80% B], on an analytical column (ID, 75mm; OD, 360mm) packed with Magic C18AQ 1(pore size, 100 Å; particle size, 5mm) (prepared in-house), with an IntegraFrit (New Objective Inc.), and equilibrated with solvent A. MS data were acquired using a data-dependent method. The data-dependent acquisition used dynamic exclusion, with an exclu-sion window of 10 parts per million and an excluexclu-sion duration of 60 s. MS and MS/MS events used 60,000 and 30,000 resolution FTMS scans, respectively, with a scan range of 400 to 2000 mass/charge ratio (m/z) in the MS mode. For MS/MS, the collision energy was set to 35%. Data were analyzed using the DXMSMS Match program from our ICC-CLASS (Isotopically Coded Cleavable Cross-Linking Analysis Software Suite), or with Kojak (47). For scoring and assignment of the MS/MS spectra, b and y ions were primarily used, with additional confirmation from collision-induced dissociation cleavage of the cross-linker, when-ever this was available.
Circular dichroism
CD spectra were recorded on a Jasco J-720 spectrometer in a stream of nitrogen. Theaandbstructure contents were calculated using the BeStSel web server (48).
Hydrogen-deuterium exchange
Top-down ECD-FTMS HDX was performed as described previously (see fig. S6 for the workflow) (34). Briefly, protein solution and D2O in separate syringes were continuously mixed in a 1:4 ratio (with a final concentration of 80% D2O) via a three-way tee, which was connected to a 100mm × 5 cm capillary, providing a labeling time of 2 s. The outflow from this capillary was mixed with a quenching solution containing 0.4% FA, 20% acetonitrile, 64% D2O, and 16% H2O from a third syringe via a second three-way tee and was injected into a Bruker 12 T Apex-Qe hybrid Fourier transform ion cyclotron resonance MS, equipped with an Apollo II electrospray source. In-cell ECD fragmentation experiments were performed using a cathode fil-ament current of 1.3 A and a grid potential of 13 V. Approximately 800 scans were accumulated over the m/zrange of 200 to 2000, corresponding to an acquisition time of approximately 20 min for each ECD spectrum. Deuteration levels of the amino acid residues were determined using the HDX Match program (49).
Surface modification
Chemical SM with pyridine carboxylic acidN-hydroxysuccinimide ester (PCAS) was performed as previously described (as shown in
fig. S9) (35). Briefly, Mb was prepared at 50mM in PBS containing 8 M urea (pH 7.4) to generate the unfolded state or in PBS only to generate the folded state. Either the light or the heavy form of the isotopically coded reagent (PCAS-12C6or PCAS-13C6) (Creative Molecules Inc.) was then added to give a final concentration of 10 mM. Reaction mixtures were incubated for 5 min and then quenched with 50 mM ammonium bicarbonate. Next, samples were mixed at a 1:1 ratio, combining folded (PCAS-12C) with unfolded (PCAS-13C) samples. Samples were acidified with 150 mM acetic acid and digested with pepsin at a 20:1 protein/enzyme ratio overnight at 37°C. After digestion, samples were prepared for MS analysis using C18ZipTip tips (Millipore). ZipTip tips were equilibrated with 30ml of 0.1% trifluoroacetic acid (TFA), and the sample was introduced, then washed with 30ml of 0.1% TFA, and eluted with 2ml of 0.1% aqueous FA/50% acetonitrile. Samples were analyzed by LC-MS/MS as described above.
LD-CL using CBDPS
For the CBDPS reactions, FKBP and Mb were prepared at a concen-tration of 1 mg/ml and cross-linked with 0.1 mM CBDPS. Reactions were quenched with 10 mM ammonium bicarbonate. Aliquots were then split and digested with either trypsin or proteinase K at an enzyme/protein ratio of 1:20. Samples were then acidified with FA before LC-MS/MS analysis.
SUPPLEMENTARY MATERIALS
Supplementary material for this article is available at http://advances.sciencemag.org/cgi/ content/full/3/7/e1700479/DC1
table S1. Mb cross-links used as constraints in DMD simulations.
table S2. FKBP25 cross-links used as distance constraints in DMD simulations. table S3. Residues modified by PCAS-12C
6/13C6in the urea-PCAS SM experiments.
fig. S1. Panel of isotopically coded cross-linking reagents used for the structural characterization of Mb and FKBP.
fig. S2. Cross-linking analysis workflow. fig. S3. Cross-linking results for Mb and FKBP. fig. S4. Conformational dynamics of predicted structures. fig. S5. CD results for Mb and FKBP.
fig. S6. HDX analysis workflow. fig. S7. HDX of intact proteins.
fig. S8. Deuteration status of backbone amides for Mb and FKBP. fig. S9. Surface modification experimental scheme.
fig. S10. Surface modification results for Mb and FKBP. fig. S11. LD-CL analysis using CBDPS for Mb and FKBP.
REFERENCES AND NOTES
1. M. M. Young, N. Tang, J. C. Hempel, C. M. Oshiro, E. W. Taylor, I. D. Kuntz, B. W. Gibson, G. Dollinger, High throughput protein fold identification by using experimental constraints derived from intramolecular cross-links and mass spectrometry.Proc. Natl. Acad. Sci. U.S.A.97, 5802–5806 (2000).
2. T. Boulikas, J. M. Wiseman, W. T. Garrard, Points of contact between histone H-1 and the histone octamer.Proc. Natl. Acad. Sci. U.S.A.77, 127–131 (1980). 3. G. Bitan, A. Lomakin, D. B. Teplow, Amyloidb-protein oligomerization: Prenucleation
interactions revealed by photo-induced cross-linking of unmodified proteins.
J. Biol. Chem.276, 35176–35184 (2001).
4. N. I. Brodie, K. A. T. Makepeace, E. V. Petrotchenko, C. H. Borchers, Isotopically-coded short-range hetero-bifunctional photo-reactive crosslinkers for studying protein structure.J. Proteomics118, 12–20 (2015).
5. N. I. Brodie, E. V. Petrotchenko, C. H. Borchers, The novel isotopically coded short-range photo-reactive crosslinker 2,4,6-triazido-1,3,5-triazine (TATA) for studying protein structures.J. Proteomics149, 69–76 (2016).
6. D. Baker, A. Sali, Protein structure prediction and structural genomics.Science294, 93–96 (2001).
8. K. A. Dill, J. L. MacCallum, The protein-folding problem, 50 years on.Science338, 1042–1046 (2012).
9. B. Webb, A. Sali, Comparative protein structure modeling using MODELLER.Curr. Protoc. Bioinformatics54, 5.6.1–5.6.37 (2016).
10. L. A. Kelley, M. J. E. Sternberg, Protein structure prediction on the Web: A case study using the Phyre server.Nat. Protoc.4, 363–371 (2009).
11. C. Cole, J. D. Barber, G. J. Barton, The Jpred 3 secondary structure prediction server.
Nucleic Acids Res.36, W197–W201 (2008).
12. Y. Zhang, J. Skolnick, TM-align: A protein structure alignment algorithm based on the TM-score.Nucleic Acids Res.33, 2302–2309 (2005).
13. C. A. Rohl, C. E. M. Strauss, K. M. S. Misura, D. Baker, Protein structure prediction using Rosetta.Methods Enzymol.383, 66–93 (2004).
14. J. L. MacCallum, A. Perez, K. A. Dill, Determining protein structures by combining semireliable data with atomistic physical models by Bayesian inference.Proc. Natl. Acad. Sci. U.S.A.112, 6985–6990 (2015).
15. A. Perez, J. A. Morrone, E. Brini, J. L. MacCallum, K. A. Dill, Blind protein structure prediction using accelerated free-energy simulations.Sci. Adv.2, e1601274 (2016). 16. K. Lindorff-Larsen, P. Maragakis, S. Piana, D. E. Shaw, Picosecond to millisecond structural
dynamics in human ubiquitin.J. Phys. Chem. B120, 8313–8320 (2016).
17. D. Shirvanyants, F. Ding, D. Tsao, S. Ramachandran, N. V. Dokholyan, Discrete molecular dynamics: An efficient and versatile simulation method for fine protein characterization.
J. Phys. Chem. B116, 8375–8382 (2012).
18. D. E. Shaw, P. Maragakis, K. Lindorff-Larsen, S. Piana, R. O. Dror, M. P. Eastwood, J. A. Bank, J. M. Jumper, J. K. Salmon, Y. Shan, W. Wriggers, Atomic-level characterization of the structural dynamics of proteins.Science330, 341–346 (2010).
19. A. C. Pan, T. M. Weinreich, S. Piana, D. E. Shaw, Demonstrating an order-of-magnitude sampling enhancement in molecular dynamics simulations of complex protein systems.
J. Chem. Theory Comput.12, 1360–1367 (2016).
20. F. Palazzesi, M. K. Prakash, M. Bonomi, A. Barducci, Accuracy of current all-atom force-fields in modeling protein disordered states.J. Chem. Theory Comput.11, 2–7 (2015). 21. S. Rauscher, V. Gapsys, M. J. Gajda, M. Zweckstetter, B. L. de Groot, H. Grubmüller,
Structural ensembles of intrinsically disordered proteins depend strongly on force field: A comparison to experiment.J. Chem. Theory Comput.11, 5513–5524 (2015).
22. J. Henriques, C. Cragnell, M. Skepö, Molecular dynamics simulations of intrinsically disordered proteins: Force field evaluation and comparison with experiment.J. Chem. Theory Comput.11, 3420–3431 (2015).
23. E. Ravera, L. Sgheri, G. Parigi, C. Luchinat, A critical assessment of methods to recover information from averaged data.Phys. Chem. Chem. Phys.18, 5686–5701 (2016). 24. M. Bonomi, G. T. Heller, C. Camilloni, M. Vendruscolo, Principles of protein structural
ensemble determination.Curr. Opin. Struct. Biol.42, 106–116 (2017).
25. Y. Chen, S. L. Campbell, N. V. Dokholyan, Deciphering protein dynamics from NMR data using explicit structure sampling and selection.Biophys. J.93, 2300–2306 (2007). 26. A. Belsom, M. Schneider, L. Fischer, O. Brock, J. Rappsilber, Serum albumin domain
structures in human blood serum by mass spectrometry and computational biology.
Mol. Cell. Proteomics15, 1105–1116 (2016).
27. W. Boomsma, J. Ferkinghoff-Borg, K. Lindorff-Larsen, Combining experiments and simulations using the maximum entropy principle.PLOS Comput. Biol.10, e1003406 (2014). 28. N. V. Dokholyan, S. V. Buldyrev, H. E. Stanley, E. I. Shakhnovich, Discrete molecular
dynamics studies of the folding of a protein-like model.Fold. Des.3, 577–587 (1998). 29. F. Ding, D. Tsao, H. Nie, N. V. Dokholyan, Ab initio folding of proteins with all-atom
discrete molecular dynamics.Structure16, 1010–1018 (2008).
30. E. A. Proctor, N. V. Dokholyan, Applications of Discrete Molecular Dynamics in biology and medicine.Curr. Opin. Struct. Biol.37, 9–13 (2016).
31. Y. Chen, F. Ding, N. V. Dokholyan, Fidelity of the protein structure reconstruction from inter-residue proximity constraints.J. Phys. Chem. B111, 7432–7438 (2007). 32. F. Ding, N. V. Dokholyan, Discrete molecular dynamics simulation of biomolecules,
inComputational Modeling of Biological Systems: From Molecules to Pathways, N. V. E. Dokholyan, Ed. (Springer, 2012), pp. 55–73.
33. S. Yin, L. Biedermannova, J. Vondrasek, N. V. Dokholyan, MedusaScore: An accurate force field-based scoring function for virtual drug screening.J. Chem. Inf. Model.48, 1656–1662 (2008).
34. J. Pan, J. Han, C. H. Borchers, L. Konermann, Hydrogen/deuterium exchange mass spectrometry with top-down electron capture dissociation for characterizing structural transitions of a 17 kDa protein.J. Am. Chem. Soc.131, 12801–12808 (2009). 35. J. J. Serpa, A. P. Patterson, J. Pan, J. Han, D. S. Wishart, E. V. Petrotchenko, C. H. Borchers,
Using multiple structural proteomics approaches for the characterization of prion proteins.J. Proteomics81, 31–42 (2013).
36. E. V. Petrotchenko, J. J. Serpa, C. H. Borchers, An isotopically-coded CID-cleavable biotinylated crosslinker for structural proteomics.Mol. Cell. Proteomics10, M110.001420 (2011).
37. R. B. Best, M. Vendruscolo, Determination of protein structures consistent with NMR order parameters.J. Am. Chem. Soc.126, 8090–8091 (2004).
38. E. A. Proctor, L. Fee, Y. Tao, R. L. Redler, J. M. Fay, Y. Zhang, Z. Lv, I. P. Mercer, M. Deshmukh, Y. L. Lyubchenko, N. V. Dokholyan, Nonnative SOD1 trimer is toxic to motor neurons in a model of amyotrophic lateral sclerosis.Proc. Natl. Acad. Sci. U.S.A. 113, 614–619 (2016).
39. G. Gudavicius, D. Dilworth, J. J. Serpa, N. Sessler, E. V. Petrotchenko, C. H. Borchers, C. J. Nelson, The prolyl isomerase, FKBP25, interacts with RNA-engaged nucleolin and the pre-60S ribosomal subunit.RNA20, 1014–1022 (2014).
40. T. Lazaridis, M. Karplus, Effective energy functions for protein structure prediction.
Curr. Opin. Struct. Biol.10, 139–145 (2000).
41. H. C. Andersen, Molecular dynamics simulations at constant pressure and/or temperature.
J. Chem. Phys.72, 2384–2393 (1980).
42. Y. Okamoto, Generalized-ensemble algorithms: Enhanced sampling techniques for Monte Carlo and molecular dynamics simulations.J. Mol. Graph. Model.22, 425–439 (2004). 43. R. Zhou, B. J. Berne, R. Germain, The free energy landscape forbhairpin folding in explicit
water.Proc. Natl. Acad. Sci. U.S.A.98, 14931–14936 (2001).
44. J. D. Chodera, W. C. Swope, J. W. Pitera, C. Seok, K. A. Dill, Use of the weighted histogram analysis method for the analysis of simulated and parallel tempering simulations.
J. Chem. Theory Comput.3, 26–41 (2007).
45. S. Pronk, S. Páll, R. Schulz, P. Larsson, P. Bjelkmar, R. Apostolov, M. R. Shirts, J. C. Smith, P. M. Kasson, D. van der Spoel, B. Hess, E. Lindahl, GROMACS 4.5: A high-throughput and highly parallel open source molecular simulation toolkit.Bioinformatics29, 845–854 (2013).
46. E. V. Petrotchenko, K. A. T. Makepeace, J. J. Serpa, C. H. Borchers, Analysis of protein structure by cross-linking combined with mass spectrometry.Methods Mol. Biol.1156, 447–463 (2014).
47. E. V. Petrotchenko, K. A. T. Makepeace, C. H. Borchers, DXMSMS match program for automated analysis of LC-MS/MS data obtained using isotopically coded CID-cleavable cross-linking reagents.Curr. Protoc. Bioinformatics48, 8.18.1–8.18.19 (2014). 48. A. Micsonai, F. Wien, L. Kernya, Y.-H. Lee, Y. Goto, M. Réfrégiers, J. Kardos, Accurate
secondary structure prediction and fold recognition for circular dichroism spectroscopy.
Proc. Natl. Acad. Sci. U.S.A.112, E3095–E3103 (2015).
49. E. V. Petrotchenko, C. H. Borchers, HDX match software for the data analysis of top-down ECD-FTMS hydrogen/deuterium exchange experiments.J. Am. Soc. Mass Spectrom.26, 1895–1898 (2015).
Acknowledgments:We would like to thank C. J. Nelson and G. Gudivicious for their generous gift of the FK506 protein. We would also like to thank K. A. T. Makepeace for the CBDPS cross-linking of myoglobin.Funding:The University of Victoria–Genome British Columbia Proteomics Centre was supported by the Genomic Innovations Network from Genome Canada and Genome British Columbia (project codes 204PRO and 214PRO). C.H.B. would also like to thank the Natural Sciences and Engineering Research Council of Canada and the Leading Edge Endowment Fund for support. This work was also supported by NIH grants R01GM080742, R01GM114015, R01GM081764, and R01GM123247.Author contributions:Project conception and design of the structural proteomics experiments: E.V.P.; collection and analysis of the structural proteomics data: N.I.B.; implementation of the constraints into the algorithm and DMD calculations: K.I.P.; writing of the manuscript: E.V.P. and K.I.P.; project supervision: N.V.D. and C.H.B.Competing interests:E.V.P. and C.H.B. are cofounders of Creative Molecules Inc. All other authors declare that they have no competing interests.Data and materials availability:All data needed to evaluate the conclusions in the paper are present in the paper and/or the Supplementary Materials. Additional data related to this paper may be requested from the authors. The DMD software can be obtained at www.moleculesinaction.com/pdmd.html, at no charge for academic use. The scripts for the data analysis are available upon request from the Dokholyan Laboratory ([email protected]).
Submitted 13 February 2017 Accepted 19 May 2017 Published 7 July 2017 10.1126/sciadv.1700479