EXAMINING THE INCREASING INCIDENCE OF COLORECTAL CANCER IN YOUNGER ADULTS
Caitlin C. Murphy
A dissertation submitted to the faculty at the University of North Carolina at Chapel Hill in partial fulfillment of the requirements for the degree of Doctor of Philosophy in the Gillings School of
Global Public Health (Epidemiology).
Chapel Hill 2016
Approved by:
Robert S. Sandler
John A. Baron
Jennifer L. Lund
Hanna K. Sanoff
iii
ABSTRACT
Caitlin C. Murphy: Examining the increasing incidence of colorectal cancer in younger adults (Under the direction of Robert S. Sandler)
The overall incidence of colorectal cancer (CRC) has declined in the U.S., but the
incidence of CRC in younger adults (age <50) is rapidly increasing. The underlying mechanisms
that have contributed to this increase are poorly understood. This dissertation project sought to:
1) describe the demographic, clinicopathologic, and socioeconomic characteristics and
treatment patterns of younger stages II and II CRC patients; 2) estimate the contribution of age,
time period, and birth cohort to the increasing incidence of young-onset CRC; and 3) determine
patterns of colonoscopy use in younger adults.
Several population-based data sources were leveraged to examine reasons for the
increasing incidence of young-onset CRC. The National Cancer Institute’s Patterns of Care
studies were used to describe differences in the characteristics of stages II and III CRC patients
by age at diagnosis. Hierarchical Poisson models were used to estimate the independent
contribution of age, time period, and birth cohort on increases in the incidence of young-onset
CRC. Incidence rates were derived from the Surveillance, Epidemiology, and End Results
program of cancer registries. The prevalence of CRC risk factors, including obesity, physical
inactivity, and smoking, were also described across time period and birth cohort using data from
national surveys. Lastly, MarketScan Commercial Claims and Encounters Data, an
employer-based claims database, was used to characterize patterns of colonoscopy use in younger
iv
There were differences in the distribution of young-onset CRC by race/ethnicity. A higher
proportion of black and Hispanic patients were diagnosed at a younger age compared to whites.
Results of the age-period-cohort analysis showed a significant age and birth cohort effect in
both younger and older populations, but the effect of time period was only observed among
older ages. The prevalence of obesity generally increased across both time period and birth
cohort, while smoking prevalence declined. Trends in physical inactivity remained relatively
constant. Colonoscopy use among younger adults increased across sex, age, and geographic
region from 2001 to 2009 and decreased through 2013.
This study provides strong support for different mechanisms involved in the development
of CRC across the life course. The factors responsible for increases in young-onset CRC, albeit
v
ACKNOWLEDGEMENTS
I would like to thank Dr. Robert Sandler for his support and trust in my work (and
timeline). Like Dr. Sandler, the best mentors are those who teach by their example. I would also
like to thank my committee members for their thoughtful feedback and care, Dr. Linda Harlan,
Dr. Joan Warren, and Dr. Ann Geiger from the Healthcare Delivery Research Program at the
National Cancer Institute for their endless encouragement and allowing me to use the Patterns
of Care data, and Dr. Sally Vernon at the University of Texas School of Public Health for her
inspiration and guidance since the very beginning.
I have received funding support from the Digestive Disease Epidemiology Training
Program (T32 DK07634) in the Division of Gastroenterology and Hepatology at UNC School of
Medicine.
And to my family and friends, for never questioning my resolve or slowing me down; in
particular, Heather, for her impeccable editorial skills, patience, and iced beverages, Mary, for a
Bethesda home, Allison, for exciting travel and much-needed distraction, the Gimbel-Welles
vi
In the years since my mom died from breast cancer, I have been fortunate to know
countless others on a similar mission against cancer. Each has shared their kindness and
wisdom with me, a gift that gives deeper meaning to this work. As for my mom, I would be amiss
if I did not acknowledge the hours she spent editing my high school essays and her faith that
one day I could brave it on my own. She once stayed awake until the early hours of the morning
to help me finish a project on literary tone; we scoured our household books for passages that
captured the essence of each tone word—playful, disgruntled, resilient. On other occasions we
spent inordinate amounts of time together dissecting letters in words in sentences in essays, a
tedious process that has cursed me with a tendency toward perfectionism. I never anticipated,
during the late nights on our Compaq Presario, that I would author numerous scientific
publications, much less write a lengthy doctoral dissertation. Somehow, though, I think she
vii
TABLE OF CONTENTS
LIST OF TABLES ... x
LIST OF FIGURES ... xi
LIST OF ABBREVIATIONS ... xiii
CHAPTER 1: STATEMENT OF SPECIFIC AIMS ... 1
CHAPTER 2: REVIEW OF LITERATURE ... 5
A. BACKGROUND ... 5
B. CHARACTERISTICS OF YOUNG COLORECTAL CANCER PATIENTS ... 6
C. REASONS FOR THE INCREASE IN YOUNG-ONSET COLORECTAL CANCER ... 9
D. ROLE OF HEALTH SERVICES USE ... 10
E. SUMMARY ... 11
CHAPTER 3: METHODS ... 15
A. SPECIFIC AIM 1 APPROACH ... 15
B. SPECIFIC AIM 2 APPROACH ... 22
C. SPECIFIC AIM 3 APPROACH ... 29
CHAPTER 4 RESULTS: SOCIODEMOGRAPHIC AND CLINICOPATHOLOGIC CHARACTERISTICS OF YOUNGER ADULTS WITH STAGES II AND III COLORECTAL CANCER ... 37
A. INTRODUCTION ... 37
B. METHODS ... 39
C. RESULTS ... 42
viii
CHAPTER 5 RESULTS: AN AGE-PERIOD-COHORT ANALYSIS OF THE CHANGING INCIDENCE PATTERNS OF COLORECTAL
CANCER ... 55
A. INTRODUCTION ... 55
B. METHODS ... 56
C. RESULTS ... 60
D. DISCUSSION ... 62
CHAPTER 6 RESULTS: PATTERNS OF COLONOSCOPY USE AMONG YOUNGER ADULTS ... 85
A. INTRODUCTION ... 85
B. METHODS ... 86
C. RESULTS ... 87
D. DISCUSSION ... 88
CHAPTER 7: DISCUSSION ... 101
A. SUMMARY OF FINDINGS ... 101
B. PUBLIC HEALTH IMPLICATIONS ... 104
C. STRENGTHS ... 106
D. LIMITATIONS ... 108
E. FUTURE RESEARCH ... 110
F. CONCLUSIONS ... 111
APPENDIX A: FACTORS ASSOCIATED WITH YOUNG-ONSET COLORECTAL CANCER IN STUDIES WITH A COMPARISON GROUP ... 112
APPENDIX B: CHARACTERISTICS OF PATIENTS WITH YOUNG-ONSET COLORECTAL CANCER IN STUDIES WITH NO COMPARISON GROUP ... 115
APPENDIX C: EXAMPLE OF MEDICAL RECORD ABSTRACTION FORM USED FOR PATTERNS OF CARE STUDIES ... 118
ix
x
LIST OF TABLES
Table 3.1: Data source, description, and preliminary data by study aim ... 32
Table 3.2: Summary of covariates measured in Specific Aim 1 ... 33
Table 3.3: Minimum statistically-detectable absolute differences
in proportions ... 34
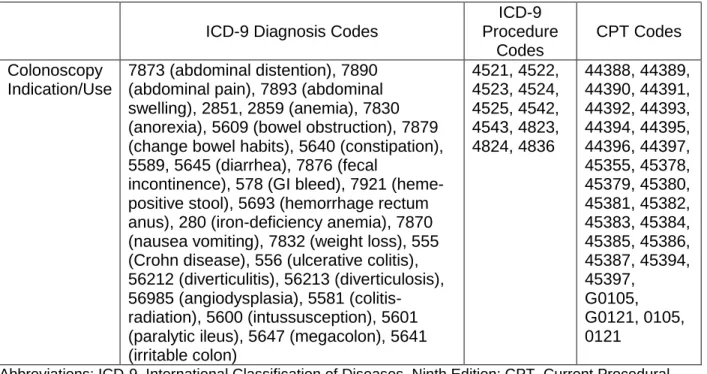
Table 3.4: ICD-9 diagnosis codes for colonoscopy indication and
ICD-9 procedure and CPT codes for colonoscopy use ... 35
Table 4.1: Characteristics of 6,862 patients diagnosed with stages
II and III colorectal cancer, 1990-2010, by age at diagnosis ... 48
Table 4.2: Characteristics of 706 younger (age <50 years) patients diagnosed with stages II and III colorectal cancer, 1990-2010, by
race/ethnicity ... 51
Table 4.3: County-level socioeconomic indicators of 6,862 patients diagnosed with stages II and III colorectal cancer, 1990-2010, by
age at diagnosis ... 53
Table 4.4: Receipt of chemotherapy and radiation therapy among 6,862 patients diagnosed with stages II and III colorectal cancer,
1990-2010, by age and stage at diagnosis ... 54
Table 5.1: Poisson HAPC-CCREM estimates of incidence rates of
colorectal cancer, SEER 9, 1973-2012 ... 66
Table 6.1: Number of colonoscopies performed (in thousands), enrollee-years (in thousands), and colonoscopy rate per 1,000
xi
LIST OF FIGURES
Figure 2.1: Annual percentage-change based predicted incidence rates of colon (A) and rectal (B) cancer by age compared with
incidence rates in 2010 ... 13
Figure 2.2: Conceptual model of the increasing incidence of
young-onset colorectal cancer ... 14
Figure 3.1: Age-by-time period data structure and synthetic birth
cohorts ... 36
Figure 5.1: Age by time period incidence rates of colorectal
cancer, all ages, SEER 9, 1973-2012 ... 67
Figure 5.2: Age by time period incidence rates of colorectal
cancer, ages 21-49 years, SEER 9, 1973-2012 ... 68
Figure 5.3: Time period by age incidence rates of colorectal
cancer, all ages, SEER 9, 1973-2012 ... 69
Figure 5.4: Time period by age incidence rates of colorectal
cancer, ages 21-49 years, SEER 9, 1973-2012 ... 70
Figure 5.5: Birth cohort by age incidence rates of colorectal
cancer, all ages, SEER 9, 1973-2012 ... 71
Figure 5.6: Birth cohort by age incidence rates of colorectal
cancer, ages 21-49 years, SEER 9, 1973-2012 ... 72
Figure 5.7: Prevalence of obesity by time period for four race/sex
subgroups, ages 21-49 years, NHANES, 1973-2012 ... 73
Figure 5.8: Mean body mass index by time period for four
race/sex subgroups, ages 21-49 years, NHANES, 1973-2012 ... 74
Figure 5.9: Median body mass index by time period for four
race/sex subgroups, ages 21-49 years, NHANES, 1973-2012 ... 75
Figure 5.10: Prevalence of obesity by birth cohort for four race/sex
subgroups, ages 21-49 years, NHANES, 1973-2012 ... 76
Figure 5.11: Mean body mass index by birth cohort for four
race/sex subgroups, ages 21-49 years, NHANES, 1973-2012 ... 77
Figure 5.12: Median body mass index by birth cohort for four
race/sex subgroups, ages 21-49 years, NHANES, 1973-2012 ... 78
Figure 5.13: Prevalence of physical inactivity by time period for
xii
Figure 5.14: Prevalence of physical inactivity by birth cohort for
four race/sex subgroups, ages 21-49 years, BRFSS, 1984-2011 ... 80
Figure 5.15: Prevalence of current smoking by time period for
four race/sex subgroups, ages 21-49 years, NHIS, 1974-2012 ... 81
Figure 5.16: Prevalence of current smoking by birth cohort for
four race/sex subgroups, ages 21-49 years, NHIS, 1974-2012 ... 82
Figure 5.17: Predicted incidence rates of colorectal cancer by time
period, all ages, SEER 9, 1973-2012 ... 83
Figure 5.18: Predicted incidence rates of colorectal cancer by birth
cohort, all ages, SEER 9, 1973-2012 ... 84
Figure 6.1: Colonoscopy rate per 1,000 enrollee-years by
calendar year ... 97
Figure 6.2: Colonoscopy rate per 1,000 enrollee-years by
calendar year and sex ... 98
Figure 6.3: Colonoscopy rate per 1,000 enrollee-years by
calendar year and age ... 99
Figure 6.4: Colonoscopy rate per 1,000 enrollee-years by
xiii
LIST OF ABBREVIATIONS
AHRF Area Health Resource File
APC age-period-cohort
BMI body mass index
BRFSS Behavioral Risk Factor Surveillance System
CCREM cross-classified random effects model
CDC Centers for Disease Control and Prevention
CPT Current Procedural Terminology
CRC colorectal cancer
CS Collaborative Staging
EOD Extent of Disease (staging)
FOBT fecal occult blood test
HAPC hierarchical age-period-cohort
ICD-9 International Classification of Diseases, Ninth Edition
ICD-O-3 International Classification of Disease, Oncology, Third Edition
ML maximum likelihood
MMR mismatch repair
MSI microsatellite instability
NCI National Cancer Institute
NHANES National Health and Nutrition Examination Survey
NHIS National Health Interview Survey
PCR polymerase chain reaction
POC Patterns of Care
REML restricted maximum likelihood
xiv
1
CHAPTER 1
STATEMENT OF SPECIFIC AIMS
The overall incidence and mortality of colorectal cancer (CRC) have declined over the
past two decades in the U.S., but recent research suggests CRC in younger adults (age <50
years) is rapidly increasing. Incidence rates have increased annually by up to 4% for rectal
cancer and 2% for colon cancer among younger patients since the 1970s, with the steepest
increases in the 40-49 year age group. By 2030, approximately 11% and 23% of all colon and
rectal cancers, respectively, will be diagnosed in patients younger than the current screening
age. Because guidelines recommend that screening (with hemoccult testing, colonoscopy, or
sigmoidoscopy) begin at age 50 for average risk individuals, early recognition of CRC in young
patients without a known family history or genetic predisposition (i.e., familial adenomatous
polyposis, Lynch syndrome) is challenging. This is especially concerning because more than
half of young patients report no family history of CRC, and only a small minority have hereditary
cancer syndromes.
Although the magnitude of the increase in young-onset CRC incidence has been
previously described, the underlying mechanisms that have contributed to this increase are
poorly understood. Reasons for the increase in incidence in younger patients remain largely
unknown. The current literature is limited to single institution settings, small sample sizes, and
inconsistent inclusion criteria across studies (e.g., age cutoff of young-onset CRC). No study
has examined the potential influence of modifiable risk factors or health services use on
2
younger adults. This study used a multidimensional approach to address the characteristics of
and factors contributing to young-onset CRC. The specific aims were as follows:
Specific Aim 1a: Describe the demographic, clinicopathologic, and socioeconomic
characteristics of younger and older patients newly diagnosed with stages II and III CRC during
the period 1990-2010. Hypothesis – Specific Aim 1a: Younger and older stages II and III CRC
patients differ by demographic, clinicopathologic, and socioeconomic characteristics.
Specific Aim 1b: Examine differences in treatment patterns, including type of surgery,
chemotherapy receipt, and radiation receipt, by age at diagnosis. Hypothesis – Specific Aim 1b:
Younger CRC patients more frequently receive chemotherapy and radiation therapy compared
to older patients.
Patients newly diagnosed with stages II and III CRC were identified from the National
Cancer Institute’s Patterns of Care (POC) studies in 1990-2010. Detailed tumor information
(e.g., histologic grade, tumor site) was abstracted from patient medical records and verified by
treating physicians. POC data were linked with the Area Health Resource File to describe
socioeconomic indicators and healthcare access in this patient population. As a secondary aim,
treatment patterns (e.g., chemotherapy agents and regimens received) were described.
Characteristics of younger patients (age <50 years) were compared to older CRC patients (age
≥50 years) during the same period to determine differences in disease patterns.
Specific Aim 2a: Estimate the contribution of age, time period, and birth cohort to the
increasing incidence of young-onset CRC. Hypothesis – Specific Aim 2a: There are differential
effects of time period and birth cohort in the incidence of CRC by age.
Specific Aim 2b: Describe changes in the prevalence of lifestyle-related modifiable risk
3
Hypothesis – Specific Aim 2b: Changes in the prevalence of modifiable risk factors parallel
increases in the incidence of young-onset CRC.
Hierarchical Poisson models were used to determine the extent to which age, time
period, and birth cohort account for changes in incidence over time. CRC incidence rate data
was derived from the Surveillance, Epidemiology, and End Results 9 registries (1973-2012).
Prevalence of obesity (% body mass index ≥30 kg/m2), physical inactivity (% no physical activity
in last 30 days), and current smoking was estimated using the National Health and Nutrition
Examination Survey, Behavioral Risk Factor Surveillance System, and National Health Interview
Survey, respectively.
Specific Aim 3: Determine patterns of colonoscopy use in individuals younger than age
50 years. Hypothesis – Specific Aim 3: Colonoscopy use in younger adults has increased over
time but does not fully account for trends in the incidence of young-onset CRC.
An estimated 14 million colonoscopies are performed in the U.S. annually, but
colonoscopy use in younger populations not yet eligible for screening has not been extensively
studied. Individual-level healthcare claims from MarketScan (Truven Health Analytics, Ann
Arbor, MI), a large employer-based claims database, were used to determine changes in the
number of colonoscopies performed in persons age younger than 50 years over the period
2001-2013. Understanding increases in colonoscopy use provides additional information on
CRC trends in younger adults that expand knowledge gained in Aims 1 and 2.
This dissertation study used an innovative approach to leverage data from three large,
well-defined sources to examine the increasing incidence as a function of patient and tumor
characteristics, modifiable risk factors (obesity, physical inactivity, current smoking), and health
services use. By using complementary methods and techniques from the fields of epidemiology,
4
of CRC in younger populations. Results may inform clinical guidelines and recommendations
5
CHAPTER 2
REVIEW OF LITERATURE
A. BACKGROUND
Increasing Incidence of Colorectal Cancer in Younger Adults
The incidence of colorectal cancer (CRC) in younger adults is rapidly increasing in the
U.S. Data from the National Cancer Institute’s (NCI) Surveillance, Epidemiology, and End
Results (SEER) Program show the incidence of CRC has increased by up to 5% per year
among younger patients (age <50 years) since the 1970s.1-6 The steepest increases have
occurred in the 40-49 year age group. For example, CRC incidence was 11.9 per 100,000
among 40-44 year olds in 1987 but rose to 17.9 per 100,000 in 2006, an increase of 67%.1 If
current trends persist, in the next 20 years the incidence of colon and rectal cancer may
increase by 90% and 124%, respectively, for patients 20-34 years, and by 28% and 46%,
respectively, for patients 35-49 years (Figure 2.1).7 Despite the overall population trends in
aging, by 2030, approximately 11% of all colon and 23% of all rectal cancers are expected to be
diagnosed in patients younger than age 50.7
The rise of CRC in younger adults (i.e., young-onset CRC) stands in sharp contrast to
CRC incidence patterns in older populations. Beginning in the 1990s, CRC incidence and
mortality rates have consistently decreased among adults age 50 years and older, with the
largest absolute declines among adults 65 years and older.8 Overall 5-year relative survival
rates have simultaneously increased, from 50% in 1975-1977 to 66% in 2003-2009.8 Much of
6
detection of CRC and lowers mortality and incidence by removing premalignant polyps (e.g.,
adenomatous, sessile serrated, traditional serrated). Current guidelines recommend screening
with colonoscopy, sigmoidoscopy, or fecal occult blood test for those at average risk begin at
age 50.10 Other than cervical cancer, CRC is the only cancer for which both incidence and
mortality can be reduced through population-based screening.11
Challenges of Diagnosing CRC in Younger Adults
Early recognition of CRC in younger patients is challenging. Because guidelines
recommend that screening begin at age 50 for individuals at average risk of CRC, it is difficult to
diagnose CRC in young patients without a known family history or genetic predisposition (i.e.,
familial adenomatous polyposis, Lynch syndrome). This is especially concerning because more
than half of young patients report no family history of CRC, and a small minority have hereditary
cancer syndromes.12 A recent study13 found only 5% of individuals in a random sample of
patients who were diagnosed with CRC before age 50 had Lynch syndrome; this finding is only
slightly larger than the prevalence of Lynch syndrome (1-3%) in all patients with CRC.14 The use
of screening in younger populations is limited (i.e., not considered appropriate care), and
symptoms often go unrecognized. Younger patients who are symptomatic often do not seek
medical attention for several months after the onset of symptoms, 15,16 and, because CRC is not
commonly seen in this population, physicians may not attribute symptoms such as abdominal
pain and rectal bleeding to cancer.
B. CHARACTERISTICS OF YOUNGER CRC PATIENTS
Sociodemographic and Clinicopathologic Features of Young-Onset CRC
Characteristics of younger CRC patients have not been extensively studied. Studies of
young-onset CRC typically use demographic variables to describe incidence patterns in
7
examine biological features of the tumor that may explain the earlier onset of CRC. Data from
SEER registries and the National Cancer Database show the incidence of young-onset CRC is
similar among males and females,2,5,6 but African Americans have higher incidence rates
compared to non-Hispanic whites.2,5,17 Other factors with the most consistent association with
young-onset CRC are tumor site (rectum or right-colon),15,18-22 mucinous or signet ring cell
histology,18,19,21,23-29 poorly differentiated or undifferentiated grade tumors,15,18,21,23,24,26-28,30 and a
higher stage of disease at diagnosis.15,18,21,23,24,26-28,31,32 Lymphovascular invasion,
12,20,21,23-25,28,33,34 perineural invasion,19,21,23,33,34 and synchronous tumors23,28,33 are less consistently
associated with young-onset CRC, with some studies reporting a positive relationship and
others suggesting no association. Tumor growth patterns (e.g., infiltrative vs. expanding, gross
type) have not been frequently studied.25,28,34 Appendix A provides a summary of the empiric
findings regarding the relationship between young-onset CRC and select patient and tumor
characteristics in studies with a comparison group; Appendix B provides a summary of those
findings in studies without a comparison group.
Molecular Pathways of CRC Carcinogenesis in Younger Patients
Established pathways of CRC carcinogenesis only account for a small subset of young
patients diagnosed with CRC. Carcinogenic pathways are often defined by their molecular
features: chromosomal instability, microsatellite instability (MSI), and CpG island methylation
(CIMP), with mutations in specific genes often associated with each pathway.35 The majority of
CRCs are thought to arise through the classic adenoma-carcinoma sequence of pathogenesis,
which involves alterations to APC, KRAS, SMAD2, SMAD4, and TP53 genes. APC and KRAS
mutations are found in 80% and 45% of these carcinomas, respectively.36 The second major
pathway of carcinogenesis is characterized by the presence of MSI due to defective mismatch
repair (MMR) genes. In non-inherited CRC, this is almost always due to the acquired promoter
8
characterized by widespread aberrant DNA hypermethylation at select CpG islands (i.e., DNA
regions with a high frequency of CpG sites, where a cytosine nucleotide occurs next to a
guanine nucleotide) and are preferentially located in the proximal colon and associated with
BRAF mutation.37 Tumors are often both CIMP and MSI-high because methylation-associated
MSI generally does not occur among sporadic (i.e., not hereditary) cases outside the context of
CIMP.38 A few investigators have recently explored the molecular features of young-onset CRC
and found no difference in the overall mutational rate (as measured by the number of single
nucleotide variations per patients) among younger and older patients.39,40 However, the specific
mutations involved in young-onset CRC appear to be distinct. SMAD4, MMR genes (MSH6,
MLH1, MLH2), ARID1A, IGF1R, and KIT have been shown to be more frequently mutated
among younger patients. Compared to older patients, the majority of tumors from young
patients do not show KRAS, APC, TP53, and BRAF mutations, 20, 28, 39 which are common
features of carcinogenic pathways in CRC. These findings suggest the biology of young-onset
CRC may be different from what is currently known about the biology of CRC in the overall
population.
Treatment of Young-Onset CRC
Younger CRC patients often receive more aggressive treatment regimens. Studies
consistently show that younger CRC patients more frequently receive chemotherapy and/or
radiation therapy compared to older patients.19,41 Even among stage II colon cancer patients, for
whom guidelines recommend against adjuvant chemotherapy,42 a large proportion of younger
patients receive therapy.33,43-45 The higher proportion of younger CRC patients treated with
chemotherapy and/or radiation therapy may be an indication of both over-treatment of
normal-risk and appropriate treatment of high-normal-risk (e.g., poorly differentiated histology, lymphovascular
invasion) patients. Most studies, however, do not describe patterns of care in subgroups of
9
because of younger age and therapy given for aggressive tumor biology). Further, differences in
the type of chemotherapy agents given to older and younger patients have not been well
studied. Despite more aggressive therapies in younger patients, many studies report that the
overall survival is no better than that observed in older CRC patients.18,21,23,24,26,33,34,46,47
The literature on characteristics of younger CRC patients is limited in several ways. Most
studies are of patients treated in a single institution. Few of the same variables have been
examined across studies, and even when the same characteristics were studied, they were
defined or measured differently. Inclusion criteria are not consistent (e.g., some studies define
young-onset CRC as <40 years while others use <50 years), and there are differences in stage
at diagnosis among younger and older patients (i.e., younger patients tend to be diagnosed at
later stages), making comparisons difficult. It is not possible to draw conclusions from the few
exploratory studies of molecular differences in young- and older-onset CRC. As a consequence,
we know very little about the relative importance of clinicopathologic and/or molecular features
in the development of young-onset CRC. Findings of previous studies warrant further
investigation in larger, population-based samples.
C. REASONS FOR THE INCREASE IN YOUNG-ONSET CRC
Modifiable Risk Factors of CRC
Reasons for the increase in CRC incidence in younger patients are poorly understood.
Although the magnitude of the increase has been previously described, little is known about the
underlying mechanisms that have contributed to this increase. Several established modifiable
risk factors for CRC, including unhealthy diet, obesity, physical inactivity, and smoking, have
been proposed as the major drivers of the increase in adults age <50 years.48,49 Meta-analyses
demonstrate significant associations between CRC risk and red and processed meat
10
waist-to-hip ratio),52-54 sedentary behavior and physical inactivity,55 and cigarette smoking.56
Although some studies report only a modest association between diet, adiposity, and CRC, the
relationship between CRC and physical activity is consistent across multiple studies and in
different settings and populations.57 Increases in the prevalence of many of these risk factors
have paralleled the rise in young-onset CRC. Consumption of fast food and/or food prepared
away from home increased 5-fold among children and 3-fold among adults between the late
1970s and mid-1990s.58 Obesity prevalence has also risen dramatically among adults, from
13% in 1960-196259 to 35% in 2011-2012.60 Central/abdominal obesity, in particular, which is
associated with a higher relative risk of CRC54, has increased by nearly 50% in men and women
over the last 25 years.61 As poor dietary behavior and obesity has risen, physical activity rates in
children and young adults have also declined. More than half of U.S. adults and adolescents do
not meet recommended physical activity guidelines.62 The prevalence of current smoking has
varied over time, with an overall decreasing trend; however, younger adults (age 18-35)
reported the highest prevalence of current use of tobacco products in recent national surveys
compared to other age groups.63 The extent to which changes in the prevalence of risk factors
explain growth in the incidence of young-onset CRC has not been studied.
D. ROLE OF HEALTH SERVICES USE
Prevalence of Endoscopy Use
Changes in the use of endoscopy procedures, such as colonoscopy, may also facilitate
further understanding of the incidence of CRC in younger patients. Approximately 11-14 million
colonoscopies are performed each year in the U.S.,64,65 but little is known about the prevalence
of colonoscopy use in populations that are not yet eligible for screening recommendations.
Across all age groups, the overall use of colonoscopy has dramatically increased in the last 15
years. The National Health Interview Survey, which is considered the gold standard for
11
colonoscopy for CRC screening, from 19% in 2000 to 55% in 2010.66,67 Other studies of
administrative billing claims estimate there were 3,800 lower endoscopies (for any indication)
performed per 100,000 insurance enrollees in 2009, an increase of 17% since 2000.65
Colonoscopy is a key component of the CRC care continuum. Although adults age <50
years generally do not undergo routine colonoscopy, patterns of colonoscopy use in younger
populations may explain some of the increase in young-onset CRC. For example, if
colonoscopy use has increased by 10%, while the incidence of CRC has simultaneously
doubled, it would suggest that endoscopy does not fully account for the increase in young-onset
CRC. Understanding the use of colonoscopy in persons age <50 years is important in
determining the extent to which endoscopy independently accounts for changes in the incidence
of young-onset CRC.
E. SUMMARY
Multidimensional Framework
The burden of young-onset CRC is rapidly increasing. Reasons for this increase are
complex. Most studies have failed to consider the multiple influences that have likely contributed
to CRC in younger adults, instead only focusing on a single dimension (e.g., clinicopathologic
characteristics) of CRC. Evidence is lacking regarding the impact of modifiable risk factors and
health services use on young-onset CRC. Guided by a conceptual model (Figure 2.2), this
dissertation project used complementary methods to better describe and understand the
underlying mechanisms that have led to the increase of CRC in adults age <50 years.
Innovation of the Study
This study was the first to examine reasons for the increase in young-onset CRC. The
rapid growth in CRC among younger adults has been well described, but several important gaps
12
young CRC patients are largely unknown. Many studies are limited by small sample sizes,
confounding by stage at diagnosis, single institution settings, and lack of a comparison group. In
addition, the etiology of young CRC is not well understood. Trends in unhealthy dietary choices,
obesity, and physical inactivity, and endoscopy use among younger adults may contribute to
increases in CRC. However, risk factors have not been systematically evaluated in this setting,
and no study has examined patterns of colonoscopy use in younger adults not eligible for
screening recommendations. Population-based analyses are critical to understanding the
unique disease patterns of young-onset CRC. This dissertation project used an innovative
approach to address these concerns by leveraging data from three large, well-defined sources
(majority population-based) to examine the increasing incidence of young-onset CRC as a
function of patient and tumor characteristics, lifestyle-related modifiable risk factors (obesity,
physical inactivity, current smoking), and health services use. By using complementary methods
and techniques from the fields of epidemiology, demography, and health services, the study
provides insight into the reasons for and distribution of CRC in younger populations. Results can
be used to inform clinical guidelines and recommendations regarding the prevention, diagnosis,
13
14
Figure 2.2. Conceptual model of increasing incidence of young-onset colorectal cancer
15
CHAPTER 3 METHODS
The overall goal of this dissertation study was to determine the underlying mechanisms
that have contributed to the rising incidence of young-onset colorectal cancer (CRC). Three
cohorts were assembled from large, well-defined data sources to gain insight into the reasons
for and distribution of CRC in younger populations (Table 3.1).
A. SPECIFIC AIM 1 APPROACH
Study Design
In Specific Aim 1, we described the sociodemographic characteristics and
clinicopathologic features of younger (age <50 years) patients diagnosed with CRC. As a
secondary aim, we described treatment patterns (e.g., type of surgery and receipt of
chemotherapy and radiation therapy) in this population. Stages II and III CRC patients were
sampled from the National Cancer Institute’s Surveillance, Epidemiology, and End Results
(SEER) program of cancer registries. SEER routinely collects information from hospitals,
pathology laboratories, surgical centers, and radiation facilities on patient demographics, tumor
characteristics, and first-course treatment for all persons diagnosed with cancer residing in
SEER geographic regions. Chemotherapy and radiation therapy (neoadjuvant and adjuvant) are
often underreported in SEER; therefore, the NCI annually conducts Patterns of Care (POC)
studies on a sample of patients with select cancers to assess the extent to which adjuvant
therapies are received in clinical practice.
Patients’ medical records were abstracted to verify information on patient demographics
16
KRAS mutation, BRAF mutation, microsatellite instability [MSI]) and treatment planned or given
as reported in SEER. As part of POC studies, additional treatment detail, including receipt of
specific chemotherapy agents, radiation therapy, and dates of treatment following diagnosis,
was collected from medical records by trained abstractors. Because adjuvant therapies are
often given outside of the hospital setting, and SEER data are primarily hospital-based, the
treating physician was contacted to verify therapy received or recommended. Treating
physicians were also asked to provide names and addresses of other physicians who may have
treated the patients, who were subsequently contacted for treatment information. Doctor
verification substantially improves completeness of chemotherapy ascertainment or confirms
that no chemotherapy or radiation were given. Physician responses were received on more than
85% of sampled patients.
We linked POC data with the Area Health Resource File (AHRF), an extensive
county-level database comprised of socioeconomic indicators (e.g., education county-level, % living below
poverty line). Linking AHRF with POC by patient county of residence allowed us to better
describe sociodemographic characteristics of the cohort. A cohort design based on extant data
was an efficient approach to obtain a large sample of CRC patients and address our research
question. Such designs are often called historical because all follow-up information is available
at the study outset; however, all data within POC were collected prospectively (i.e., in the year
following diagnosis), and we did not take any future events into consideration when creating the
cohort.
Study Population
Stages II and III CRC patients in participating SEER registries were eligible for POC
studies in 1990, 1991, 1995, 2000, 2005, and 2010.41,69,70 Participating registries included the
metropolitan areas of Atlanta (1990-2010), Detroit (1990-2010), Los Angeles (1995, 2000, 2005,
(1990-17
2010), and the states of Hawaii (1990-2010), New Mexico (1990-2010), Iowa (1990-2010),
Connecticut (1990-2010), Alaska (2000 only), Utah (1990-2010), Kentucky (2010 only), Greater
California (2005, 2010), Louisiana (2005, 2010), and New Jersey (2005, 2010). Eligible patients
were stratified within registries by tumor site (colon or rectum), and a random sample was taken
from within each stratum. Beginning in 1995, there was oversampling by race/ethnicity to obtain
more stable estimates for racial subgroup analyses. Patients were sampled according to the
staging scheme used by SEER in each study year. In 1990, 1991, 1995, and 2000, patients
were sampled based on Extent of Disease (EOD) 10 coding, and in 2005 and 2010, patients
were sampled based on Collaborative Staging (CS) coding. EOD and CS coding record the
farthest extent of disease based on the combined clinical and pathological assessment. Clinical
information took priority when a patient was treated with preoperative therapy, otherwise
pathological information took priority. TNM staging was derived by mapping T and N status from
EOD and CS coding. Stage II included T3 or T4 tumors with no positive regional lymph nodes,
and stage III included any T1 to T4 tumors with regional lymph node involvement. These stage
definitions also correspond approximately to stage B2 and C of the Aster-Coller modification of
Duke’s original staging system.
Patients were ineligible for POC studies if they were younger than age 20; previously
diagnosed with cancer (excluding non-melanoma skin cancer); diagnosed at autopsy or on
death certificate only; or diagnosed with a synchronous cancer. We considered young CRC
patients to be those age 20-49 years, and older CRC patients were age greater than 50 years.
An estimated 7,000 patients were diagnosed with stages II and III CRC during the study
period; approximately 1,400 of these were patients age <50 years (Table 3.1). POC studies
provided a number of unique advantages for conducting population-based epidemiologic
research because each participating registry area has a defined population, and detailed tumor
18
physicians. The data available in POC studies provided a greater breadth and depth of
information than that available solely from medical claims and/or SEER registries. The age and
sex distributions of patients in POC reflect those of the U.S. population, and the SEER program
includes registries with a high percentage of African Americans (Detroit, Atlanta, Louisiana),
Asian Americans (Seattle, San Francisco, Los Angeles, San Jose-Monterey), and Hispanics
(Los Angeles, Greater California). The large size and ethnic diversity of this study population
were strengths that enabled us to examine CRC characteristics within population subgroups by
race and sex.
Covariate Assessment
A summary of covariates that were measured in Specific Aim 1 is provided in Table 3.2.
Demographic and clinicopathologic information was abstracted from patient medical records by
trained abstractors. An example of the abstraction form is shown in Appendix C. Demographic
characteristics included age (years), sex (male, female), race/ethnicity (non-Hispanic white,
non-Hispanic black, Hispanic, other), insurance (private, Medicare, Medicaid, other, none), and
delivery site/geographic region. Clinicopathologic characteristics included tumor site (ascending,
transverse, or descending colon, hepatic flexure, splenic flexure, sigmoid colon, rectosigmoid
junction, rectum), stage (II, III), histology (adenocarcinoma, mucinous, signet ring cell), and
histologic grade (well, moderately, poorly, undifferentiated).
TNM staging was derived by mapping T and N status from EOS and CS coding
(described above), where stage II included T3 or T4 tumors with no positive regional lymph
nodes, and stage III included any T1 to T4 tumors with regional lymph node involvement.
Low-grade CRC was defined as well and moderately differentiated tumors, and high-Low-grade CRC
included poorly differentiated and undifferentiated tumors, according to established protocols of
19
and signet ring cell tumors were defined as those with more than half of the tumor displayed as
extracellular mucin or signet rings, respectively.73,74
KRAS mutation, BRAF mutation, and MSI were collected in 2010 only. The purpose of
KRAS testing is to identify point mutations in codon 12 and 13 of the KRAS gene. There are
currently no specific methodology recommendations and no FDA-approved KRAS mutation
tests available; however, all methods are based on the polymerase chain reaction (PCR). The
most common method for KRAS testing is direct sequencing of KRAS PCR products.75 Although
the specific method of KRAS genotyping may differ across POC sites, a recent study reported
good agreement (90% concordance) in KRAS mutation status of tumors from patients across
different detection methods (e.g.., sequencing, hybridization).76BRAF mutation testing, used to
detect the presence of a V600E mutation on the BRAF gene, is most often performed by
amplification and direct DNA sequence analysis, although allele-specific PCR is an acceptable
alternative method. PCR-based BRAF testing requires small quantities of DNA and is highly
sensitive.77 Finally, microsatellite status is evaluated using tissue sections from the primary
tumor with a PCR assay using a panel of five microsatellite markers (BAR-25, BAT-26, D2S123,
D5S346, D17S250), as recommended by the NCI.78 Tumors were considered MSI-high if two or
more of the five microsatellite sequences were mutated; tumors with only one mutated
sequence were classified as MSI-low. Microsatellite stable tumors had no mutations in the
microsatellite panel.
Any surgery, radiation therapy, and chemotherapy given as first-course treatment was
abstracted from patient medical records. An example of the treatment verification form is given
in Appendix D. Surgery included surgery type (polypectomy, partial colectomy, subtotal
colectomy/hemicolectomy, total colectomy, total proctocolectomy, or coloproctotectomy with
resection of a continuous organ), date, number of lymph nodes examined, number of positive
20
Radiation therapy included date of initiation, sequence with surgery (before, after, before and
after, intraoperative), and sequence with chemotherapy (before, after, concurrent).
Chemotherapy included dates of initiation (dates reported for all therapies initiated),
sequence with surgery (before, after, before and after), specific agents (e.g., 5-flourouracil,
oxaliplatin), and combination regimens (e.g., FOLFOX, FOLFIRI).
Socioeconomic indicators were derived from POC, SEER, and the AHRF. POC contains
patient-level information on clinical trial participation, hospital type (private, nonprofit, or
government), hospital size (based on total bed size), and approved residency training program.
We also used a composite index of socioeconomic status based on measures developed by
Yost et al.,79 including occupation, unemployment, poverty, education, income, and housing.
The index was constructed to assess the relationship between socioeconomic status and
cancer incidence using SEER data.80 Data used in the index were derived from Census 2000
and American Community Survey 2005-2009 and reflect the populations and census tracts
covered by the SEER 17 registries. The index (measured in quintiles) was available for study
years 2000, 2005, and 2010. Lastly, we used AHRF measures of per capita income, median
household income, education level (persons age ≥25 years with less than a high school
diploma, high school or more, or four or more years of college), poverty (persons living below
poverty line), unemployment, total number of active physicians, and total number of
gastroenterologists. All socioeconomic indicators in the AHRF were measured on the county
level and collected at various time points. In cases where an AHRF variable was not collected in
the same year as POC, we used the next closest collection year. For example, total number of
physicians was not collected in AHRF in 2010; therefore, we used data on total number of
21
Statistical Analysis
To test the hypothesis that there are differences in the sociodemographic characteristics
and clinicopathologic features of young-onset CRC and older-onset CRC, we examined the
distribution of covariates in young (age <50 years) and older (age ≥50 years) CRC patients with
descriptive statistics (means, medians, minima, maxima, frequencies, cross-tabulations). As
was appropriate, we also examined the distribution of covariates within subgroups of younger
and older CRC patients by race and sex. As part of the secondary aim to examine differences in
treatment patterns, we compared the proportions of younger and older CRC patients who
received common chemotherapy agents, combination chemotherapy regimens, and radiation
therapy, as well as differences in type of surgery performed and surgical outcomes (e.g.,
number of lymph nodes examined). For all analyses, proportions and means were calculated
with stratum-specific sample weights to account for the complex survey design. Sample weights
were calculated as the inverse of the sampling proportion for each sampling stratum.
Sensitivity Analysis
To account for potential heterogeneity of CRC in older patients (e.g., the CpG island
methylator phenotype is most common in female CRC patients age ≥70 years), we conducted
sensitivity analyses that further categorized older CRC patients into two age groups: 50-69
years and ≥70 years. Younger (age <50 years) CRC patients were compared to older CRC
patients in both the 50-69 and ≥70 year age groups.
Sample Size and Power
We assumed that a minimum of 10% absolute difference was meaningful to detect. We
set the level of significance at 5% and statistical power at 80% for a 2-sided test of all
hypotheses. Power analyses were conducted in SAS (version 9.3). Table 3.3 provides the
22
CRC patients (from 10% to 50%). The sample size of 1,400 younger CRC patients and 5,600
older CRC patients (see Table 3.1) provided 80% power to detect as little as a 4% difference in
younger and older CRC patients when the prevalence of the covariate was 10% among older
patients. If the prevalence of a covariate under study was as high as 50% among older patients,
we were able to detect a difference of 7%.
B. SPECIFIC AIM 2 APPROACH
Study Design
In Specific Aim 2, we estimated the contribution of age, time period, and birth cohort on
the increasing incidence of young-onset CRC using Poisson cross-classified random effects
models (CCREM). CCREM have been widely used in sociology and demography research81
and have more recently been applied to cancer incidence and mortality rates.82 To complement
incidence data, we also described changes in the prevalence of lifestyle-related modifiable risk
factors in young-adult (age 21-49 years) populations. We used data from the National Health
and Nutrition Examination Survey (NHANES), Behavioral Risk Factor Surveillance System
(BRFSS), and National Health Information Survey (NHIS) to determine the extent to which
life-style related modifiable risk factors (obesity, physical inactivity, and current smoking) have
paralleled to the increase of young-onset CRC.
Study Population
We identified all patients diagnosed with stages I-IV CRC in 1973-2012 from SEER 9
registries. SEER 9 registries include Atlanta, Connecticut, Detroit, Hawaii, Iowa, New Mexico,
San Francisco—Oakland, Seattle—Puget Sound, and Utah, approximately 9.5% of the U.S.
population. They are the oldest of the SEER registries, which allowed us to examine incidence
rates over the longest period of time. Populations covered by SEER are comparable to the
23
patients with a race/ethnicity other than non-Hispanic white or black from the study population in
order to obtain more stable estimates for the CCREM approach. There were 378,000 patients
diagnosed with stages I-IV CRC in the SEER 9 registries from 1973-2012, of which we
anticipated 30,000 cases would be among those age 21-49 years (Table 3.1). We derived
obesity prevalence from NHANES phases I (1971-1975), II (1976-1980), and III (1988-1994)
and the continuous cycles (1999-2012); physical inactivity prevalence from BRFSS in
1984-2010; and the prevalence of current smoking from NHIS in 1974, 1976-1980, 1983, 1985,
1987-1988, 1990-1995, and 1997-2012 (Table 1). NHANES contains anthropometric measures of
height and weight from population-based samples of U.S. adults. BRFSS annually collects data
in all 50 states via telephone surveys regarding health-related risk behaviors, chronic health
conditions, and the use of preventive services. Widely considered the gold standard in tracking
health status, the NHIS collects data on a broad range of health topics through personal
household interviews. Obesity, physical inactivity, and current smoking were calculated specific
to four race-sex subgroups (white males, white females, black males, black females), ages
21-49 years, using survey data.
Covariate Assessment
SEER defines CRC anatomically as being located in the colon (ascending, transverse,
descending, hepatic flexure, splenic flexure, sigmoid colon; International Classification of
Disease for Oncology, Third Edition [ICD-O-3] codes 18.2-18.9) or rectum (rectum, rectosigmoid
junction; ICD-O-3 codes 19.9, 20.9). For the purposes of this study, we considered
adenocarcinoma histology (morphology codes 814_3, 84803, 84903, 82103, 82203, 82613),
which represents more than 98% of all CRCs. SEER program registries routinely collect data on
patient demographics, primary tumor site, tumor morphology and stage at diagnosis, and the
24
The SEER Program is viewed as the standard for quality among cancer registries with > 98%
case ascertainment.
Obesity
The prevalence of obesity was derived from NHANES phases I (1971-1975), II
(1976-1980), and III (1988-1994) and the continuous cycles (1999-2012). NHANES is the only study
that provides estimates on anthropometric measures for the U.S. population and has been used
by many researchers for more than 30 years. Data collection for NHANES consists of an initial
household interview, an in-home personal interview, and a standardized physical examination in
a specially equipped mobile examination center. The exam includes physical measurements, a
dental examination, and the collection of blood and urine samples for laboratory testing. All
NHANES participants are eligible for the body measures components of the exam. The
complete set of measurements includes weight, height, upper leg and arm length, mid-arm and
waist circumferences, and triceps and subscapular skinfolds. Obesity is measured as body
mass index (BMI) ≥ 30 kg/ m2.A trained health technologist and recorder work together to
collect the anthropometry data. Examinations are conducted in mobile exam centers, which
helps to standardize their administration. All data collection procedures are overseen by the
Centers for Disease Control and Prevention (CDC).
Physical Inactivity
Physical inactivity prevalence was derived from BRFSS survey data from years
1984-2010. Survey data are publicly available and have been reported in numerous publications.
Assessing physical activity over time is difficult because guideline-based recommendations
have changed in the U.S. Prior to 1985, recommendations called for vigorous intensity exercise
for at least 3 times/week for at least 20 minutes.83 A new recommendation84 was issued in 1995
25
intensity physical activity, which could be accumulated over the course of the day, almost daily.
The recommendation was meant to provide a choice for less intense kinds of activities, and it
heightened awareness of what could be considered physical activity (e.g., gardening, yardwork).
Although our understanding of vigorous activity has changed over time, the definition of physical
inactivity has remained relatively constant. BRFSS provides a consistent measure of physical
inactivity across all survey years, defined as no leisure-time activity or exercise in the last 30
days. Data from BRFSS are preferable to other national surveys (e.g., NHIS), where physical
activity and exercise have been assessed with a variety of questions and in different survey
years, precluding meaningful comparisons over time. BRFSS data collection procedures are
overseen by the CDC. Surveys are administrated continuously through the year by state health
departments via random digit dialing. Starting in 2011, BRFSS changed weighting methodology
and included cell phone only respondents in the sampling frame; data from 2011 forward are not
directly comparable to previous years of BRFSS data. Therefore, we used 2010 data as the
estimate for the prevalence of physical activity during the corresponding 2010-2012 period.
Current Smoking
We obtained the prevalence of current smoking from the NHIS in years 1974,
1976-1980, 1983, 1985, 1987-1988, 1990-1995, and 1997-2012. NHIS is regarded as the primary
data source for tracking progress toward achieving national health objectives. Adult tobacco use
was first measured on the NHIS as part of the 1965 smoking supplement and has been included
annually in the adult health behaviors section of NHIS since 1997. The basic NHIS cigarette
smoking questions consist of a screener question, “Have you ever smoked at least 100
cigarettes in your entire life?” and follow-up questions about current smoking practices.
Although follow-up questions have varied slightly across survey years (e.g., from “Do you
smoke now?” to “Do you smoke every day, some days, or not at all?”), the same smoking status
26
(including both every day smoker and some day smoker), former, or never smokers. NHIS data
are collected through personal household interviews conducted by interviewers employed and
trained by the U.S. Census Bureau. The CDC oversees all data collection procedures.
Statistical Analysis
We specified Poisson CCREM using multilevel data described above. CCREM are a
type of hierarchical age-period-cohort (HAPC) models that estimate independent age effects
(i.e., distribution of the outcome across the life course due to aging), period effects (i.e., secular
trends in the prevalence of an outcome that occur in all ages), and cohort effects (i.e., variation
in the outcome among those born in or around the same year). HAPC models avoid the
identification problem85 of linear APC regression models (i.e., age, period, and cohort are
perfectly collinear) because the three effects (age, period, cohort) are not assumed to be linear
and additive at the same level of analysis.86,87 By pooling SEER incidence data, we created a
rectangular age by period array where columns correspond to age-specific incidence rates in
each period, and rows are age-specific incidence rates across all periods (Figure 3.1). Linking
the diagonal cells of the array gives incidence rates that belong to individuals born in the same
calendar year and age together (i.e., birth cohort). Although only a longitudinal panel study
design provides data from true birth cohorts that follow identical individuals over time, this
design allowed for a synthetic cohort approach, used often in demography research.85 The
synthetic cohort approach has the advantage of simultaneously testing age and period effects
because it is based on nationally representative data (e.g., SEER) collected regularly from one
period to the next and covers several decades.
HAPC-CCREM is a member of the class of linear mixed models, and is the most widely
used form of hierarchical or multivariable linear models.88 Linear mixed models consist of two
components: the level 1 component is a regression of an individual-level outcome variable on a
27
coefficients, and an individual-level random error term. The level 2 component uses level 1
regression coefficients as outcomes and contains intercepts and specification of random effect
coefficients for the effects of each cohort and time period distinguished in the model.81
Level 1 component: log(yijk) = β0jk + β1AGEijk + β2AGE2ijk + β3SEXijk + β4RACEijk + eijk
with eijk ~ N (0, σ2)
Level 2 component: β0jk = ϒ0 + c0j + p0k
with c0j ~ N (0, Τc), p0k ~ N (0, Τk)
Combined model: log(yijk) = ϒ0 + β1AGEijk + β2AGE2ijk + β3SEXijk + β4RACEijk + c0j + p0k + eijk
where: i = 1,2,…,njk incidence rates within cohort j and period k;
j = 1,…,13 birth cohorts;
k = 1,…,9 time periods
The combined model is defined by the statistical parameters: the regression coefficients,
ϒ0, β1, β2, β3, and β4, and the variance components, σ2, Τc, and Τk. Regression coefficients are
interpreted similarly as in Poisson regression, where a one unit change in the predictor variable
corresponds to the expected change in the difference in the logs of expected counts by the
respective regression coefficient, given all other variables in the model are held constant.
Variance components are interpreted as the period or cohort effect, or the contribution of cohort
j and period k averaged over all periods and cohorts, respectively. We used restricted maximum
likelihood (REML) to estimate parameters. REML is preferable to other methods (e.g., maximum
likelihood (ML)), particularly for estimating variance, because it takes into account the loss of
degrees of freedom that result from first estimating regression parameters. ML estimators for
variance components have a downward bias, but REML estimators do not.
To test the hypothesis that lifestyle-related modifiable risk factors have paralleled the
28
current smoking prevalence across all ages for four sex-race groups (white males, white
females, black males, black females) for corresponding NHANES, BRFSS, and NHIS periods of
data collection, respectively. Prevalence by cohort was derived by averaging age-specific
prevalence for the same four sex-race groups across the relevant time periods. Because no
NHANES data were available in certain years, we interpolated obesity prevalence by averaging
the prevalence for the previous and subsequent periods and/or cohorts. Physical activity was
not measured in BRFSS prior to 1984; therefore, the analysis of physical inactivity was limited to
years 1984-2012. This approach allowed us to quantify the extent to which these modifiable risk
factors parallel the increasing incidence of young-onset CRC.
Sensitivity Analysis
To account for the possibility that incidence of young-onset CRC increases linearly with
BMI (vs. threshold effect of BMI ≥30), we also calculated period- and cohort-specific mean and
median BMI.
Sample Size and Power
The primary purpose of Specific Aim 2 was to determine the contribution of age, time
period, and birth cohort on the increasing incidence of young-onset CRC using CCREM
specification of HAPC models. CCREM have only recently emerged as a type of APC analysis,
and there is no established or formal method for calculating statistical power. However, the
CCREM approach is an improvement over linear APC models because it allows researchers to
identify key explanatory factors in addition to age, period, and cohort indicators. We estimated
there would be 378,000 total patients diagnosed with stages I-IV CRC in SEER 9 registries from
1973-2012, with approximately 30,000 cases in patients age <50 years (Table 3.1). Therefore,
29
C. SPECIFIC AIM 3 APPROACH
Study Design
In Specific Aim 3, we characterized the patterns of colonoscopy use in younger adults by
analyzing administrative claims of employer-insured adults in the MarketScan Commercial
Claims and Encounters data (MarketScan; Truven Health Analytics, Ann Arbor, MI). Using a
cohort design based on extant data allowed us to efficiently obtain a large sample size and
address our research question. Because current guidelines do not recommend routine
colonoscopy for individuals age <50 years, the prevalence of colonoscopy use in a younger
population was likely to be low (~5%). A claims-based analysis yielded a large enough cohort to
determine use of a relatively uncommon procedure. Further, colonoscopy is accurately reported
in claims data because it is an expensive procedure. Although follow-up information was
available at the study outset, MarketScan collected all claims prospectively
Study Population
The study population was derived from individuals with health care claims in
MarketScan, a large employer-based claims database. MarketScan contains more than 500
million claim records on person-specific clinical utilization, expenditures, and enrollment across
inpatient and outpatient services from approximately 100 payors (Table 3.1). We identified
individuals aged 18-49 years during the period 2001-2013 (i.e., the most recent release of
MarketScan data) using electronic administrative records. There is no diagnosis code or
administrative algorithm to determine the presence of inherited cancer syndromes (e.g., Lynch
syndrome). As a result, we could not reasonably exclude younger adults who are recommended
to undergo colonoscopy (i.e., those at higher risk or with a family history), but we anticipated the
proportion of these patients to be minimal and constant across study years.13,14 Patients
30
cannot be generalized to uninsured patients or those without access to endoscopy services.
However, MarketScan is preferred to other claims data because data are fully integrated
(inpatient, outpatient, enrollment) at the patient-level, represent all ages (i.e., compared to
Medicare claims which only cover age ≥ 65), and are not limited to a single payer or geographic
region.
Covariate Assessment
Any colonoscopy delivered in the outpatient setting was identified from administrative
claims in the outpatient services table in MarketScan. Colonoscopy use was identified with
International Classification of Diseases, Ninth Revision, Clinical Modification (ICD-9-CM)
procedure codes and Common Procedural Terminology (CPT) codes. Several validation studies
of administrative claims data support the use ICD-9-CM and CPT codes for estimating
colonoscopy utilization, with specificity of 72-76% and sensitivity of 70-83%. Higher sensitivity is
considered the most important measure of validity when describing ascertainment of a
procedure in administrative data.89 El-Serag and colleagues90 developed an algorithm and
applied it to several decades of national Veterans Health Administration (VHA) administrative
data to evaluate trends in colonoscopy utilization, which is widely used in health services
research of endoscopy procedures. The algorithm was later modified to include parameters
(e.g., other administrative data such as ICD-9 diagnosis codes) to determine why a colonoscopy
was performed, with 83% sensitivity and 76% specificity for colonoscopy indication.91 ICD-9-CM
and CPT codes used to identify colonoscopy are listed in Table 3.4.
Statistical Analysis
To test the hypothesis that colonoscopy use has increased over time, we estimated the
rate of colonoscopy in each calendar year (2001-2013). We summed the total number of
31
patients who were enrolled in their insurance plan for 8 months in the year 2001 (January 1,
2001 to December 31, 2001) contributed 8 months of “enrollee-time” during that year. Patient
enrollee-time was counted in each calendar year without regard to enrollment in previous or
subsequent years (i.e., patients could contribute enrollee-time across all calendar years.) Using
standardized denominators of enrollee-time is a reasonable approach because our primary goal
was to estimate change in colonoscopy use by year.
We also examined differences in the rate of colonoscopy use (overall and in calendar
study year) by sex (male, female), age (18-29 years, 30-39 years, 40-49 years), and geographic
region (northeast, north central, west, south). We did not examine the indication for colonoscopy
because our primary interest was in understanding CRC incidence trends (i.e., a colonoscopy
would detect cancer regardless of why it was performed).
Sample Size and Power
The primary purpose of Specific Aim 3 was to determine increases in the use of
colonoscopy across study years (2001-2013). Given the expected low prevalence of
colonoscopy in patients age <50 years, we assumed that a minimum of 1% absolute difference
per year was meaningful to detect. We set the level of significance at 5% for a 2-sided test of all
hypotheses. The estimated sample size of 7,000,000 continuously-enrolled adults ages 18-49
years (see Table 3.1) provided >99% power to detect a1% increase in colonoscopy use per
32
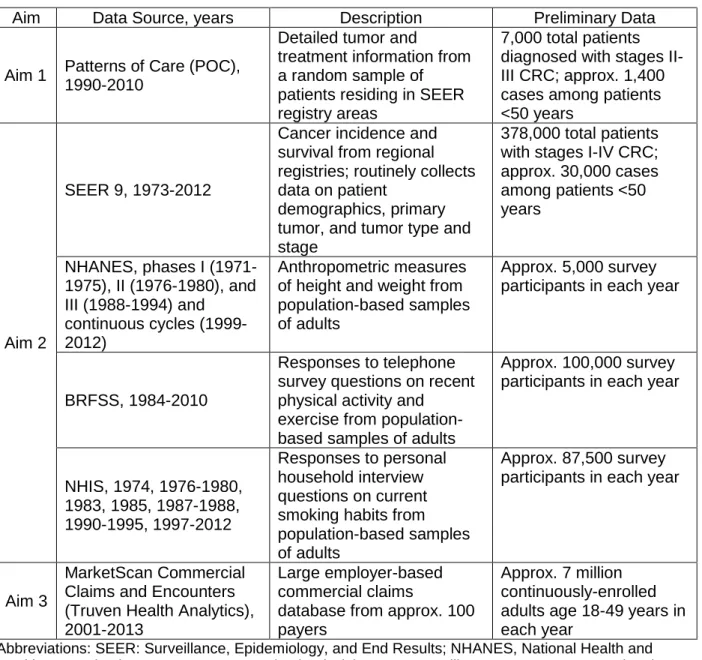
Table 3.1: Data source, description, and preliminary data by study aim
Aim Data Source, years Description Preliminary Data
Aim 1 Patterns of Care (POC),
1990-2010
Detailed tumor and
treatment information from a random sample of patients residing in SEER registry areas
7,000 total patients diagnosed with stages II-III CRC; approx. 1,400 cases among patients <50 years
Aim 2
SEER 9, 1973-2012
Cancer incidence and survival from regional registries; routinely collects data on patient
demographics, primary tumor, and tumor type and stage
378,000 total patients with stages I-IV CRC; approx. 30,000 cases among patients <50 years
NHANES, phases I (1971-1975), II (1976-1980), and III (1988-1994) and
continuous cycles (1999-2012)
Anthropometric measures of height and weight from population-based samples of adults
Approx. 5,000 survey participants in each year
BRFSS, 1984-2010
Responses to telephone survey questions on recent physical activity and
exercise from population-based samples of adults
Approx. 100,000 survey participants in each year
NHIS, 1974, 1976-1980, 1983, 1985, 1987-1988, 1990-1995, 1997-2012
Responses to personal household interview questions on current smoking habits from population-based samples of adults
Approx. 87,500 survey participants in each year
Aim 3
MarketScan Commercial Claims and Encounters (Truven Health Analytics), 2001-2013
Large employer-based commercial claims
database from approx. 100 payers
Approx. 7 million continuously-enrolled adults age 18-49 years in each year