Dynamic patterns of expression for genes
regulating cytokinin metabolism and signaling
during rice inflorescence development
Maria V. Yamburenko1, Joseph J. Kieber2, G. Eric Schaller1*
1 Department of Biological Sciences, Dartmouth College, Hanover, New Hampshire, United States of America, 2 Department of Biology, University of North Carolina, Chapel Hill, North Carolina, United States of America
Abstract
Inflorescence development in cereals, including such important crops as rice, maize, and wheat, directly affects grain number and size and is a key determinant of yield. Cytokinin regulates meristem size and activity and, as a result, has profound effects on inflorescence development and architecture. To clarify the role of cytokinin action in inflorescence devel-opment, we used the NanoString nCounter system to analyze gene expression in the early stages of rice panicle development, focusing on 67 genes involved in cytokinin biosynthesis, degradation, and signaling. Results point toward key members of these gene families involved in panicle development and indicate that the expression of many genes involved in cytokinin action differs between the panicle and vegetative tissues. Dynamic patterns of gene expression suggest that subnetworks mediate cytokinin action during different stages of panicle development. The variation of expression during panicle development is greater among genes encoding proteins involved in cytokinin metabolism and negative regulators of the pathway than for the genes in the primary response pathway. These results provide insight into the expression patterns of genes involved in cytokinin action during inflores-cence development in a crop of agricultural importance, with relevance to similar processes in other monocots. The identification of subnetworks of genes expressed at different stages of early panicle development suggests that manipulation of their expression could have sub-stantial effects on inflorescence architecture.
Introduction
Inflorescence development in cereals, including such important crops as rice, maize, and wheat, directly affects the number and size of seeds and is a key determinant of yield [1–3]. The final architecture of the inflorescence is established early in reproductive development based on meristematic activities that establish the branching pattern as well as the positioning of flowers. The rice inflorescence (panicle) consists of a central stem (rachis) with several pri-mary and secondary branches [4,5]. The primary and secondary branches produce spikelets,
a1111111111 a1111111111 a1111111111 a1111111111 a1111111111 OPEN ACCESS
Citation: Yamburenko MV, Kieber JJ, Schaller GE (2017) Dynamic patterns of expression for genes regulating cytokinin metabolism and signaling during rice inflorescence development. PLoS ONE 12(4): e0176060.https://doi.org/10.1371/journal. pone.0176060
Editor: Mukesh Jain, Jawaharlal Nehru University, INDIA
Received: January 28, 2017
Accepted: April 4, 2017
Published: April 18, 2017
Copyright:©2017 Yamburenko et al. This is an open access article distributed under the terms of theCreative Commons Attribution License, which permits unrestricted use, distribution, and reproduction in any medium, provided the original author and source are credited.
Data Availability Statement: The datasets supporting the conclusions of this article are included within the article and its additional files.
Funding: This work was supported by the National Science Foundation Plant Genome Research Program award number IOS-1238051 to GES and JJK. The funder had no role in study design, data collection and analysis, decision to publish, or preparation of the manuscript.
each of which produces a single floret. The rice panicle architecture is established when the shoot apical meristem gives rise to a reproductive meristem that produces the inflorescence, which ultimately is the source of the grain. The branches are produced by the primary and sec-ondary branch meristems, the spikelets by spikelet meristems, and these then differentiate into the floral organs.
Cytokinin is a key regulator of meristem size and activity and, as a result, has profound effects on inflorescence development and architecture [1,6,7]. Cytokinin levels are con-trolled primarily through its metabolism, with the basic pathways for its biosynthesis and degradation having been elucidated [8–12]. The biosynthesis of cytokinin involves three key enzymes: isopentenyltransferase (IPT), cytochrome P450 enzyme CYP735A, and LONELY GUY (LOG) cytokinin riboside 5’ monophosphate phosphoribohydrolase. These act in sequence to add a prenyl group to theN6position of ADP/ATP, hydroxylate the isoprenoid side chain, and then activate the cytokinin by converting it to the free base form [8–10]. In contrast, cytokinin oxidase (CKX) degrades the active cytokinins, lowering their cellular level [8,12]. The cytokinin response in a tissue is also dependent on its sensitivity to the hor-mone, as determined by the relative expression of the elements that compose its signal trans-duction pathway. The initial pathway for cytokinin signal transtrans-duction is a multi-step phosphorelay that incorporates cytokinin receptors (HKs), histidine-containing phospho-transfer proteins (AHPs), and type-B response regulators (RRs) [8,13–18]. These relay the cytokinin signal from the membrane to the nucleus, where the type-B RRs function as tran-scription factors to regulate gene expression. Type-A RRs are among the targets whose expression is induced by the type-B RRs, and these function as negative feedback regulators for the cytokinin response [8,19]. In rice, as in most plants, these signaling elements are encoded by multi-gene families, although lineage-specific expansion is found for many of these gene families based on phylogenetic analyses comparing monocots to dicots [13–15,
17]. Interestingly, rice has two classes of receptors. The major class, encoded by four genes, has the cytokinin-binding CHASE domain fused to a histidine kinase domain. In addition, rice has another putative cytokinin receptor in which the CHASE domain is fused to a Ser/ Thr kinase domain (CRL4/CHARK, referred to hereafter as CRL4), a receptor structure not found in Arabidopsis or other dicots [16,20].
Several genetic studies support the role of cytokinins in regulating development of the rice inflorescence. Disruption of theLOGgene, involved in cytokinin biosynthesis, results in a fail-ure to maintain meristematic cells in inflorescence meristems, and hence a smaller panicle [11,
21,22]. Second, through QTL analysis, it was found that the higher yield of theindicarice vari-eties compared tojaponicawas due to reduced expression of the cytokinin oxidase gene
OsCKX2, a decrease in cytokinin degradation thereby resulting in a larger panicle [23,24]. More recently, a gene encoding an F-box protein (LARGER PANICLE) was identified in rice that, when mutated, results in larger panicles, likely due to decreased expression ofCKX2[25]. Thus, an increase in cytokinin levels results in an increase in reproductive organs, and conse-quently an increase in grain yield. Similarly, RNAi of riceAHPs results in the production of smaller panicles with reduced seed set, consistent with expression of cytokinin signaling path-way elements also affecting development of the rice inflorescence [26].
gene expression is dynamically regulated during early panicle development, the RNA-Seq study providing clear evidence that this is also the case for genes related to cytokinin action.
These prior studies are limited due the number of stages of panicle development examined and/or the sensitivity of the experimental approach, which only allowed for a subset of genes related to cytokinin action to be detected with significance. Here we address the regulation of cytokinin action during the early stages of rice panicle development by characterizing gene expression using the NanoString nCounter system [13,30,31], which allows for greater sensi-tivity and more accurate assessment of transcriptional changes than the methods previously employed. Results from our study identify significant differences in abundance as well as dynamic patterns in expression based on 67 probes targeted against genes involved in cytoki-nin biosynthesis, degradation, and signaling. These results also suggest that gene subnetworks mediate cytokinin action during different stages of panicle development, pointing to how manipulation of their expression can have differential effects on panicle architecture.
Materials and methods
Plant materials and growth conditions
Oryza sativassp.Japonicacv.Nipponbareseeds were grown in soil (1:1 Pro-mix BX Mycorrhi-zae and Profile Porous Ceramic Greens Grade) supplemented with water-soluble NPK fertil-izer (20-20-20; 2.9 g/L) and Fe fertilfertil-izer (Sprint 330; 0.48 g/L) in a green house maintained at 50–80% relative humidity at 30˚C during the day and 25˚C at night, using a 10 h light/14 h dark cycle.
Isolation of panicles during early stages of development
Plants were examined daily for panicle promotion by dissection and observation under a ste-reomicroscope (Leica MZ16) once tillering began. SAMs and early panicles were dissected as described in Furutani et al. (2006) [4]. Specimens were collected into RNAlater (Qiagen) solu-tion and stored at 4˚C for up to one week. Each sample consisting of 15–20 dissected SAMs or early panicles was placed in a 1.5-mL microfuge tube with a 3 mm metal bead, frozen in liquid nitrogen, and stored at -70˚C until processed for RNA extraction.
RNA isolation
Frozen panicle samples were ground with a tissue homogenizer (Mixer Mill 400, Retsch) with a 3 mm metal bead. Total RNA was extracted with the E.Z.N.A.1Plant RNA Kit (Omega Bio-tek) according to the manufacturer’s instructions but modified in that we used half the volume of resuspension buffer RB (250μl) due to the small sample weight. The RNA was eluted with 50μl of DEPC-treated water, with final RNA concentration varying from 20 to 300 ng/μL.
NanoString analysis
CodeSet content normalization. Negative background subtraction, positive control normaliza-tion and CodeSet normalizanormaliza-tion were done using geometric means of the corresponding con-trols. Clustering was performed by the bottom-up approach of hierarchical agglomerative clustering using a Euclidian distance metric with the distance between two clusters calculated as the mean distance between their elements (Average Linkage method), as provided with the software. Z-score transformation (centering and scaling) was employed for the heat maps to assist in visualizing expression changes. For comparison of panicle gene expression to that found in vegetative tissues, the original vegetative tissue data was reanalyzed using the same methods used for analysis of panicle tissue. All the reaction counts were within the linear dynamic range of the standard curve and all probes detected expression above the background cutoff. Raw data for the NanoString analysis is found inS1 Table. Statistical analyses were per-formed by using ANOVA with the Holm post-test (http://astatsa.com/OneWay_Anova_with_ TukeyHSD/).
Quantitative Real-Time PCR (qRT-PCR)
cDNA synthesis was performed with the iScript cDNA Synthesis Kit (BioRad), DNase treat-ment with DNA-free™DNA Removal Kit (Ambion), and qRT-PCR with qPCR iTaq™ Univer-sal SYBR1Green Supermix (BioRad), according to the manufacturer’s instructions. qRT-PCR reactions were performed in biological triplicate with technical replicates on the CFX384 Real-Time System (BioRad).ACT1was used as the control for qRT-PCR [32]. TheΔΔCt method was used to calculate relative gene expression (RQ) [33]. Primers used for qRT-PCR were:
ACT1 (5’-GGTATTGTGTTGGACTCTGG-3’and5’-CCGTTGTGGTGAATGAGTAA-3’),
LAX1 (5’-CCATCCACTACGTCAAGTTCCT-3’and5’-GTTCAGCTCAAGGGCCAGAT-3’),
FZP (5’-CACCAACTTCGTCTACACCCA-3’and5’-GTGACCGTACGAGCCAATGT-3’),
MADS3 (5’-GATGAACATGATGACCGATCT-3’and
5’-GTGTTCTCGATCCGCTTTAT-3’), LOG (5’-AACTGGTCGAGAGGGGCATA-3’and
5’-GGGCATCAAGGATTTCGGGA-3’), and RR11 (5’-TCCTCGGAGAATGTGCCAAC-3’and
5’-GTAGCACGCGGCTGAAGA-3’). Statistical analyses were performed by using the Student’s two-sample t-test or by using ANOVA with the Holm post-test (http://astatsa.com/OneWay_Anova_with_TukeyHSD/) as indicated.
Results
NanoString analysis of early rice panicle development
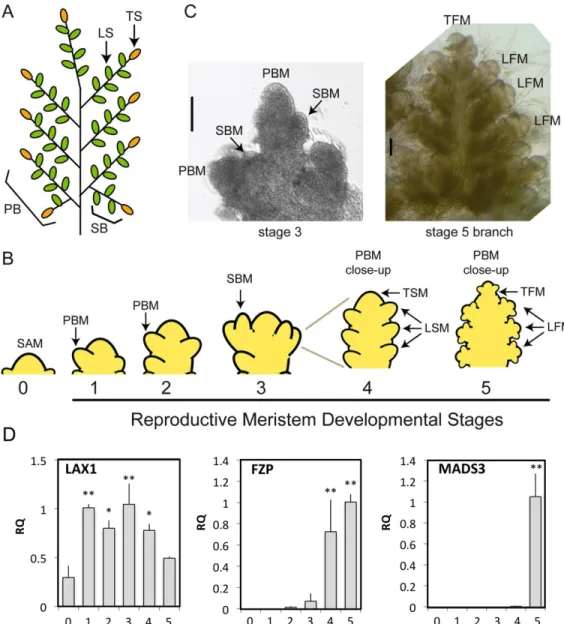
To characterize changes in gene expression related to the establishment of the rice panicle architecture, we isolated RNA from the vegetative phase and five early reproductive stages of inflorescence development as in Furutani et al., 2006 (Fig 1A–1C) [4]. Stage 0 (ST0) corre-sponds to the shoot apical meristem (SAM) just prior to the transition to panicle formation. Stages 1 through 5 are stages of reproductive development for the panicle. In ST1 and ST2, pri-mary branches are progressively initiated; in ST3, formation of secondary branches occurs; and in ST4, spikelet meristems are established, from which floret meristems then emerge in ST5. We examined expression of known panicle-specific genes in the samples to verify accu-racy of the sample collection. For this, we performed qRT-PCR using primers for theLAX1,
whereas expression of the floral organ identity geneMADS3occurs during ST5 with the appearance of stamen and carpel primordia [37].
We examined the regulation of cytokinin function in the developing rice inflorescence by characterizing gene expression using the NanoString nCounter system [30,31], which allows for greater sensitivity and more accurate assessment than the methods previously used. The NanoString system has a similar sensitivity to that found with quantitative reverse
Fig 1. Stages of early panicle development in rice. The rice panicle (A) has a defined architecture derived from the meristematic structure established early in inflorescence development (B, C), characterized by diagnostic changes in the gene expression pattern (D). (A) Panicle architecture. Representative primary branch (PB), secondary branch (SB), lateral and terminal spikelet (LS and TS) are labeled. (B) Developmental stages of the reproductive meristem, which produces primary branch meristems (PBM), secondary branch meristems (SBM), lateral and terminal spikelet meristems (LSM, TSM), which then give rise to floral meristems (LFM, TFM). (C) Light microscope images (scale bar = 100μm). (D) Diagnostic changes in gene expression occurring during early panicle development based on qRT-PCR using three biological replicates with reproductive stages as defined in (C). Statistical analysis performed by ANOVA with Holm post-test to compare stage 0 to stages 1–5 (*p<0.05,**p<0.01).
transcription (qRT)-PCR but with the benefit of being able to multiplex probes for many genes at the same time. Furthermore, NanoString analysis uses the RNA transcript sample directly, avoiding bias that can be introduced by cDNA synthesis and amplification, and allowing for quantitative expression comparison of all the genes represented in the probe set. We previously used this methodology to analyze the expression of genes involved in cytokinin biosynthesis, degradation, and signaling in the rice shoot and root [13], and used the same custom probe set for analysis of expression during early panicle development.
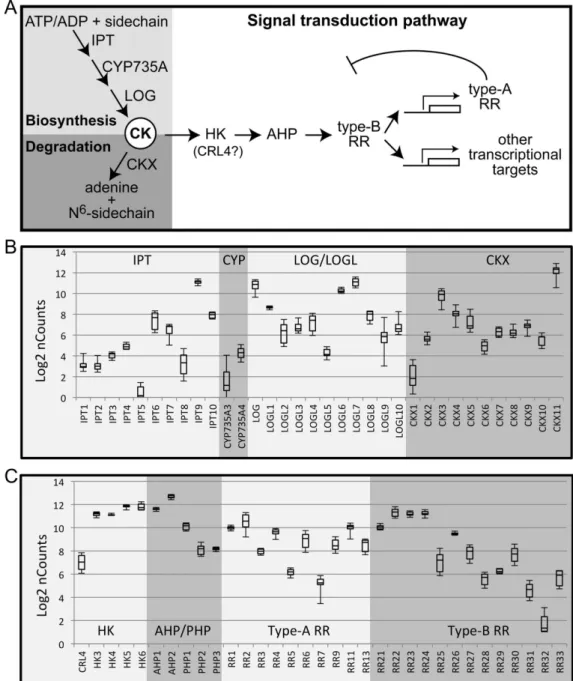
In the NanoString probe set, cytokinin biosynthesis genes are represented by ten isopentenyl transferases (IPTs;IPT1-IPT8involved in cytokinin biosynthesis;IPT9andIPT10likely serving as tRNA-IPTs), two cytochrome P450 monooxygenases (CYP735A), and elevenLONELY GUY/
LOG LIKE(LOG/LOGL) genes (Fig 2A). There are eleven probes for cytokinin oxidase genes (CKXs) encoding cytokinin degradative enzymes. The set also contains probes for genes encod-ing elements of the cytokinin signal transduction pathway (Fig 2A), including the four cytoki-nin receptors with histidine-kinase domains (HKs), one receptor-like protein with a Ser/Thr kinase domain (CRL4), two phosphotransfer proteins (AHPs), three pseudo-phosphotransfer proteins (PHPs), ten type-A response regulators (type-ARRs), and thirteen type-B response regulators (type-BRRs) (Fig 2A). Note that there are thirteen type-ARRs, but due to high sequence similarity one probe detects bothRR9andRR10, and another probe detectsRR8,
RR12, andRR13. All other probes are specific for single genes. There are thus 67 probes targeted against 70 genes related to cytokinin action. We evaluated expression of these genes during the vegetative phase (ST0) and five early reproductive stages of inflorescence development (ST1-ST5) (Fig 1A–1C). Positive and negative control probes were used to generate a standard curve, and the data normalized to rice reference genes. All 67 probes related to cytokinin action detected target gene expression above background levels. As described in the following sections, results from the NanoString analysis demonstrate differences in overall expression levels, dynamic changes in expression, and subnetworks of genes based on their expression profiles.
Differences in expression levels for genes involved in cytokinin
metabolism
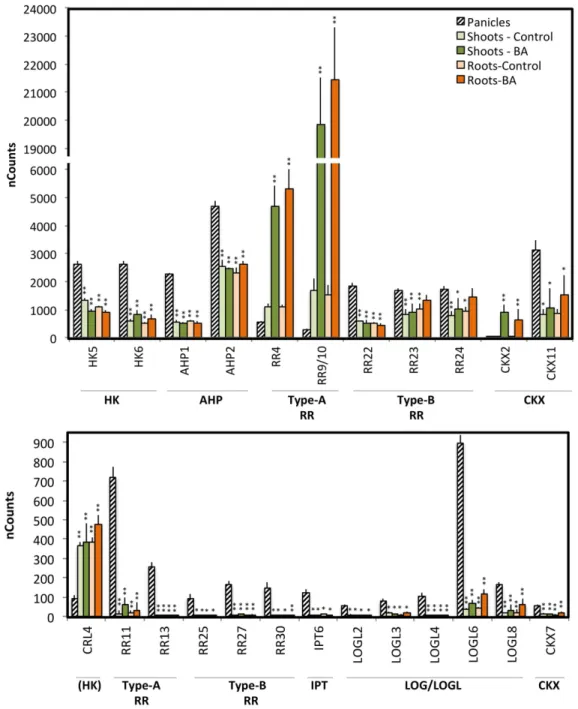
We used the NanoString dataset to compare expression levels of genes within the gene fami-lies, identifying the highly expressed genes that are likely to play a more significant role during panicle development. For this purpose, we generated box plots based on gene expression of cytokinin metabolic genes in stages ST0-5, with the box plots indicating the median and range of expression found during these stages (Fig 2B;S2 Table). Furthermore, to better understand the tissue-specific roles of the genes, we compared the median expression level from early pan-icles to the expression levels in rice roots and shoots, both basally and treated with the cytoki-nin benzyladecytoki-nine (BA) (Fig 3;S1 Fig;S3 Table) [13]. This comparison is enabled because no amplification steps are used during NanoString analysis and the same probe set was used for the earlier study involving rice shoots and roots.
Expression for most of theIPTgenes (six out of ten) and for the twoCYP735Agenes is low in panicles, but similar to that observed in vegetative tissues (Figs2Band3;S1 Fig).IPT6and
abundantIPTin vegetative tissues, with its expression in the panicle being substantially higher than that in shoots, but comparable to that in roots. The tRNA-IPTs (IPT9andIPT10) are the most abundantIPTs in panicle and vegetative tissues, but are expressed at higher levels in pan-icles than in vegetative tissues.
Fig 2. Differing expression levels of cytokinin-related genes in the early rice panicle based on NanoString analysis. (A) Genes involved in cytokinin metabolism and signaling. (B, C) Box plot analysis for expression of genes involved in cytokinin metabolism (B) and signaling (C) based on NanoString analysis. Expression was analyzed for stages 0–5 of early panicle development. The bottom and top of each box indicate the 25thand 75thpercentile for data expression values, the band in the middle of the box indicates the median
expression value, and the ends of the whiskers indicate the minimum and maximum values. Expression values for the box-plot analysis are log2transformed. All probes recognize single genes, except RR9 which also
recognizes RR10, and RR13 which also recognizes RR8 and RR12.
LOG,LOGL1,LOGL6, andLOGL7of theLOG/LOGLfamily exhibit the highest expression in the early panicles (Fig 2B).LOGL6transcripts are particularly enriched (about 25-fold) in panicle compared to vegetative tissues, the other threeLOG/LOGLgenes exhibiting similar transcript levels in panicle and vegetative tissues (Fig 3;S1 Fig). The other less-abundant
LOGLgenes exhibit significant differences in their expression in the early panicles compared to vegetative tissues. Four (LOGL2,LOGL3,LOGL4, andLOGL8) are expressed 4 to 20-fold
Fig 3. Differential expression of genes involved in cytokinin action between panicles and vegetative tissues. The average gene expression value during early panicle development was compared to that found in rice roots and shoots following treatment for 2 h with 5μM BA or a vehicle control [13]. Representative genes exhibiting significant differential expression in panicles compared to vegetative tissues are shown (ANOVA with Holm post-test,*p<0.05,**p<0.01).
higher in the panicle, whereas one (LOGL5) is expressed about 5-fold lower in the panicle. The
logmutant was originally identified in rice based on a screen for defects in shoot meristems, mutants exhibiting a reduction in panicle size, abnormal branching, and defects in flower development [11]. Loss of an abundant member of the LOG family likely contributes to the mutant defect, the presence of additional abundant family members potentially ameliorating the phenotype to some extent. In general, theIPTandLOGgenes are expressed at higher levels in the early panicle compared to the vegetative tissues, likely due to the significance of cytoki-nins to meristem maintenance and development which plays a key role in early panicle devel-opment [1,6,7].
Expression of the genes encoding proteins involved in cytokinin degradation is also high in the early panicle (Fig 2B).CKX11exhibits the highest expression level of the CKX family in the panicle as well as in vegetative tissues, butCKX11is expressed about three-fold higher in the panicle compared to vegetative tissues (Fig 3).CKX3is the next most abundant member of the
CKXfamily in the panicle (Fig 2B), its expression being similar to that in the vegetative tissues treated with cytokinin. Interestingly, expression ofCKX2(which accounts for the QTL associ-ated with yield due to its effects on panicle architecture [23,24]) is relatively low in the panicle compared to otherCKXfamily members (Fig 2B); expression is three-fold higher than basal level but substantially lower than that in cytokinin-treated shoots (Fig 3). Overall the high level ofCKXexpression would complement the high level of expression for biosynthesis genes and would facilitate rapid changes in cytokinin levels as needed for growth and development.
Differences in expression levels for genes involved in cytokinin signaling
The cytokinin signal transduction pathway involves three families of positive regulatory ele-ments (HKs, AHPs, and type-B RRs) (Fig 2A), and genes for these are highly expressed in early panicles consistent with the importance of cytokinin for the formation of panicle meri-stems (Figs2Cand3;S1 Fig;S2 Table). Of the fourHKs,HK5andHK6are expressed at the highest level with both being substantially elevated in the early panicle compared to vegetative tissues (Figs2Cand3;S1 Fig;S3 Table); transcript levels ofHK3andHK4are expressed at sim-ilar levels in panicle and vegetative tissue (S1 Fig).CRL4, which encodes the putative cytokinin receptor-like protein is expressed at a substantially lower level than the HKs in the panicle, and is also expressed at lower levels compared that found in vegetative tissues (Fig 2C). BothAHP1
andAHP2, which encode the two intermediary phosphotransfer proteins, are also expressed at substantially higher levels in the early panicle as compared to vegetative tissues (Figs2Cand
3). Of the 13 type-BRRs, which encode DNA-binding transcription factors that mediate the primary transcriptional response to cytokinin,RR21,RR22,RR23,RR24, andRR26are the most highly expressed family members in the panicle (Fig 2C). The three most abundant fam-ily members (RR22,RR23, andRR24) are all expressed at higher levels in panicles compared to vegetative tissues (Fig 3). In addition, among less abundant type-BRRs,RR25,RR27, andRR30
are more highly expressed in the panicles compared to vegetative tissue (Fig 3). Overall, expression of genes for the HK receptors, AHP phosphotransfer proteins, and type-B RRs that make up the initial signaling circuit is higher in the early panicle than in vegetative tissues.
Cytokinin signal transduction also involves negative regulatory elements (type-A RRs and PHPs) that can feed back and desensitize the pathway (Fig 2A). The type-A RRs are cytokinin primary response genes whose transcription is rapidly induced in response to the hormone [8,
tissue-specific roles for these genes (Figs2Cand3). The most abundant type-ARRs in the panicle are
RR1,RR2,RR4, andRR11(Fig 2C). Expression ofRR4andRR9/10is substantially lower in the panicle than the basal expression level in the vegetative tissues (Fig 3), of interest becauseRR4
andRR9/10are two of the most abundant type-ARRs in the vegetative tissues,RR9/10being the most abundant [13]. Transcript levels ofRR1andRR2are higher in the panicle than the basal level in the shoots, but lower than that observed following cytokinin treatment (Fig 3). Of particular interest,RR11andRR8/RR12/RR13are relatively abundant in the panicle but not in the vegetative tissues, being expressed at more than 40-fold higher levels in the panicle (Fig 3), suggesting that these type-ARRs may play a particular role in panicle development. The PHPs (pseudo-phosphotransfer proteins) lack a conserved phosphorylated histidine residue found in the AHPs, and interfere with AHP function to down-regulate cytokinin signal trans-duction [8,41,42]; genes for the threePHPs of rice are expressed at lower levels in the panicle than theAHPs, and similarly to their levels in vegetative tissues (Fig 2C;S1 Fig).
Dynamic patterns in gene expression during early panicle development
All 67 NanoString probes for cytokinin action detected expression for their targets above back-ground levels, with 65 doing so for all six stages of early panicle development (ST0-5), and the remaining two probes for five of the six stages, thereby providing an accurate assessment of changes in expression throughout this critical developmental process. Interestingly, develop-mental variation is greater among genes for cytokinin metabolism and the type-ARRs than for the genes in the primary signaling pathway (Fig 2B and 2C). This suggests the signal transduc-tion pathway is largely poised for cytokinin perceptransduc-tion, and that regulatransduc-tion is primarily through local changes in cytokinin levels coupled with negative feedback from the type-A RRs. For example, when considering the predominant family members making up the primary sig-naling pathway (fourHKs, twoAHPs, and five type-BRRs), the maximal fold-change for any of these during panicle development is 2-fold (Fig 2C). In contrast, the genes encoding biosyn-thetic enzymes vary substantially more: the twoCYP735As vary from 3.2 to 16.7-fold, the two predominant cytokinin-biosynthesisIPTs from 4.0–4.3-fold, and the four predominantLOG/ LOGLs from 1.3 to 3.2-fold. Among the cytokinin oxidases, the predominant two genes vary from 4.1 to 5.0-fold, and theCKX2associated with seed yield varies 2.3-fold. Among the type-ARRs, the most abundant four genes vary from 1.4 to 4.3-fold, includingARR11which varies 2.6-fold in the panicle. Also of potential significance is the variation in expression levels found for less abundant members of the genes for cytokinin biosynthesis, degradation, type-A RRs, as well as for the type-B RRs (Fig 2).
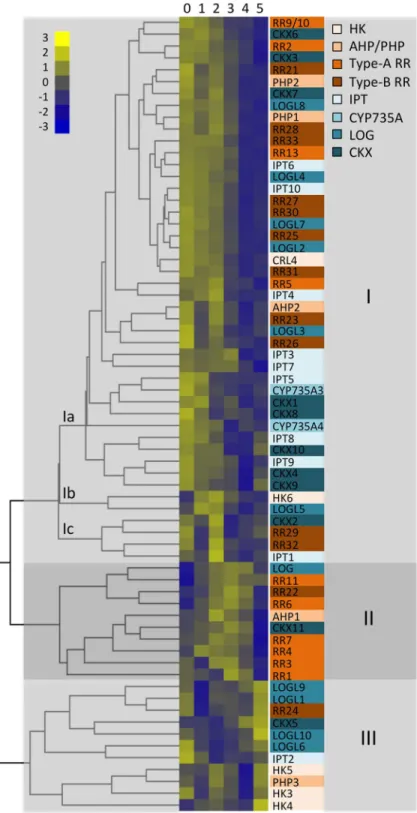
To reveal differential gene expression during the course of the early panicle development and to find co-regulated genes, we performed a clustering analysis based on Euclidian distance between gene expression at the different stages. This is plotted as a heat map with a dendro-gram and color-coded gene families for easier navigation inFig 4(heat maps for expression changes found within gene families can be found inS2 Fig). Genes are color-coded based on whether they are involved in cytokinin metabolism (blue) or signaling (orange), with differing shades for each of the families involved in these processes. This cluster analysis supports sub-networks of genes for cytokinin action involved in the establishment of panicle architecture, with three main groups exhibiting peak expression during ST0-ST2 (Group 1), ST2-ST4 (Group II), and ST5 (Group III) stages of panicle meristem development. These groups thus represent subnetworks derived from the total potential network of genes involved in the con-trol of cytokinin action.
Fig 4. Dynamic changes for expression of genes involved in cytokinin action during early panicle development. A cluster analysis was performed based on Euclidian distance between gene expression at stages 0–5 of early panicle development. This is plotted as a heat map with a dendrogram. Genes are color-coded based on whether they are involved in cytokinin metabolism (in blue) or signaling (in orange), with differing shades for each of the families involved in these processes. Genes fall into three major subfamilies (I, II, and III) based on the cluster analysis.
is the largest of the three groups, and is composed of three sub-groups (Ia, Ib, and Ic) (Fig 4). Group I includes the two most abundantIPTgenes (IPT6andIPT7), both tRNA-IPT genes (IPT9andIPT10), and one of the most abundantLOGLgenes (LOGL7), the differences in expression for all of these being significant when compared to later stages of panicle develop-ment.CKX3, one of the most abundantCKXs, as well asCKX4,CKX8, andCKX9, are all signif-icantly enriched members of Group I; the expression changes observed by NanoString with
CKX3are consistent with a prior RNA-Seq analysis whereCKX3was detected above back-ground (Fig 5) [29]. Although the more abundant genes for the primary signaling pathway do not exhibit the same variability for expression found with metabolism genes, some are signifi-cantly enriched members of group I. This includes theHK6, which is found in Subgroup Ic, which is characterized by having maximal expression at ST2 during primary branch meristem formation, an expression pattern we confirmed by qRT-PCR (Fig 5). Group I also includes the type-BRRs,RR21andRR25. Negative regulators of signaling are also found in Group I, which is significantly enriched for two type-ARRs (RR2andRR13) as well as the two most abundant
PHPs (PHP1andPHP2).
Group II is characterized by activation of gene expression at ST2 –ST4, stages at which the majority of branch and spikelet meristems are formed. This small group is enriched for the highly expressedLOGgene as well as forCKX11, the most abundant of the CKX family mem-ber in the early panicles, both patterns being confirmed by RNA-Seq (Fig 5A) [29]. Among genes involved in the signaling pathway, Group II is enriched for the abundant type-BRR,
RR22. However what is most striking, given the relatively small size of Group II, is the enrich-ment for type-ARRs, withRR4,RR6, andRR11all being significantly enriched, qRT-PCR results being consistent with theRR11enrichment (Fig 5B).
Group III genes are particularly high at ST5 when flower organ meristems emerge, some of these also being activated at ST0 in the SAM. With regards to cytokinin metabolism, Group III is particularly enriched for members of theLOGfamily, bothLOGL9andLOGL10being signif-icantly enriched, as well as forCKX5.
The gene for the abundant type-BRR24also trends higher during these later stages of devel-opment, consistent with prior RNA-Seq analysis (Fig 5) [29].
Discussion
To clarify the role of cytokinin action in inflorescence development, we used the NanoString nCounter system to analyze gene expression in the early stages of rice panicle development. Results from our study identify significant differences in abundance as well as dynamic changes in expression based on 67 probes targeted against genes involved in cytokinin biosyn-thesis, degradation, and signaling. These results also suggest that gene subnetworks, derived from the overall network of genes involved in cytokinin action, regulate different stages of pan-icle development, pointing to how manipulation of their expression can have differential effects on panicle architecture. As discussed below, results from our study complement and extend prior expression and genetic studies that implicate cytokinin action in the control of early panicle development.
Comparison of NanoString-derived data to prior expression studies
differentially regulated during the early panicle developmental stages by Furutani et al. (2006) [4]. The transcript level ofCKX5was enriched at ST4 and ST5, and that ofRR22was enriched at ST4, consistent with our NanoString analysis (Fig 4).
Recently, a more extensive dataset was acquired by laser microdissection of meristems from four stages of early panicle development with expression profiling by RNA-Seq [29]. Meristem types in the RNA-Seq dataset approximately correspond to the stages from ST1 to ST4. Rachis meristem (RM) corresponds to ST1; primary branch meristem (PBM) corresponds to ST2; elongated primary branch with axillary meristem (ePBM/AM) corresponds to ST3; spikelet meristem (SM) corresponds to ST4. Eighteen of the genes we investigated were above back-ground at the four stages in the RNA-Seq dataset and, even though the micro-dissection focused only on meristematic tissue, 11 of these exhibited a high positive correlation coeffi-cient (R from 0.57 to 0.90) when compared to our NanoString dataset. We plotted four genes
Fig 5. Confirmation of expression changes for representative genes during panicle development. NanoString expression data is compared to expression data derived from RNA-Seq (A) or qRT-PCR (B). Genes are from subfamilies I (CKX3, HK6), II (CKX11, LOG, RR11), and III (RR24), based on the cluster analysis (Fig 4). NanoString expression is given in normalized nCounts. The RNA-Seq dataset from panicle meristems [29] covers stages 1 through 4 of early development and is given in transcripts per million (TPM). qRT-PCR data is given as a relative gene expression (RQ) based on an actin control gene.
CKX3,CKX11,RR24, andHK6with particularly high R (higher than 0.86) relative to the Nano-String data (Fig 5A). These represent members of Groups I, II, and III, as defined by our clus-ter analysis, and thus further verify the NanoString data and the dynamic changes in
expression we observe during early panicle development.
Comparison of NanoString-derived data to prior genetic studies
Several genes involved in cytokinin action have been implicated in the control of panicle devel-opment based on genetic analysis. These includeLOGandCKX2, which were initially isolated based on their loss-of-function phenotypes [11,23]. Both of these are involved in cytokinin metabolism, and our data indicate that there is greater expression variability during develop-ment for such genes than for genes in the primary signaling pathway.LOGis one of the most abundant of theLOGfamily members for cytokinin biosynthesis in the early panicle based on NanoString analysis, and belongs to group II based on cluster analysis, its peak of expression in ST2-4 occurring when the majority of branch as well as spikelet meristems are formed.In situanalysis indicates thatLOGis expressed in SAM, primary and secondary branch meri-stems, and floral meristems [11]. The NanoString expression analysis is consistent with thelog
mutant phenotype, which is characterized by a severe reduction in panicle size, with decreased branching and decreased flower number [11]. We observe a decrease inLOGexpression dur-ing ST5, when floral organ primordia are formed;logmutants develop all types of floral organs but often exhibit a decrease in the number of the inner floral organs. We identifiedLOGL6and
LOGL7as having similar expression levels toLOG, suggesting that these too may play a signifi-cant role in regulating panicle development, although their differing dynamics suggests that they may not recapitulate theLOGmutant phenotype.
A second gene involved in cytokinin metabolism,CKX2, was identified as a major QTL (Gn1a) affecting grain yield [23].CKX2encodes a cytokinin oxidase and its reduced expression results in increased cytokinin levels [23], which correlates with increased grain yield per pani-cle. This inverse correlation betweenCKX2expression and grain yield has been observed based on natural variation between different rice strains or when CKX2 expression is specifi-cally down-regulated by RNAi or CRISPR-based approaches [23,43,44]. Interestingly, Nano-String analysis indicates thatCKX2is of medium abundance in early panicles within theCKX
family. This may allow for greater variation in its expression level without severely perturbing panicle development and, in this respect, it will be of interest to determine whether mutations in the more abundantCKXfamily members negatively affect panicle development. We find thatCKX2is a member of group Ic based on cluster analysis, with maximal expression during ST2 a major stage for primary branch formation, and thus the effects ofCKX2mutations on panicle size and yield are likely related in part to panicle branching.
Effects on panicle development have also been found by taking targeted approaches to modify the expression of cytokinin signaling elements, in particularAHPs and type-ARRs. The two riceAHPs are found in group Ia (AHP2) and II (AHP1) based on cluster analysis, but there is only limited variation of expression during the panicle stages and thus they can be con-sidered as expressed throughout panicle development.AHP2is the most highly expressed of the two family members. The role of theAHPs was examined by using RNAi with theAHP2
RR6, like many of the type-ARRs is a member of group II, and is most highly expressed during the stages when the branch meristems are formed. The type-A RRs are negative regula-tors and so ectopic overexpression ofRR6, as examined by Hirose et al. [45], would be pre-dicted to result in a greater level of negative regulation, and with this expanding to other stages of early panicle development. The mutant lines exhibited small panicles with reduced branch-ing, reduced spikelet number, and abnormal flowers that are sterile [45], consistent with defects throughout all stages of early panicle development.
Conclusion
The results obtained from the NanoString expression analysis provide insight into how genes involved in cytokinin action regulate inflorescence development in a crop of agricultural impor-tance, with relevance to similar processes in other monocots. The expression levels for many genes involved in cytokinin action differ between the panicle and vegetative tissues, suggestive of differing functional roles tailored to the specific needs of these tissues. Substantial differences in expression were identified among gene-family members, and these may point the way toward which genes play predominant roles in early panicle development. The identification of subnetworks of genes expressed at different stages of early panicle development points to how manipulation of their expression could have differential effects on inflorescence architecture.
Supporting information
S1 Fig. NanoString expression comparison of genes involved in cytokinin action between panicles and vegetative tissues. The average gene expression value during early panicle devel-opment was compared to that found in rice roots and shoots following treatment for 2 h with 5μM BA or a vehicle control.
(PDF)
S2 Fig. Dynamic changes for expression of gene family members involved in cytokinin action. A cluster analysis was performed based on Euclidian distance between gene expression at stages 0–5 of early panicle development. This is plotted as a heat map with a dendrogram for each family of genes.#Significant differences based on a T-Test between the two stages with maximum and minimum expression (P<0.05).Significant differences when comparing expression across all stages based on ANOVA with Holm post-test (P<0.05).
(PDF)
S1 Table. Raw NanoString expression data for genes involved in cytokinin action. (XLSX)
S2 Table. Normalized nCounts for gene expression during stages ST0-ST5 of early panicle development (LOG2 transformed).
(XLSX)
S3 Table. Comparison of gene expression between panicles, shoots, and roots based on NanoString analysis.
(XLSX)
Acknowledgments
Author Contributions
Conceptualization: GES JJK MVY.
Data curation: MVY.
Formal analysis: MVY GES.
Funding acquisition: GES JJK.
Investigation: MVY.
Methodology: MVY GES JJK.
Project administration: MVY GES JJK.
Supervision: GES JJK.
Validation: MVY GES.
Visualization: MVY GES.
Writing – original draft: MVY GES JJK.
References
1. Han Y, Yang H, Jiao Y. Regulation of inflorescence architecture by cytokinins. Front Plant Sci. 2014; 5:669.https://doi.org/10.3389/fpls.2014.00669PMID:25505480
2. Tanaka W, Pautler M, Jackson D, Hirano HY. Grass meristems II: inflorescence architecture, flower development and meristem fate. Plant Cell Physiol. 2013; 54(3):313–24.https://doi.org/10.1093/pcp/ pct016PMID:23378448
3. Kellogg EA, Camara PEAS, Rudall PJ, Ladd P, Malcomber ST, Whipple CJ, et al. Early inflorescence development in the grasses (Poaceae). Front Plant Sci. 2013; 4:250.https://doi.org/10.3389/fpls.2013. 00250PMID:23898335
4. Furutani I, Sukegawa S, Kyozuka J. Genome-wide analysis of spatial and temporal gene expression in rice panicle development. Plant J. 2006; 46(3):503–11.https://doi.org/10.1111/j.1365-313X.2006. 02703.xPMID:16623909
5. Itoh J, Nonomura K, Ikeda K, Yamaki S, Inukai Y, Yamagishi H, et al. Rice plant development: from zygote to spikelet. Plant Cell Physiol. 2005; 46(1):23–47.https://doi.org/10.1093/pcp/pci501PMID:
15659435
6. Azizi P, Rafii MY, Maziah M, Abdullah SN, Hanafi MM, Latif MA, et al. Understanding the shoot apical meristem regulation: a study of the phytohormones, auxin and cytokinin, in rice. Mechanisms of devel-opment. 2015; 135:1–15.https://doi.org/10.1016/j.mod.2014.11.001PMID:25447356
7. Jameson PE, Song J. Cytokinin: a key driver of seed yield. J Exp Bot. 2016; 67(3):593–606.https://doi. org/10.1093/jxb/erv461PMID:26525061
8. Kieber JJ, Schaller GE. Cytokinins. The Arabidopsis Book. 2014; 12:e0168.https://doi.org/10.1199/tab. 0168PMID:24465173
9. Kudo T, Kiba T, Sakakibara H. Metabolism and long-distance translocation of cytokinins. J Integr Plant Biol. 2010; 52(1):53–60. Epub 2010/01/16.https://doi.org/10.1111/j.1744-7909.2010.00898.xPMID:
20074140
10. Sakakibara H. Cytokinins: activity, biosynthesis, and translocation. Annu Rev Plant Biol. 2006; 57:431– 49. Epub 2006/05/04.https://doi.org/10.1146/annurev.arplant.57.032905.105231PMID:16669769
11. Kurakawa T, Ueda N, Maekawa M, Kobayashi K, Kojima M, Nagato Y, et al. Direct control of shoot meri-stem activity by a cytokinin-activating enzyme. Nature. 2007; 445(7128):652–5. Epub 2007/02/09.
https://doi.org/10.1038/nature05504PMID:17287810
12. Werner T, Kollmer I, Bartrina I, Holst K, Schmu¨lling T. New insights into the biology of cytokinin degra-dation. Plant Biol (Stuttg). 2006; 8:371–81.
14. Du L, Jiao F, Chu J, Jin G, Chen M, Wu P. The two-component signal system in rice (Oryza sativa L.): a genome-wide study of cytokinin signal perception and transduction. Genomics. 2007; 89(6):697–707. Epub 2007/04/06.https://doi.org/10.1016/j.ygeno.2007.02.001PMID:17408920
15. Pareek A, Singh A, Kumar M, Kushwaha HR, Lynn AM, Singla-Pareek SL. Whole genome analysis of
Oryza sativa L. reveals similar architecture of two-component-signaling-machinery with Arabidopsis.
Plant Physiol. 2006; 142:380–97.https://doi.org/10.1104/pp.106.086371PMID:16891544
16. Ito Y, Kurata N. Identification and characterization of cytokinin-signalling gene families in rice. Gene. 2006; 382:57–65.https://doi.org/10.1016/j.gene.2006.06.020PMID:16919402
17. Schaller GE, Doi K, Hwang I, Kieber JJ, Khurana JP, Kurata N, et al. Letter to the Editor: Nomenclature for two-component signaling elements of Oryza sativa. Plant Physiol. 2007; 143:555–7.
18. Werner T, Schmu¨lling T. Cytokinin action in plant development. Curr Opin Plant Biol. 2009; 12(5):527– 38. Epub 2009/09/11.https://doi.org/10.1016/j.pbi.2009.07.002PMID:19740698
19. To JP, Haberer G, Ferreira FJ, Deruere J, Mason MG, Schaller GE, et al. Type-A Arabidopsis response regulators are partially redundant negative regulators of cytokinin signaling. Plant Cell. 2004; 16 (3):658–71.https://doi.org/10.1105/tpc.018978PMID:14973166
20. Han QM, Jiang HW, Qi XP, Yu J, Wu P. A CHASE domain containing protein kinase OsCRL4, repre-sents a new AtCRE1-like gene family in rice. J Zhejiang Univ Sci. 2004; 5(6):629–33. PMID:15101094
21. Kuroha T, Tokunaga H, Kojima M, Ueda N, Ishida T, Nagawa S, et al. Functional analyses of LONELY GUY cytokinin-activating enzymes reveal the importance of the direct activation pathway in Arabidop-sis. Plant Cell. 2009; 21(10):3152–69.https://doi.org/10.1105/tpc.109.068676PMID:19837870
22. Gu B, Zhou T, Luo J, Liu H, Wang Y, Shangguan Y, et al. An-2 encodes a cytokinin synthesis enzyme that regulates awn length and grain production in rice. Mol Plant. 2015; 8(11):1635–50.https://doi.org/ 10.1016/j.molp.2015.08.001PMID:26283047
23. Ashikari M, Sakakibara H, Lin S, Yamamoto T, Takashi T, Nishimura A, et al. Cytokinin oxidase regu-lates rice grain production. Science. 2005; 309(5735):741–5.https://doi.org/10.1126/science.1113373
PMID:15976269
24. Yeh SY, Chen HW, Ng CY, Lin CY, Tseng TH, Li WH, et al. Down-Regulation of Cytokinin Oxidase 2 Expression Increases Tiller Number and Improves Rice Yield. Rice. 2015; 8(1):36.
25. Li M, Tang D, Wang K, Wu X, Lu L, Yu H, et al. Mutations in the F-box gene LARGER PANICLE improve the panicle architecture and enhance the grain yield in rice. Plant Biotechnol J. 2011. Epub 2011/03/31. 26. Sun L, Zhang Q, Wu J, Zhang L, Jiao X, Zhang S, et al. Two rice authentic histidine phosphotransfer
proteins, OsAHP1 and OsAHP2, mediate cytokinin signaling and stress responses in rice. Plant Phy-siol. 2014; 165(1):335–45. Epub 2014/03/01.https://doi.org/10.1104/pp.113.232629PMID:24578505
27. Jain M, Nijhawan A, Arora R, Agarwal P, Ray S, Sharma P, et al. F-box proteins in rice. Genome-wide analysis, classification, temporal and spatial gene expression during panicle and seed development, and regulation by light and abiotic stress. Plant Physiol. 2007; 143(4):1467–83.https://doi.org/10.1104/ pp.106.091900PMID:17293439
28. Jain M, Tyagi AK, Khurana JP. Differential gene expression of rice two-component signaling elements during reproductive development and regulation by abiotic stress. Funct Integr Genomics. 2008; 8 (2):175–80.https://doi.org/10.1007/s10142-007-0063-6PMID:17990013
29. Harrop TW, Ud Din I, Gregis V, Osnato M, Jouannic S, Adam H, et al. Gene expression profiling of reproductive meristem types in early rice inflorescences by laser microdissection. Plant J. 2016; 86 (1):75–88.https://doi.org/10.1111/tpj.13147PMID:26932536
30. Geiss GK, Bumgarner RE, Birditt B, Dahl T, Dowidar N, Dunaway DL, et al. Direct multiplexed measure-ment of gene expression with color-coded probe pairs. Nat Biotechnol. 2008; 26(3):317–25. Epub 2008/ 02/19.https://doi.org/10.1038/nbt1385PMID:18278033
31. Malkov VA, Serikawa KA, Balantac N, Watters J, Geiss G, Mashadi-Hossein A, et al. Multiplexed mea-surements of gene signatures in different analytes using the Nanostring nCounter Assay System. BMC Res Notes. 2009; 2:80. Epub 2009/05/12.https://doi.org/10.1186/1756-0500-2-80PMID:19426535
32. Caldana C, Scheible WR, Mueller-Roeber B, Ruzicic S. A quantitative RT-PCR platform for high-throughput expression profiling of 2500 rice transcription factors. Plant Methods. 2007; 3:7.https://doi. org/10.1186/1746-4811-3-7PMID:17559651
33. Schefe JH, Lehmann KE, Buschmann IR, Unger T, Funke-Kaiser H. Quantitative real-time RT-PCR data analysis: current concepts and the novel "gene expression’s CT difference" formula. J Mol Med (Berl). 2006; 84(11):901–10.
34. Komatsu K, Maekawa M, Ujiie S, Satake Y, Furutani I, Okamoto H, et al. LAX and SPA: major regula-tors of shoot branching in rice. Proc Natl Acad Sci U S A. 2003; 100(20):11765–70. Epub 2003/09/18.
35. Komatsu M, Maekawa M, Shimamoto K, Kyozuka J. The LAX1 and FRIZZY PANICLE 2 genes deter-mine the inflorescence architecture of rice by controlling rachis-branch and spikelet development. Dev Biol. 2001; 231(2):364–73. Epub 2001/03/10.https://doi.org/10.1006/dbio.2000.9988PMID:11237465
36. Komatsu M, Chujo A, Nagato Y, Shimamoto K, Kyozuka J. FRIZZY PANICLE is required to prevent the formation of axillary meristems and to establish floral meristem identity in rice spikelets. Development. 2003; 130(16):3841–50. Epub 2003/07/02. PMID:12835399
37. Kyozuka J, Kobayashi T, Morita M, Shimamoto K. Spatially and temporally regulated expression of rice MADS box genes with similarity to Arabidopsis class A, B and C genes. Plant Cell Physiol. 2000; 41:710–8. PMID:10945340
38. Sakamoto T, Sakakibara H, Kojima M, Yamamoto Y, Nagasaki H, Inukai Y, et al. Ectopic expression of KNOTTED1-like homeobox protein induces expression of cytokinin biosynthesis genes in rice. Plant Physiol. 2006; 142(1):54–62.https://doi.org/10.1104/pp.106.085811PMID:16861569
39. Brandstatter I, Kieber JJ. Two genes with similarity to bacterial response regulators are rapidly and spe-cifically induced by cytokinin in Arabidopsis. Plant Cell. 1998; 10:1009–19. PMID:9634588
40. Jain M, Tyagi AK, Khurana JP. Molecular characterization and differential expression of cytokinin-responsive type-A response regulators in rice (Oryza sativa). BMC Plant Biol. 2006; 6(1):1.
41. Ma¨ho¨nen AP, Bishopp A, Higuchi M, Nieminen KM, Kinoshita K, Tormakangas K, et al. Cytokinin signal-ing and its inhibitor AHP6 regulate cell fate dursignal-ing vascular development. Science. 2006; 311
(5757):94–8.https://doi.org/10.1126/science.1118875PMID:16400151
42. Bishopp A, Help H, El-Showk S, Weijers D, Scheres B, Friml J, et al. A mutually inhibitory interaction between auxin and cytokinin specifies vascular pattern in roots. Curr Biol. 2011; 21(11):917–26. Epub 2011/05/31.https://doi.org/10.1016/j.cub.2011.04.017PMID:21620702
43. Li M, Li X, Zhou Z, Wu P, Fang M, Pan X, et al. Reassessment of the four yield-related genes Gn1a, DEP1, GS3, and IPA1 in rice using a CRISPR/Cas9 System. Front Plant Sci. 2016; 7:377.https://doi. org/10.3389/fpls.2016.00377PMID:27066031
44. Wang J, Xu H, Li N, Fan F, Wang L, Zhu Y, et al. Artificial selection of Gn1a plays an important role in improving rice yields across different ecological regions. Rice. 2015; 8(1):37.https://doi.org/10.1186/ s12284-015-0071-4PMID:26677125