Enrichment of dynamic chromosomal crosslinks drive
phase separation of the nucleolus
Caitlin Hult
1, David Adalsteinsson
1, Paula A. Vasquez
2, Josh Lawrimore
3,4,
Maggie Bennett
3, Alyssa York
3, Diana Cook
3, Elaine Yeh
3, Mark Gregory Forest
1,5and
Kerry Bloom
3,*1Department of Mathematics, University of North Carolina at Chapel Hill, Chapel Hill, NC 27599, USA,2Department
of Mathematics, University of South Carolina, Columbia, SC 29808, USA,3Department of Biology, University of North Carolina at Chapel Hill, Chapel Hill, NC 27599, USA,4Curriculum of Genetics and Molecular Biology, University of North Carolina at Chapel Hill, Chapel Hill, NC 27599, USA and5Department of Applied Physical Sciences, University of North Carolina at Chapel Hill, Chapel Hill, NC 27599, USA
Received March 11, 2017; Revised August 07, 2017; Editorial Decision August 13, 2017; Accepted August 14, 2017
ABSTRACT
Regions of highly repetitive DNA, such as those found in the nucleolus, show a self-organization that is marked by spatial segregation and frequent self-interaction. The mechanisms that underlie the se-questration of these sub-domains are largely un-known. Using a stochastic, bead-spring representa-tion of chromatin in budding yeast, we find enrich-ment of protein-mediated, dynamic chromosomal cross-links recapitulates the segregation, morphol-ogy and self-interaction of the nucleolus. Rates and enrichment of dynamic crosslinking have profound consequences on domain morphology. Our model demonstrates the nucleolus is phase separated from other chromatin in the nucleus and predicts that mul-tiple rDNA loci will form a single nucleolus indepen-dent of their location within the genome. Fluores-cent labeling of budding yeast nucleoli with CDC14-GFP revealed that a split rDNA locus indeed forms a single nucleolus. We propose that nuclear sub-domains, such as the nucleolus, result from phase separations within the nucleus, which are driven by the enrichment of protein-mediated, dynamic chro-mosomal crosslinks.
INTRODUCTION
The eukaryotic nucleus is a complex three-dimensional (3D) environment in which genome function depends not only on the linear arrangement of regulatory sequence elements but also on their spatial organization for effective control of gene expression and nucleic acid metabolism (1–3). The spatial organization is in constant flux; individual genes can
reposition within the nucleus in response to environmental or developmental cues and the genome can be mobilized in times of genotoxic stress (4–6). The nucleus is composed of a variety of sub-domains or different compartments, each of them with a distinct structure and function. The mecha-nisms by which sub-nuclear compartments are formed and maintained as well as what determines their composition, size, shape and number at various stages of the cell cycle re-main largely unknown. Integration of current advances in microscopy, chromosome engineering, theory and compu-tation enables exploration and validation of the statistical mechanical underpinnings that account for formation and maintenance of different sub-nuclear compartments.
In this paper, we investigate the dynamic organization of the nucleolus, the site of ribosomal RNA synthesis, within the nucleus of budding yeast. The nucleolus is composed of repeated DNA sequences and, as a result, is often not included in large-scale sequencing or chromosome confor-mation studies (7). The nucleolus can readily be identified as an approximately crescent-shaped structure adjacent to the nuclear envelope and typically opposed to the spindle pole body in G1 stage of the cell cycle (8,9). In addition to housing the ribosomal DNA (rDNA), the nucleolus is a reservoir for cell-cycle regulatory factors such as FEAR and MEN. Upon anaphase onset, several of the regulatory pro-teins are modified and released from the nucleolus to carry out anaphase. In this study, we focus on rDNA in G1 cells to reduce complexity introduced with building an intranu-clear spindle in metaphase. In yeast, rDNA is found in arm 2 of chromosome XII. Albertet al. (10) performed a com-prehensive investigation of this chromosome and found that the dynamics of non-rDNA loci consistently followed those of homogeneous, tethered polymer chains. In contrast, the dynamics of the rDNA loci showed a distinctive deviation from such behavior; namely, larger separation with respect to the nuclear center and slower movement. In agreement
*To whom correspondence should be addressed. Tel: +1 919 962 1182; Fax: +1 919 962 1625; Email: Kerry [email protected]
C
The Author(s) 2017. Published by Oxford University Press on behalf of Nucleic Acids Research.
with these results, Wonget al. (7,11) used polymer models to simulate chromosome XII as a heteropolymer assigning a 10×larger size to the rDNA segments of the chain. This size was used so that the resulting nucleolus occupied roughly one-third of the nuclear volume. Using this minimalistic dynamic model the authors were able to explain a large set of quantitative data reported on yeast nuclear archi-tecture including locus positions, contact frequencies and motion characteristics (11). Although the nucleolus plays a unique role in the organization of the nuclear architec-ture, to our knowledge no other modeling efforts have in-cluded its dynamics in an explicit manner. Few exceptions remain, where the nucleolus is included as a topological constraint within the computational domain (12–14). How-ever, in these works the nucleolus was assumed to be static and uniform.
Stochastic simulations of entropy-driven, bead-spring polymer chain models account for many features of the dy-namic properties of chromatin fibers confined within the yeast nucleus (15–19). In this study, we explore key param-eters that endow a sub-domain of the genome with charac-teristics that define the nucleolus. As discussed above, previ-ous work has modeled the nucleolus as a chain of increased diameter (11). This approach provides a physical basis for chain thickening and manifests experimental findings. Here, we take a different approach and introduce crosslinking within or between chains representing chromatin interac-tions with structural maintenance of chromosomes (SMC) proteins or with a high mobility group protein, HMO1 in-volved in rDNA transcriptional regulation within the nu-cleolus (20,21). The model herein is fully reflective of ex-perimentally based, biological parameters including chro-mosomal DNA properties, nuclear confinement, tethering of chromosome arms to the centromere and telomere sites, and the relative lengths of all 32 chromosome arms (16 chro-mosomes, 32 arms roughly meta-centric). We translate sim-ulated data from the 3D computational models into equiv-alent microscope images, to view and analyze experimental images obtained from live cell microscopy. Through these visualization tools and comparison of simulation results and experimental data, we report the statistical mechan-ics sufficient to account for nucleolar dynammechan-ics and con-formation due to molecular mechanisms (protein-mediated crosslinking kinetics) that are beyond current experimental resolution.
MATERIALS AND METHODS
Strains and imaging
Budding yeast strains EMS219 (Mat alpha, his5 leu2– 3,212 ura3–50 CAN1 asp5 gal2 (form I1 rDNA::leu2 URA3+)), intact rDNA and EMS60-UVR-12 (LEU2+, URA3+ CANS form I1 rDNA), translocated rDNA (22), were transformed with CDC14-GFP:KAN to label the nu-cleolus to generate DCY1021.1 and DCY1017.2, respec-tively. DCY1021.1 was transformed using pS01 plasmid to introduce the brn1–9 allele into strain AY1009. DCY1021.1 was transformed to knockout Fob1 and Hmo1 in strains DCY1055.1 and DCY1056.1, respectively. Cells were grown in YPD (1% Yeast extract, 2% Bacto-peptone, 2% Dextrose) with excess adenine. Strains were grown until mid-log phase
prior to imaging. Images were acquired at room tempera-ture for wild-type (WT), fob1and hmo1mutant strains (25◦C). brn1–9 strains were shifted to 37◦C 3 h prior to im-age analysis. G1 cells were found in the population by vi-sual inspection of bud size. Images were acquired using a Ti-Eclipse inverted microscope (Nikon) with a 100×Plan Apo 1.4 NA objective (Nikon) and Clara CCD digital camera (Andor) using MetaMorph 7.7 imaging software (Molec-ular Devices). Single stacks contained 7 Z-planes sections with 300 nm step-size. Image stacks were cropped and max-imum intensity projections were created using ImageJ.
Image analysis
Image stacks of single cells were imported into MAT-LAB using bfopen.m function from the MATMAT-LAB Tool-box of the Bio-Formats program suite from the down-loads page of the Open Microscopy Environment (http:// downloads.openmicroscopy.org/bio-formats/5.5.1/) (23). A custom MATLAB function, mdx multi thresh.m, con-verted the image stack to a maximum intensity projection, padded the image to 200×200 pixels with minimum pixel intensity and normalized the image intensities such that minimum intensity is set to 0 and maximum intensity is set to 1. A gradually increasing threshold (0 to 1 using 0.01 in-crements) was applied to the image, such that intensity val-ues below the threshold were not included in later calcula-tions. At each threshold, the variance of the normalized in-tensities above the threshold and the normalized area (area of pixels above threshold divided by area total image) was calculated. The mean and S.E.M. of the variances and ar-eas at each threshold was calculated from all cells of a given genotype. The same analysis was performed on simulated images using the MATLAB function dt cmyk mmt.m.
Modeling approach
The observed motion of chromatin loci is consistent with those of highly flexible polymers. As a consequence, poly-mer models have proved valuable in the understanding of chromatin dynamics (14,16–19,24–30). In our approach, chromosome chains are modeled using a bead-spring poly-mer model where each arm is represented by interacting beads connected via springs following a worm-like chain (WLC) force law (31,32). Each chain is tethered at both the ends representing the tethering of the telomeres to the nu-clear membrane and the centromeres to the spindle pole body. This tethering resembles the Rabl configuration ob-served experimentally (26,33–36). In addition to tethering, chains are confined within the nuclear domain represented by a sphere of radius 1m; both constraints reflectin vivo
observations of yeast chromosomes (18,36).
The basis of the model is a balance of forces acting on each bead,
FiD+FiS+FiEV+FWi +FiB=0. (1)
The forces considered in our model are the drag forceFiD
opposing the movement of the bead; the spring forceFiS
ensures that beads remain within the spherical domain and that beads corresponding to centromere and telomere sites remain fixed to the domain wall; and the Brownian forceFiB
that captures the random motion of the beads due to ther-mal fluctuations. For details of the functional form of these forces and the model parameters, we refer the reader to (17).
Nucleolus modeling
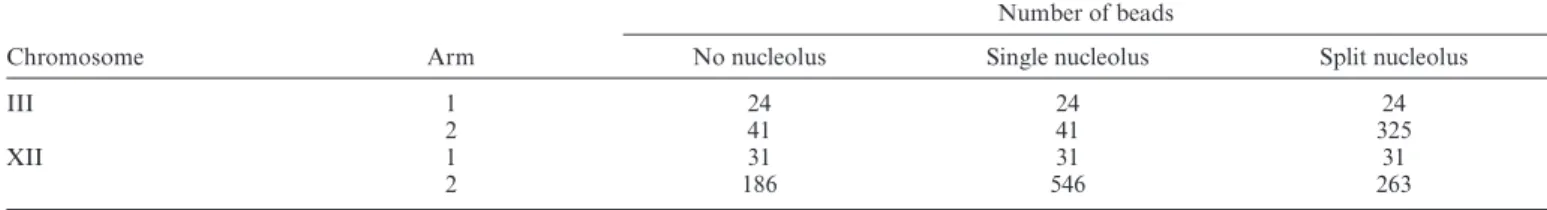
The discretization in our model corresponds to 5 kb of DNA per spring. The total number of beads composing each chromosome arm are determined based on this dis-cretization; for specific numbers see (17). In yeast, rDNA comprise∼1.8 million bp in length, corresponding to∼361 beads in our model. Here, we simulate the nucleolus by in-creasing the size of arm 2 in chromosome XII by 361 beads. The position of these beads is in agreement with experimen-tal observations; however the qualitative observations pre-sented in this study are independent of the location of these 361 beads within arm 2 of chromosome XII. We also in-vestigated variations of the number of beads representing the rDNA, these results are shown in Supplementary Fig-ure S8. In general, nucleolus beads follow the same force laws and have the same parameter values as all other beads in our computational domain; with the exception that dy-namic crosslinking among nucleolus beads is introduced, arising from the presence of SMC proteins with preferential affinities to the nucleolus beads. For simulations where the nucleolus is split, the nucleolus beads are divided between arm 2 of chromosome III and arm 2 of chromosome XII, consistent with experiments. Table1summarizes modeling assumptions regarding numbers of beads.
Crosslinking
As in (17), we assume a pair-wise binding of beads by in-troducing a spring-like force between them. This spring force obeys a WLC law, just like the one between neighbor-ing beads in the bead-sprneighbor-ing chromatin chain. However, in protein-mediated crosslinks, the springs are 50×stronger. Note that loops are formed when these crosslinks occur be-tween beads in the same chain. We explore several assump-tions about crosslinking in the nucleolus and external to the nucleolus:
i) Absence of crosslinks throughout the whole domain.This set of data is used as a baseline comparison with all other simulations.
ii) Fixed loops in the nucleolus only. Here, we assume that the 361 beads composing the nucleolus are arranged such that strong WLC springs connect every third, fifth or seventh bead. This results in chain configurations of permanent 3-bead, 5-bead and 7-bead loops, respec-tively.
iii) Dynamic crosslinking in the nucleolus only. We assume stochastic dynamic crosslink formation within the nu-cleolus, with all beads within the nucleolus available for binding-unbinding kinetics and assume no crosslinks outside the nucleolus. We tune dynamic crosslinking through the use of six parameters, defined below. Unlike single molecule analysis or imaging, this approach en-ables us to discern how the dynamics of entropic chain
fluctuations, together with on and off timescale distri-butions of the binding protein, influence the strength of interactions within the nucleolus.
iv) Preferential dynamic crosslinking internal versus exter-nal to the nucleolus. We assume dynamic crosslinking throughout the genome, but with a fraction (1/3, 1/10) of active binding sites external to the fully active nucle-olus.
Dynamic looping parameters
i) Barrier. The distance (90 nm) between which two beads must fall in order to be eligible to form a crosslink. Although in our modeling, we are assuming generic crosslinkers, here we choose a value based on experi-mental work with condensin, which can reach and bind portions of DNA that are at most 90 nm apart (37). However, other values were explored and these results are shown in Supplementary Figure S9.
ii) Maximum loop distance. The distance where the WLC spring has a singularity. The bond might start at a larger distance when they form the crosslink, but will quickly move within this distance. This value was chosen based on experimental work suggesting that condensin can stretch to 45 nm (37). As mentioned above, this does not indicate we are only modeling condensin, but rather we are taking these values as reference points.
iii) Loop force scale. Applicable in both the uniform loop-ing and dynamic looploop-ing cases, this parameter is a co-efficient that scales the linear part of the WLC spring; namely, it makes the spring stiffer at shorter length scales.
iv) Mean on, Mean off, Standard Deviation on and Standard Deviation off.These parameters (units of time) are the mean and standard deviation for how long a crosslink is active or inactive. In our simulations, we have varied the values for ‘Mean On’ and ‘Mean Off’ (often choosing values so that the ratio Mean On:Mean Off =9) but have kept both ‘Standard Deviation On’ and ‘Standard Deviation Off’ set to 20% of their respective mean value for all simulations. For example, if ‘Mean On’=0.09 s and ‘Mean Off’=0.01 s, then ‘Standard Deviation On’
=0.018 s and ‘Standard Deviation Off’=0.002 s. vi) Formation and destruction of links. Due to the dynamic
Table 1. Summary of number of beads used in each type of simulation
Number of beads
Chromosome Arm No nucleolus Single nucleolus Split nucleolus
III 1 24 24 24
2 41 41 325
XII 1 31 31 31
2 186 546 263
All other chromosome arms are discretized as in (17).
smallest distance is above the barrier distance. In the end, this matrix does not have to be empty, since the number of available beads might be odd and there are often lone beads that are too far away from the other unattached beads. We also note that, in the case of dy-namic looping, it is likely that two beads will be more than the maximum loop distance apart from one an-other when they first join to form a loop, since the bar-rier value is larger than the maximum loop distance value. Thus, at every subsequent time step after the ini-tial loop connection is made, the distance between the two beads is halved until that distance is less than the maximum loop distance value.
Microscope simulator
We have created two distinct pipelines––one for experimen-tal images and the other for simulated bead position data. Simulated data go through a program, which we call the microscope simulator, to create images that can be post-processed the same way as images that come from ex-periments. This allows us to analyze the entire simulation run. This is done by using and extending DataTank, an object-oriented programming environment offering large dataset support and visualization tools made by Adalsteins-sonhttp://www.visualdatatools.com/DataTank. The metric we use is nucleolar area.
i) Experimental input.Images from light fluorescence mi-croscopy are input into the DataTank script. The script takes the max projection of the Z-stack to produce a sin-gle image for a given time. We use the Otsu thresholding method (38) to determine the appropriate nucleolar con-tour threshold for each frame. This gives us a polygonal representation of the boundary and allows us to com-pute the area for the cell at each frame and comcom-pute statistics from the collection of images.
ii) Simulated input. When analyzing simulated data, the process is similar, but we must first transform the sim-ulated data into an image. This is the program we re-fer to as the Microscope simulator and was created as a module in DataTank. This module contains information about how a single point of light spreads and is visual-ized in 3D; namely, it utilizes a point spread function (PSF) to generate a simulated 3D image. This PSF was captured using the same microscope that the Bloom Lab uses in their experimental work. In the DataTank script, the simulator module takes as input a 3D stack of im-ages coming from a single fluorescent bead along with the x, y, z coordinates from the simulation. The module
goes over each simulated data point and shifts the 3D input image to that center and adds together all of those images to form a 3D image. At this point it computes a max projection to create a single 2D image. This is done for every frame of the simulation. After this, we use the same process as for the experimental images, except that the threshold is kept the same for all of the images, at 68% of the maximum light intensity.
Metrics
• Radius of Gyration: The radius of gyration forN nucleo-lar beads is computed as:
R2g= −rmean·rmean+ 1 N
N
k=1
(rk·rk)
whererkis the vector position for individual beads and
rmeanis the mean position of all nucleolus beads.
• Expected Value(E[X]): for a log-normal distribution with meanμand standard deviationσ, the E[X] is:
E[X]=exp
μ+1
sσ 2
.
• Coefficient of Variation (CV): for a log-normal distribu-tion with standard deviadistribu-tionσthe arithmetic CV is:
CV[X]=eσ2 −1.
RESULTS
The nucleolus is a heterogeneous and dynamic nuclear sub-domain
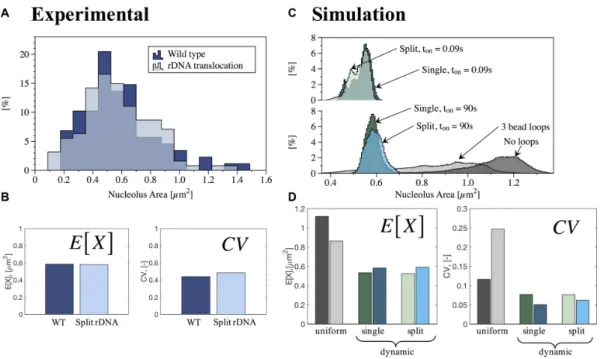
Figure 1. Quantitative analysis of nucleolus area in wild-type (WT) and rDNA translocation strains. (A) Histogram of experimental results for WT (88 cells) and rDNA translocation (127 cells). Y-axis is percentage in each bin. (B) Measures of central tendency (Expected value, E[X]) and dispersion (Geometric coefficient of variation, CV) obtained from best fit to lognormal distributions to experimental data in (A). (C) Histogram of simulations results for no crosslinks, uniform crosslinks and dynamic crosslinks, withKeq=9 and two different (slow and fast) binding timestonfor single and split nucleolus. Y-axis
is percentage in each bin. (D) Measures of central tendency (E[X]) and dispersion (CV) obtained from best fit to lognormal distributions of simulated data in (C). Color code for panels (C) and (D): No crosslinks (dark gray), uniform crosslinks with 3 beads per loop (light gray), dynamic crosslinks, single nucleolus,ton=90 s (dark green), dynamic crosslinks, single nucleolus,ton=0.09 s (dark blue), dynamic crosslinks, split nucleolus,ton=90 s (light green)
and dynamic crosslinks, split nucleolus,ton=0.09 s (light blue).
nucleolar protein (Cdc14-GFP) display a lognormal distri-bution in WT cells in G1 of the cell cycle (Figures1A and
2). For each of these distributions, we calculated the E[X] and CV as measures of central tendency and dispersion of the data (Figure1B).
Nucleolar position and morphology is not dependent on rDNA continuity along a single chromosome
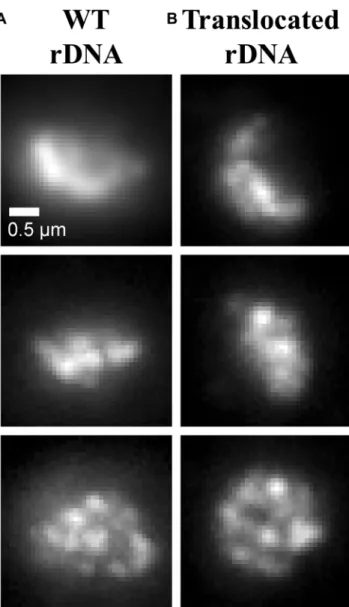
In yeast cells, rDNA can be experimentally manipulated through chromosome translocation to split the locus among different chromosomes. We have utilized a strain where the rDNA has been split between chromosome XII and III (Figure2). Through an engineered chromosome transloca-tion, Mikus and Petes (22) have generated a yeast strain where a translocation between two chromosomes results in splitting the rDNA. Remarkably, the split nucleolus is indis-tinguishable from the nucleolus in WT cells (Figure2), sim-ilar to that found in cells with rDNA at ectopic sites (40). Figure1A and B show that the area within the nucleolus, as well as the quantitative analysis of central tendency and dispersion, are comparable between the two biological situ-ations. This finding provides the impetus to explore models that account for the biological merger of rDNA when the gene arrays lie on disparate chromosomes.
Implementation of crosslinks through molecular springs to simulate the nucleolus
To directly compare bead-spring models to experimental data, we convolved beads that occupy the position
com-parable to the rDNA repeats in chromosome XII with a point-spread function from a fluorescence microscope used to image the nucleolus (see ‘Materials and Methods’ sec-tion). The strategy was implemented in DataTank (http:// www.visualdatatools.com). Analyses of nucleolus area from simulations also display a lognormal distribution (Figure
1C). Figure1D shows the resulting measures of central ten-dency and dispersion. Examples of microscope-simulator images and area thresholds are shown in Figure3, for dif-ferent modeling assumptions.
SMC proteins, including condensin (SMC2,4) and co-hesin (SMC1,3), are major structural components of eu-karyotic chromosomes and are enriched in the nucleolus throughout phylogeny. The proteins comprise small rings (25–50 nm diameter) that function to build chromatin loops, hold sister chromatids together and are the basis for the 3D organization of the chromatin fiber into topolog-ically associated domains (TADs). (41). To simulate rings that physically aggregate remote chromatin domains, we im-plemented molecular springs in the model that bridge and hold pairs of beads for prescribed statistical durations. This spring force obeys a WLC law, based on polymer models of random coils (42,43) and is the same as the one imple-mented in the springs between neighboring beads of the bead–spring chromatin chains. In addition, the crosslink-ing sprcrosslink-ings are 50×stronger than those connecting neigh-boring beads. In this way, crosslinking springs represent rel-atively stiff protein complexes (small persistence length, Lp)
Figure 2.Experimental results for CDC14-GFP of intact and translocated rDNA. Maximum intensity projections of CDC14-GFP in strains with (A) WT (DCY1021.1) and (B) translocated (DCY1017.2) rDNA.
To explore whether introducing crosslinking via simple springs is sufficient to segregate sub-domains in the genome, we implemented simulations with no crosslinks (Figure4A), permanent crosslinks formed by springs located at fixed locations (uniform crosslinks––Figure 4B) and crosslinks formed by springs whose locations are changed dynami-cally (dynamic crosslinks––Figure4C), as described in the ‘Materials and Methods’ section. In Figure 4, for uni-form crosslinks we impose chain configurations with 3-bead loops: two looping beads separated by one bead, as de-scribed in ‘Materials and Methods’ section. For dynamic crosslinks, we assume stochastic dynamic crosslink forma-tion within the nucleolus, with all beads within the nucleo-lus available for binding-unbinding kinetics and assume no crosslinks outside the nucleolus (see below for inclusion of crosslinks outside the nucleolus). Several noteworthy dif-ferences distinguish the dynamic crosslinks case from the uniform, fixed-loops case. For instance, dynamic crosslink-ing allows for the possibility of a transient, fluctuatcrosslink-ing
Figure 3.Qualitative analysis of nucleolus area. Simulation results con-verted to microscope images (see ‘Materials and Methods’ section). (A) Without crosslinks, (B) uniform, fixed cross-links, (C) dynamic crosslinks for single nucleolus withton=0.09 s, (D) dynamic crosslinks for single
nu-cleolus withton=90 s, (E) dynamic crosslinks for split nucleolus withton
=0.09 s and (F) dynamic crosslinks for split nucleolus withton=90 s.
‘loops within loops’ structure. We tune dynamic crosslink-ing through the use of six parameters, defined in detail in ‘Materials and Methods’ section. The parameters are the distance (90 nm) between which two beads must fall in or-der to be eligible to form a crosslink, maximum separation (45 nm) that beads cannot breach when they are bound by a dynamic crosslinking spring, spring force that makes the spring stiffer at shorter length scales (50×) and meanton,
meantoff, standard deviation on and standard deviation off.
The last four parameters are in seconds and they define the distribution of times at which beads can turn ‘on’ and ‘off’, i.e. are eligible for binding with other active beads. In the model, we have varied the values forton andtoff, keeping the equilibrium rate constant,Keq=ton/toff =9 and have
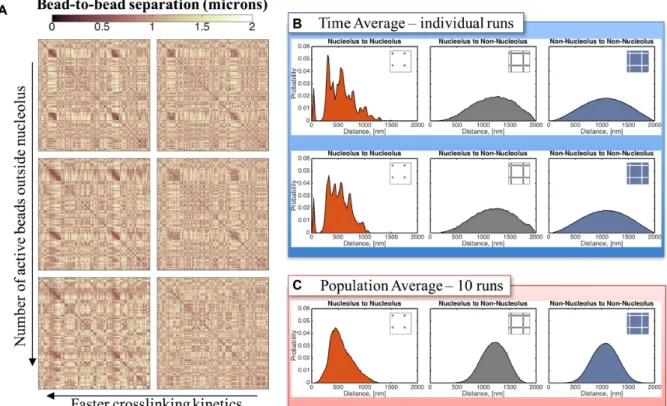
Figure 4. Contact Maps depicting the average 3D bead-to-bead distance over 15 min. Each plot corresponds to datasets from six independent simulations; however datasets in the same row (top or bottom) use the same random seed and only differ on the type of crosslinking imposed in the nucleolus. Dynamic crosslinking dramatically increases nucleolus connectivity, whereas uniform crosslinking has a far lesser effect. (A) No crosslinks, (B) 3-bead uniform loops, (C) Dynamic crosslinking (Keq=ton/toff=9,ton=0.09 s). X- and Y-axis in each contact map correspond to bead numbers (1–2443), where bead 1 is the
first bead in the chain corresponding to arm 1 of chromosome I and bead 2443 is the last bead in the chain representing arm 2 of chromosome XVI.
Crosslinks in the model promote compaction and spatial seg-regation while dynamic crosslinking promotes connectivity and sub-structure within the nucleolus
Unlike single molecule analysis or imaging, simulation en-ables us to discern how the dynamics of entropic chain fluctuations, together with permanent versus dynamic crosslinking, influence the strength of interactions within the nucleolus. Figure 4 shows contact maps consisting of average bead–bead distances over a 15-min period. In the absence of crosslinking, the maps in Figure 4A reveal a fairly uniform distribution of bead–bead distances across the genome. Although the average distance is about 1m, there is heterogeneity across the genome and different simu-lations show different distributions (top–bottom Figure4). Upon introducing static 3-bead looping, Figure4B shows that the major change is a decrease in average bead–bead distances, from ∼1 m to ∼600 nm, in the region where the looping was implemented (denoted as the rDNA con-taining 1.8 Mb of rDNA gene repeats). However, the re-maining beads exhibit similar contact statistics as in the non-crosslinking configuration, except for their interactions with beads belonging to the nucleolus region, which show an increase in bead separation (lighter ‘cross’ in the con-tact maps), indicating enhanced sequestration of the nu-cleolus. In contrast, fast dynamic crosslinking has a major impact on the behavior of the rDNA cluster (Figure 4C). There is a predominant compaction of bead–bead distance in the dynamic case, down to 300–400 nm among a sub-set of beads (further explored below) within the nucleolar region and less dramatic yet still much closer bead–bead proximity within the rest of the nucleolus relative to the rest of the genome. Furthermore, the distance between the rDNA beads and the rest of the genome increases, corre-sponding to more enhanced sequestration of the nucleolus.
This implies that the rDNA beads are interacting more fre-quently with themselves and therefore less frefre-quently with the remainder of the genome. This is notable in the perpen-dicular cross, lighter regions vertical and horizontal from the rDNA, signifying the rDNA bead interactions with un-linked chromosomes. This somewhat non-intuitive impact of weak binding relative to tight binding kinetics has been explored in other biological contexts (J. Newby, J. Schiller, T. Wessler, M.G. Forest, S. Lai, A blueprint for robust crosslinking of mobile species in biogels using third-party molecular anchors with short-lived anchor-matrix bonds, Nature Communications, accepted July 2017), both experi-mentally and theoretically.
Reduction of crosslinks through in vivo mutational ap-proaches corroborate model predictions
analysis, Kobayashi and Saskai (46) found no significant change in rDNA copy number in fob1or hmo1strains relative to WT. Brn1 is an essential gene, thus we utilized the temperature sensitive mutant Brn1–9 (47).
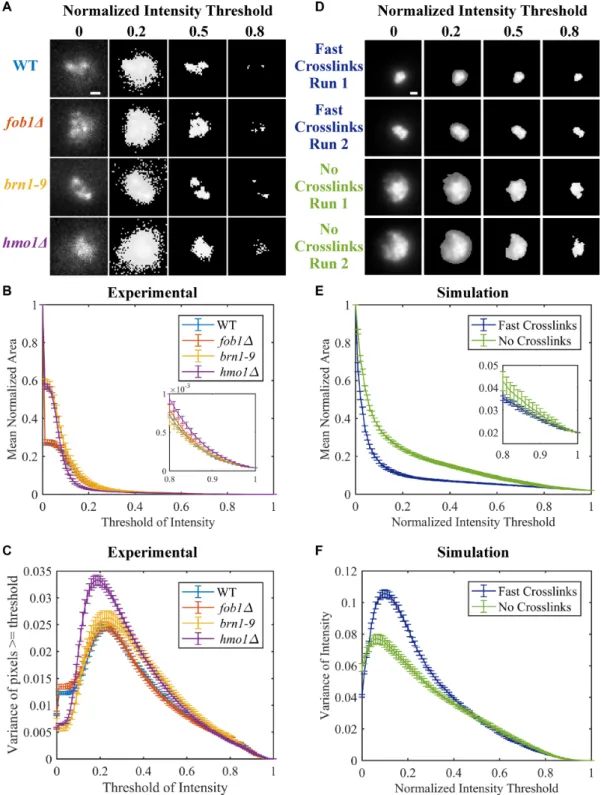
Cdc14-GFP was introduced into these strains for quanti-tative image analysis of the nucleolus (Figure5A). Given the diffuse and amorphous nature of the CDC14-GFP signal, we measured the fluorescent signal over 100 imaging thresh-olds (Figure 5A). Individual images were normalized by subtracting the minimum intensity from all intensity values (giving a minimum intensity of 0) and setting the maximum intensity to 1 (dividing each intensity value by the maximum intensity). We measured the area (Figure5B) of the normal-ized fluorescent signal at increasing fractional thresholds from 0 (total image measured) to 1 (brightest pixel only) (48). The nucleolus occupies a larger normalized area in the absence of Fob1, Hmo1 and brn1–9 at thresholds<0.15 and
>0.8 (Figure5B inset). In the absence of Fob1, the nucleolar area is indistinguishable from WT (Figure5B), as reported in Albertet al., (49). At intermediate thresholds, the fluores-cence intensity reflects regions of heterogeneity within the nucleolus where the intensities are heightened due to clus-tering of a fraction of the repeats (Figure5A 0.8, mutants). To confirm that the thresholding is an appropriate metric, we examined the model through convolution of simulated fluorescence (Figure5D). The thresholding metric captures the increased area observed in the absence of crosslinks versus compaction upon crosslinking (Figure5D) over all thresholds. Thus the crosslinking function provided by key nucleolar components, Brn1, Hmo1 phenocopy simulations of their deletion in the model.
In addition to the normalized area, we determined the variance of normalized intensity (minimum intensity is 0, maximum intensity is 1) to assess heterogeneity in bead dis-tribution within the nucleolus. The greatest variance is ob-served in hmo1mutants (Figure5C). The distribution of clusters is comparable to WT in fob1and brn1mutant situations. In simulation, the greatest variance is observed when fast cross-linking is implemented (Figure5F). Reduc-tion of crosslinks leads to homogenizaReduc-tion of bead distribu-tion. The increased variance in hmo1 mutantsin vivo pre-dicts that the binding and release of a crosslinker (e.g. con-densin) is more rapid in hmo1 mutants.
Timescales of binding kinetics tune segregation and hetero-geneity of the nucleolus
In the previous section, we showed that fast dynamic crosslinking enhances interactions within the active bind-ing domain, leadbind-ing to enhanced compaction and segrega-tion of the nucleolus relative to permanent or no crosslink-ing. Here we explore the critical biological parameters in-volved in dynamic crosslinking, the on and off timescales of binding kinetics between nucleolar beads via the molec-ular springs and their influence on nucleolar morphology and nucleus-wide genome organization. We simulated three dynamic kinetic regimes, each withKeq=ton/toff=9,
span-ning fast to slow (weak to tight) binding withton =0.09, 0.9 and 90 s, shown from left to right in Figure 6. These bead–bead contact maps reveal that faster binding kinet-ics induces closer bead–bead contacts (progressively darker
shades) within the nucleolus. Further, upon closer inspec-tion of Figure6left column, fast kinetics induces hetero-geneity of bead–bead contactswithinthe nucleolus, indica-tive of structure-within-structure in nucleolus morphology, which homogenizes with slower binding (left to right in Fig-ure6).
Dynamic crosslinking is a segregation mechanism within the nucleus
By allowing a preferential interaction of beads in a spe-cific part of the genome, a crosslink-induced phase sepa-ration occurs within the nucleus. In our simulations, one phase consists of beads in the nucleolus and this region is characterized by being denser than the rest of the nucleus. This compaction comes from enhanced interactions among these beads together with reduced interactions with other beads in the genome. To take into account different bind-ing kineticsoutsidethe nucleolus we define the number of ‘actively crosslinking’ beads outside. Figure6(top to bot-tom) shows that as this number decreases (less externally ac-tive beads) the nucleolus becomes more compact. As more beads outside the nucleolus participate in binding kinetics the identity of the nucleolus is weakened: less separation between bead–bead contacts within and external, and less compaction and segregation of the nucleolus (Supplemen-tary Figure S4).
Figure6A shows that sub-structures are formed within the nucleolus exclusively in the fast kinetics case,ton=0.09
s. These sub-structures are formed by clusters of nucleo-lar beads that reside closer and interact more frequently with members of their cluster, as suggested by the non-uniformity in the contact maps (left column of Figure4). To amplify this feature, in Figure6B we show histograms of bead–bead distances for two individual simulations and for a population average over 10 individual simulations, all with
ton=0.09 s and identical initial data. Note the remarkable similarity of histograms for both individual runs shown (in-deed for all 10 individual runs), with striking peaks within the nucleolus bead–bead distances yet with smooth prox-imity distributions of the population average and all bead-bead statistics involving extra-nucleolar bead-beads. The first peak at∼10 nm identifies sub-sets of beads tightly and per-sistently packed (forming clusters) and the second peak at
∼300 nm implies a robust separation between the persis-tent clusters. To visualize this implied morphology, Figure
7A is a 3D snapshot of all nucleolus beads for an individual run, revealing∼25 clusters of 10–25 beads each. Distances within these clusters correspond to the leftmost peak in the graphs for individual runs in Figure6B, while inter-cluster distances correspond to the second and third peaks in the same histograms. Although dynamic, these sub-structures persist in time for each individual run and vary from run to run (see Supplementary Movie 1). We note that these peaks and associated sub-structures are not present in runs with slower dynamics (see Supplementary Figure S3 for ton =
Figure 5. Area and variance of experimental and simulated nucleolar signals. (A) Representative images of CDC14-GFP in WT,fob1,brn1–9andhmo1Δ
at different fractional intensity thresholds. Images are maximum intensity projections of Z-stacks through the cell. Images were normalized by subtracting minimum pixel value and then dividing by the maximum pixel value for each image. Thresholding of images set all pixels below indicated normalized intensity threshold to 0. Scale bar is 0.5m. (B) Normalized area of CDC14-GFP signal over all intensity thresholds. Error bars are S.E.M. WT (n=
Figure 6.Nucleolus and genome-wide interactions as functions of crosslinking parameters. (A) Faster kinetics (lowerton) result in more interactions within
the nucleolus. From left to rightton=0.09, 0.9 and 90 s. Dynamics outside the nucleolus are controlled by the number of beads that are actively crosslinking.
From top to bottom: all beads outside the nucleolus are inactive, every tenth bead is active and every third bead is active. All contact maps correspond to an average over 15 min for a single run. All data shown are simulated using the same random noise. (B)Distribution of bead-to-bead distances for dynamic crosslinking with Keq=9 and ton=0.09 s.Sub-structures within the nucleolus are formed by groups of beads that interact more frequently, leading to
the darker regions in the contact maps and the peaks in the distribution functions. Although dynamic, these sub-structures persist over time for a given run (see Supplementary Movie 1) and vary from run to run. Top and bottom panels correspond to the same model parameters but different random seed. (C) The sub-structures are lost in the population averages resulting in a more uniform distribution of bead-to-bead distances within the nucleolus. X- and Y-axis for each contact map correspond to bead numbers, as explained in Figure4.
Figure 7. Snapshots of 3D nucleolus simulations. Bead distributions for (A)ton=0.09 s and (B)ton=90 s. Red symbols (spheres) represent bead positions,
dark blue segments (lines) represent transient crosslinks between beads both inter- and intra-chain, light blue (thin) lines represent intra-chain neighboring bead connections. Inserts in (A) and (B) are blow-ups of small volumes around bead clusters.
similarity in the cluster morphology of both runs in Fig-ure6A (indeed all 10 runs), is due to the fact that nucleo-lar beads are randomly distributed in the clusters for each run, so the tight associations of beads in any one cluster for any individual realization are different in every other real-ization. This result indicates that population averages might obscure a rich set of dynamic structures, which can only be appreciated at the single, live cell level.
between nucleolus beads and beads outside the nucleolus (Figure 5B and Supplementary Figure S3). These results suggest that dynamic crosslinking, although segregating nu-cleolar beads, still allows them to explore the nuclear state. There is physiological evidence for nucleolar DNA exiting the nucleus under conditions of DNA damage (5). The sim-ulation indicates that rDNA is constantly able to ‘explore’ the nucleus and perhaps DNA damage takes advantage of this naturally occurring process.
We can divide our simulations along three main condi-tions: (i) static/uniform versus dynamic crosslinking, (ii) magnitude of dynamic binding-unbinding timescales and (iii) percentage of active-binding domains throughout the nucleus. A summary of these conditions is shown in Supple-mentary Figure S1 where we compare the statistics of bead– bead separation using best fits to lognormal distributions and their measures of central tendency E[X] and dispersion with respect to the mean (geometric CV). These statistics allow us to quantitate the degree of nucleolar structure. Im-posing uniform looping in the nucleolus has little effect in the average bead–bead distance for beads both inside and outside of the nucleolus. Dynamic crosslinking, on the other hand, reduces the average distance between intra-nucleolar beads, while an increase of active beads outside the nu-cleolus has the opposite effect, i.e. increasing the average intra-nucleolar distance. As more beads outside the nucleo-lus participate in the crosslinking dynamics, the average sep-aration between nucleolus beads increases (Supplementary Figure S1). This effect is more pronounced in the slow kinet-ics (ton=90 s), which shows bead–bead distances that are comparable with those found in the case where crosslinking was absent throughout the whole nucleus. With more active beads outside the nucleolus, the nucleolar beads are more spread out, indicating that the area increases as nucleolar beads spend more time outside the nucleolus.
Split nucleolus: co-linearity is not required to form a single domain
A critical prediction of the model is that the coalescence of beads into a distinct phase is not dependent on their co-linearity, (i.e. contiguous on the same chromosome arm) rather it is a consequence of protein-mediated binding ki-netics. To test this in the model, we simulate a split nucleo-lus by dividing ‘nucleolar beads’ into two different chains as described in the ‘Materials and Methods’ section. The ob-jective of this numerical experiment is to assess whether dy-namic crosslinking suffices to create different regions within the nucleus or if co-linearity of such beads is required. Our results indicate that the split chains occupy a single region within the nucleus as shown in the contact maps in Figure8
and Supplementary Figure S5. In addition, the distance be-tween all nucleolar beads are comparable, consistent with them being in close proximity (Figure 6B). These results suggest that the main driving mechanism in the forma-tion of nucleolar-like regions is a ‘preferential crosslinking’ within that region. In our case, this preferential crosslinking is controlled by the on/off binding dynamics of chromatin domains inside relative to outside the nucleolus.
Remarkably,the dynamics observed in our single nucleo-lus simulations are mirrored by those in the split nucleonucleo-lus.
Namely, faster binding kinetics result in a decrease in the nucleolar area (compare Supplementary Figures S1 and 6) arising from beads within the nucleolus self-associating via sub-structures and interacting less with beads outside the nucleolus (Supplementary Figures S2 and 7). The introduc-tion of crosslinking dynamics outside the nucleolus results, as anticipated, in an increase in nucleolar area. This increase scales with the relative percentage of active external beads versus internal nucleolar beads; all active beads experience increased interactions independent of which chromosome arm they reside in, essentially creating an effective nucle-olus dictated by mutual binding affinity. Finally, for slow crosslinking dynamics and large numbers of active beads outside the nucleolus, the resulting distribution of bead– bead distances shows a complete mixing throughout the nu-cleus, evident in the contact maps shown in Figure8. We note that this ‘mixing’ effect is more pronounced in the split nucleolus case than in the single nucleolus (compare bottom right of Figures5A and7A).
Results discussed above point toward a different under-standing of the formation of nucleolar-type regions in the nucleus. As previously noted, the assumption of different polymeric properties for the nucleolar beads results in seg-regation and slower dynamics of the nucleolus, consistent with experimental results (11). However, this assumption alone does not, and cannot, yield our experimental results for a split nucleolus. Our approach of distinguishing the nu-cleolar beads not by their polymeric properties but by their binding affinity to certain proteins, recapitulates segrega-tion, slower dynamicsandsplit nucleolus observations. We note, however, thatin vivothe most probable scenario is a combination of different non-specific (entropy, polymeric properties, macromolecular crowding, etc.) and specific in-teractions (e.g. protein-mediated crosslinking).
DISCUSSION
The numerical study presented here suggests that prefer-ential, protein-mediated crosslinking in different regions of the genome results in the self-segregation, compaction and morphology of these regions, with each feature tunable by the timescales of crosslinking. Using bead–spring polymer models, we have shown that the only necessary condition to ‘create’ a nucleolus is that certain beads (which we labeled ‘nucleolar beads’) have binding affinity to each other in a dynamic way. Whether or not the nucleolar beads belong to the same chain, has little effect in the formation of the nucleolus or its dynamics. The important parameters are intra-nucleolar bead interaction kinetics and their relative interaction kinetics with non-nucleolar beads. We control the interaction kinetics via on/off binding timescale distri-butions and the interactions with other beads through the percentage of active beads outside the nucleolar region. We have summarized the parameter space explored in this study in Figure9, where the radius of gyration of the resulting nu-cleolus is used as a metric for nunu-cleolus size.
Figure 8.Distribution of bead-to-bead distances for split nucleolus. (A) Contact maps show that there is a marked increased in bead interactions within the nucleolus as a function of decreasing the on/off times of binding (left to right). Faster (weak) kinetics results in more interactions. Left columnton
=0.09 s, right columnton=90 s. Active beads outside the nucleolus are introduced to account for binding interactions throughout the nucleus. In the
non-nucleolar chromatin, interactive beads are inactive outside the nucleolus (stride zero––top row), every tenth bead is active (stride 10) and every third bead is active (stride 3––bottom row). (B) Sub-structures within the nucleolus are formed by clusters of beads that are closer, interact more frequently and maintain some separation between clusters. These fluctuating sub-structures create darker regions in the contact maps and peaks in the bead–bead proximity histograms within the nucleolus. Although dynamic, these sub-structures persist over time for a given run (see Supplementary Movie 3) and are robust from run-to-run although the nucleolar bead cluster assignments are random. Top and bottom panels correspond to the same model parameters but different random seed. (C) The sub-structures are lost in the population averages, even though the cluster morphology is robust, because of random cluster assignments, resulting in a more uniform distribution of bead-to-bead distances within the nucleolus. X- and Y-axis for each contact map correspond to bead numbers, as explained in Figure4.
Figure 9. Summary of nucleolus size with respect to crosslinking parameters. Radius of gyration, Rg, for each of the parameter values investigated in this study. For single nucleolus dynamics the values fortonare 0.09, 0.9 and 90 s. For split nucleolus dynamicston=0.09 and 90 s. Increase in ‘on’ time leads to
of protein/binding sites arise, they persist for extended time periods. The result is evident in Figure6as peaks and valleys in the histogram of bead–bead distances and as a 3D array of bead clusters in the snapshots of nucleolus beads in Fig-ure 7, with persistence revealed in Supplementary movies. The primary peak in the fast-binding histograms represents an increased number of beads interacting within small ar-eas, the array of clusters in Figure 6C. The valleys are a consequence of cluster–cluster separation statistics. Impor-tantly, this heterogeneity is lost if one averages across a population (compare population average versus individual runs, Figure6). A second consequence of the rapid kinet-ics relative to chain motion is the increase in distance for a portion of beads (tail toward increasing distance). This can be seen in the increase in CV for dynamic looping. This may have important biological consequences in terms of a mech-anism for extending the DNA, thereby facilitating DNA transcription into RNA.
In previous studies, we described some general princi-ples driving nuclear organization during interphase (41). We showed that entropic and/or other non-specific interac-tions dictate, to first order, the structure and dynamics of the yeast genome. We hypothesized that the role of biochemical and other specific interactions is to modulate this organiza-tion by guiding, stabilizing and sustaining cycle-dependent genomic states. One objective of the present work is to validate such hypotheses and indeed we have shown how certain specific interactions (modeled as protein-mediated, dynamic crosslinks) drive the rearrangement into differ-ent functional phases within the nucleus. While differ-entropic and other non-specific interactions such as macromolecular crowding (50–53) and viscoelastic phase separation (54,55) promote the association of different regions or compart-ments, specific interactions are ultimately responsible for shaping and maintaining such compartmentalization.
An emerging concept is that phase transitions play a fundamental role in nucleolar organization (56–59) (60). Many studies have highlighted the role played by proteins and/or RNA in nuclear phase separation (50–59,61,62). Most commonly this behavior is described as liquid–liquid phase transition, where the different compartments be-have as ‘liquid drops’ within the nucleoplasm (56,59,61). Within this context of liquid–liquid demixing one can dis-tinguish two phases by their viscous behavior (e.g. differ-ent viscosities). However, from a soft matter perspective one can define phase separation in a much broader sense to include behaviors and properties beyond those related to viscosity-based demixing, for example stiffness (elasticity-based demixing), viscoelastic demixing, volume occupancy (swelling), etc. For instance, one can view the nuclear en-vironment as a complex, cross-linked network formed by chromosomes, proteins, RNA and other macromolecular components. This cross-linked network exhibits character-istics observed in gel solutions (e.g. sub-diffusive behav-ior (18,63,64)). In this view, different levels of gel stiffness characterize different ‘phases,’ each one exhibiting different transport and diffusive properties. However, in this view the boundaries between phases are more nuanced than a scalar-based, viscous demixing picture.
In general, the demixing studies indicate that phase sepa-ration occurs via non-specific interactions mainly driven by
changes in the concentration of proteins and RNA, while chromosomes play a semi-passive role. Here we set to ex-plore whether or not chromosomes play a more active role in phase separation through the formation of chromoso-mal regions with preferential, protein-mediated crosslink-ing. By assuming preferential crosslinking kinetics we effec-tively modify thelocalgel properties of the network. In this view, one could consider the nucleolus formation and stabil-ity to be characterized as a gel–gel phase separation, where one gel phase, the nucleolus, exhibits properties correspond-ing to a ‘stiffer’ gel compared to the rest of the genome. In addition, the formation of different phases within the nu-cleus via crosslinks favors the formation of nuclear com-partments through protein-mediated self-organization al-lowing the development of diverse dynamic structures (65), which gives the genome the ability to rearrange into dif-ferent functional states according to modifications of the crosslinking mechanisms. These mechanisms can arise from the fast exchange of proteins across different regions in the genome, which has been observed in the nucleolus (66), Ca-jal (67) and PML bodies (68).
SUPPLEMENTARY DATA
Supplementary Data are available at NAR Online.
ACKNOWLEDGEMENTS
Computational resources were provided by the KillDevil cluster at the University of North Carolina at Chapel Hill and the Maxwell and Boltzmann high performance com-puter clusters at the University of South Carolina. We would like to thank Dr Thomas D. Petes (Duke University) for sharing the split nucleolus strain with us.
FUNDING
National Science Foundation–Division of Mathematical Sciences (DMS) [1410047 to P.A.V., in part]; National Insti-tutes of Health [R37 GM32238 to K.B.]; National Science Foundation [DMS-1412844, DMS-1462992 to M.G.F.]; National Institutes of Health [T32CA201159–01 to J.L.]. Funding for open access charge: National Institutes of Health [R37 GM32238 to K.B.].
Conflict of interest statement.None declared.
REFERENCES
1. Cubenas-Potts,C. and Corces,V.G. (2015) Topologically associating domains: an invariant framework or a dynamic scaffold?Nucleus,6, 430–434.
2. Dekker,J. and Misteli,T. (2015) Long-range chromatin interactions.
Cold Spring Harb. Perspect. Biol.,7, 1–18.
3. Verdaasdonk,J.S. and Bloom,K. (2011) Centromeres: unique chromatin structures that drive chromosome segregation.Nat. Rev. Mol. Cell Biol.,12, 320–332.
4. McStay,B. (2016) Nucleolar organizer regions: genomic ‘dark matter’ requiring illumination.Genes Dev.,30, 1598–1610.
5. Torres-Rosell,J., Sunjevaric,I., De Piccoli,G., Sacher,M.,
6. van Sluis,M. and McStay,B. (2015) A localized nucleolar DNA damage response facilitates recruitment of the homology-directed repair machinery independent of cell cycle stage.Genes Dev.,29, 1151–1163.
7. Wong,H., Marie-Nelly,H., Herbert,S., Carrivain,P., Blanc,H., Koszul,R., Fabre,E. and Zimmer,C. (2012) A predictive
computational model of the dynamic 3D interphase yeast nucleus.
Curr. Biol.,22, 1881–1890.
8. Yang,C.H., Lambie,E.J., Hardin,J., Craft,J. and Snyder,M. (1989) Higher order structure is present in the yeast nucleus: autoantibody probes demonstrate that the nucleolus lies opposite the spindle pole body.Chromosoma,98, 123–128.
9. L´eger-Silvestre,I., Trumtel,S., Noaillac-Depeyre,J. and Gas,N. (1999) Functional compartmentalization of the nucleus in the budding yeast Saccharomyces cerevisiae.Chromosoma,108, 103–113.
10. Albert,B., Mathon,J., Shukla,A., Saad,H., Normand,C., L´eger-Silvestre,I., Villa,D., Kamgoue,A., Mozziconacci,J. and Wong,H. (2013) Systematic characterization of the conformation and dynamics of budding yeast chromosome XII.J. Cell Biol.,202, 201–210.
11. Wong,H., Arbona,J.-M. and Zimmer,C. (2013) How to build a yeast nucleus.Nucleus,4, 361–366.
12. Avsaroglu,B., Bronk,G., Gordon-Messer,S., Ham,J., Bressan,D.A., Haber,J.E. and Kondev,J. (2014) Effect of chromosome tethering on nuclear organization in yeast.PLoS One,9, e102474.
13. Gehlen,L.R., Gruenert,G., Jones,M.B., Rodley,C.D., Langowski,J. and O’Sullivan,J.M. (2012) Chromosome positioning and the clustering of functionally related loci in yeast is driven by chromosomal interactions.Nucleus,3, 370–383.
14. Tjong,H., Gong,K., Chen,L. and Alber,F. (2012) Physical tethering and volume exclusion determine higher-order genome organization in budding yeast.Genome Res.,22, 1295–1305.
15. Albert,B., Mathon,J., Shukla,A., Saad,H., Normand,C.,
Leger-Silvestre,I., Villa,D., Kamgoue,A., Mozziconacci,J., Wong,H.
et al.(2013) Systematic characterization of the conformation and dynamics of budding yeast chromosome XII.J. Cell Biol.,202, 201–210.
16. Vasquez,P.A. and Bloom,K. (2014) Polymer models of interphase chromosomes.Nucleus,5, 376–390.
17. Vasquez,P.A., Hult,C., Adalsteinsson,D., Lawrimore,J., Forest,M.G. and Bloom,K. (2016) Entropy gives rise to topologically associating domains.Nucleic Acids Res.,44, 5540–5549.
18. Verdaasdonk,J.S., Vasquez,P.A., Barry,R.M., Barry,T., Goodwin,S., Forest,M.G. and Bloom,K. (2013) Centromere tethering confines chromosome domains.Mol. Cell,52, 819–831.
19. Wong,H., Arbona,J.M. and Zimmer,C. (2013) How to build a yeast nucleus.Nucleus,4, 361–366.
20. Albert,B., Colleran,C., Leger-Silvestre,I., Berger,A.B., Dez,C., Normand,C., Perez-Fernandez,J., McStay,B. and Gadal,O. (2013) Structure-function analysis of Hmo1 unveils an ancestral organization of HMG-Box factors involved in ribosomal DNA transcription from yeast to human.Nucleic Acids Res.,41, 10135–10149.
21. Prieto,J.L. and McStay,B. (2007) Recruitment of factors linking transcription and processing of pre-rRNA to NOR chromatin is UBF-dependent and occurs independent of transcription in human cells.Genes Dev.,21, 2041–2054.
22. Mikus,M.D. and Petes,T.D. (1982) Recombination between genes located on nonhomologous chromosomes in Saccharomyces cerevisiae.Genetics,101, 369–404.
23. Linkert,M., Rueden,C.T., Allan,C., Burel,J.-M., Moore,W., Patterson,A., Loranger,B., Moore,J., Neves,C. and MacDonald,D. (2010) Metadata matters: access to image data in the real world.J. Cell Biol.,189, 777–782.
24. Hajjoul,H., Mathon,J., Ranchon,H., Goiffon,I., Mozziconacci,J., Albert,B., Carrivain,P., Victor,J.M., Gadal,O., Bystricky,K.et al.
(2013) High-throughput chromatin motion tracking in living yeast reveals the flexibility of the fiber throughout the genome.Genome Res.,23, 1829–1838.
25. Marko,J.F. and Siggia,E.D. (1997) Polymer models of meiotic and mitotic chromosomes.Mol. Biol. Cell,8, 2217–2231.
26. Therizols,P., Duong,T., Dujon,B., Zimmer,C. and Fabre,E. (2010) Chromosome arm length and nuclear constraints determine the
dynamic relationship of yeast subtelomeres.Proc. Natl. Acad. Sci. U.S.A.,107, 2025–2030.
27. Cheng,T.M., Heeger,S., Chaleil,R.A., Matthews,N., Stewart,A., Wright,J., Lim,C., Bates,P.A. and Uhlmann,F. (2015) A simple biophysical model emulates budding yeast chromosome condensation.Elife,4, e05565.
28. Fudenberg,G. and Mirny,L.A. (2012) Higher-order chromatin structure: bridging physics and biology.Curr. Opin. Genet. Dev.,22, 115–124.
29. Rosa,A. and Everaers,R. (2008) Structure and dynamics of interphase chromosomes.PLoS Comput. Biol.,4, e1000153. 30. Wang,R., Mozziconacci,J., Bancaud,A. and Gadal,O. (2015)
Principles of chromatin organization in yeast: relevance of polymer models to describe nuclear organization and dynamics.Curr. Opin. Cell Biol.,34, 54–60.
31. Marko,J.F. and Siggia,E.D. (1994) Fluctuations and supercoiling of DNA.Science,265, 506–508.
32. Marko,J.F. and Siggia,E.D. (1995) Statistical mechanics of supercoiled DNA.Phys. Rev. E Stat. Phys. Plasmas Fluids Relat. Interdiscip. Topics,52, 2912–2938.
33. Berger,A.B., Cabal,G.G., Fabre,E., Duong,T., Buc,H., Nehrbass,U., Olivo-Marin,J.C., Gadal,O. and Zimmer,C. (2008) High-resolution statistical mapping reveals gene territories in live yeast.Nat. Methods,
5, 1031–1037.
34. Dekker,J., Rippe,K., Dekker,M. and Kleckner,N. (2002) Capturing chromosome conformation.Science,295, 1306–1311.
35. Duan,Z., Andronescu,M., Schutz,K., McIlwain,S., Kim,Y.J., Lee,C., Shendure,J., Fields,S., Blau,C.A. and Noble,W.S. (2010) A
three-dimensional model of the yeast genome.Nature,465, 363–367. 36. Zimmer,C. and Fabre,E. (2011) Principles of chromosomal
organization: lessons from yeast.J. Cell Biol.,192, 723–733. 37. Holmes,V.F. and Cozzarelli,N.R. (2000) Closing the ring: links
between SMC proteins and chromosome partitioning, condensation, and supercoiling.Proc. Natl. Acad. Sci. U.S.A.,97, 1322–1324. 38. Otsu,N. (1979) A threshold selection method from gray-level
histograms.IEEE Trans. Syst. Man Cybern.,9, 62–66. 39. Harrison,B.D., Hoang,M.L. and Bloom,K. (2009) Persistent
mechanical linkage between sister chromatids throughout anaphase.
Chromosoma,118, 633–645.
40. Oakes,M.L., Johzuka,K., Vu,L., Eliason,K. and Nomura,M. (2006) Expression of rRNA genes and nucleolus formation at ectopic chromosomal sites in the yeast Saccharomyces cerevisiae.Mol. Cell. Biol.,26, 6223–6238.
41. Vasquez,P.A., Hult,C., Adalsteinsson,D., Lawrimore,J., Forest,M.G. and Bloom,K. (2016) Entropy gives rise to topologically associating domains.Nucleic Acids Res.,44, 5540–5549.
42. Marko,J.F. and Siggia,E.D. (1994) Bending and twisting elasticity of DNA.Macromolecules,27, 981–988.
43. Marko,J.F. and Siggia,E.D. (1995) Stretching dna.Macromolecules,
28, 8759–8770.
44. Johzuka,K. and Horiuchi,T. (2009) The cis element and factors required for condensin recruitment to chromosomes.Mol. Cell,34, 26–35.
45. Johzuka,K., Terasawa,M., Ogawa,H., Ogawa,T. and Horiuchi,T. (2006) Condensin loaded onto the replication fork barrier site in the rRNA gene repeats during S phase in a FOB1-dependent fashion to prevent contraction of a long repetitive array in Saccharomyces cerevisiae.Mol. Cell. Biol.,26, 2226–2236.
46. Kobayashi,T. and Sasaki,M. (2017) Ribosomal DNA stability is supported by many ‘buffer genes’-introduction to the Yeast rDNA Stability Database.FEMS Yeast Res.,17, 1–8.
47. Lavoie,B.D., Tuffo,K.M., Oh,S., Koshland,D. and Holm,C. (2000) Mitotic chromosome condensation requires Brn1p, the yeast homologue of Barren.Mol. Biol. Cell,11, 1293–1304.
48. Maddox,P.S., Portier,N., Desai,A. and Oegema,K. (2006) Molecular analysis of mitotic chromosome condensation using a quantitative time-resolved fluorescence microscopy assay.Proc. Natl. Acad. Sci. U.S.A.,103, 15097–15102.
49. Albert,B., Leger-Silvestre,I., Normand,C., Ostermaier,M.K., Perez-Fernandez,J., Panov,K.I., Zomerdijk,J.C., Schultz,P. and Gadal,O. (2011) RNA polymerase I-specific subunits promote polymerase clustering to enhance the rRNA gene transcription cycle.
50. Hancock,R. (2004) Internal organisation of the nucleus: assembly of compartments by macromolecular crowding and the nuclear matrix model.Biol. Cell,96, 595–601.
51. Hancock,R. (2012) Structure of metaphase chromosomes: a role for effects of macromolecular crowding.PLoS One,7, e36045. 52. Konopka,M.C., Shkel,I.A., Cayley,S., Record,M.T. and
Weisshaar,J.C. (2006) Crowding and confinement effects on protein diffusion in vivo.J. Bacteriol.,188, 6115–6123.
53. Rippe,K. (2007) Dynamic organization of the cell nucleus.Curr. Opin. Genet. Dev.,17, 373–380.
54. Iborra,F.J. (2007) Can visco-elastic phase separation,
macromolecular crowding and colloidal physics explain nuclear organisation?Theor. Biol. Med. Model.,4, 15–26.
55. Tanaka,H. (1996) Universality of viscoelastic phase separation in dynamically asymmetric fluid mixtures.Phys. Rev. Lett.,76, 787–790. 56. Brangwynne,C.P. (2011) Soft active aggregates: mechanics, dynamics
and self-assembly of liquid-like intracellular protein bodies.Soft Matter,7, 3052–3059.
57. Weber,S.C. and Brangwynne,C.P. (2012) Getting RNA and protein in phase.Cell,149, 1188–1191.
58. Meng,F., Na,I., Kurgan,L. and Uversky,V.N. (2015)
Compartmentalization and functionality of nuclear disorder: intrinsic disorder and protein-protein interactions in intra-nuclear
compartments.Int. J. Mol. Sci.,17, 24–49.
59. Hyman,A.A. and Simons,K. (2012) Beyond oil and water––phase transitions in cells.Science,337, 1047–1049.
60. Mangan,H., Gailin,M.O. and McStay,B. (2017) Integrating the genomic architecture of human nucleolar organizer regions with the biophysical properties of nucleoli.FEBS J.,284, 1–9.
61. Marko,J.F. (2012) The liquid drop nature of nucleoli.Nucleus,3, 115–117.
62. Trinkle-Mulcahy,L. and Sleeman,J.E. (2016) The Cajal body and the nucleolus: “in a relationship” or “it’s complicated”?RNA Biol.,14, 739–751.
63. Mine-Hattab,J. and Rothstein,R. (2012) Increased chromosome mobility facilitates homology search during recombination.Nat. Cell Biol.,14, 510–517.
64. Wachsmuth,M., Waldeck,W. and Langowski,J. (2000) Anomalous diffusion of fluorescent probes inside living cell nuclei investigated by spatially-resolved fluorescence correlation spectroscopy.J. Mol. Biol.,
298, 677–689.
65. Rippe,K. (2007) Dynamic organization of the cell nucleus.Curr. Opin. Genet. Dev.,17, 373–380.
66. Boisvert,F.-M., van Koningsbruggen,S., Navascu´es,J. and Lamond,A.I. (2007) The multifunctional nucleolus.Nat. Rev. Mol. Cell Biol.,8, 574–585.
67. Handwerger,K.E., Murphy,C. and Gall,J.G. (2003) Steady-state dynamics of Cajal body components in the Xenopus germinal vesicle.
J. Cell Biol.,160, 495–504.