Investigating the Causal Relationship of
C-Reactive Protein with 32 Complex Somatic
and Psychiatric Outcomes: A Large-Scale
Cross-Consortium Mendelian Randomization
Study
Bram. P. Prins1,2*, Ali Abbasi1,3,4☯, Anson Wong5,6☯, Ahmad Vaez1,7☯, Ilja Nolte1,
Nora Franceschini8, Philip E. Stuart9, Javier Guterriez Achury10, Vanisha Mistry11,12, Jonathan P. Bradfield13, Ana M. Valdes14, Jose Bras15, Aleksey Shatunov16, PAGE
Consortium9, International Stroke Genetics Consortium17, Systemic Sclerosis
consortium18,19, Treat OA consortium20, DIAGRAM Consortium21, CARDIoGRAMplusC4D
Consortium22, ALS consortium16, International Parkinson’s Disease Genomics Consortium23, Autism Spectrum Disorder Working Group of the Psychiatric Genomics
Consortium24, CKDGen consortium25, GERAD1 Consortium26, International Consortium for Blood Pressure27, Schizophrenia Working Group of the Psychiatric Genomics
Consortium28, Inflammation Working Group of the CHARGE Consortium1, Chen Lu29, Buhm Han30, Soumya Raychaudhuri30,31,32,33,34, Steve Bevan17, Maureen D. Mayes18, Lam
C. Tsoi9,35, Evangelos Evangelou20,36, Rajan P. Nair9, Struan F. A. Grant13,37,
Constantin Polychronakos38, Timothy R. D. Radstake39, David A. van Heel12, Melanie
L. Dunstan26, Nicholas W. Wood23, Ammar Al-Chalabi16,40, Abbas Dehghan41, Hakon Hakonarson13,37, Hugh S. Markus17, James T. Elder9, Jo Knight5,42,43,44, Dan
E. Arking24, Timothy D. Spector45, Bobby P. C. Koeleman46, Cornelia M. van Duijn41, Javier Martin19, Andrew P. Morris21,47, Rinse K. Weersma48, Cisca Wijmenga10, Patricia
B. Munroe27,49, John R. B. Perry3, Jennie G. Pouget5,42,43, Yalda Jamshidi50, Harold Snieder1, Behrooz Z. Alizadeh1,48*
1Department of Epidemiology, University of Groningen, University Medical Center Groningen, Groningen, The Netherlands,2Department of Human Genetics, Wellcome Trust Sanger Institute, Hinxton, United Kingdom,3MRC Epidemiology Unit, University of Cambridge School of Clinical Medicine, Institute of Metabolic Science, Addenbrooke’s Hospital, Cambridge, United Kingdom,4Department of Internal Medicine, University of Groningen, University Medical Center Groningen, Groningen, the Netherlands,5Institute of Medical Sciences, University of Toronto, Toronto, Ontario, Canada,6Faculty of Medicine, University of Ottawa, Ottawa, Ontario, Canada,7School of Medicine, Isfahan University of Medical Sciences, Isfahan, Iran,8Department of Epidemiology, University of North Carolina, Chapel Hill, North Carolina, United States of America,9Department of Dermatology, Veterans Affairs Hospital, University of Michigan, Ann Arbor, Michigan, United States of America,10Department of Genetics, University of Groningen, University Medical Centre Groningen, Groningen, the Netherlands,11Metabolic Research Laboratories, Wellcome Trust–MRC Institute of Metabolic Science, Addenbrooke’s Hospital, University of Cambridge, Cambridge, United Kingdom,12 Blizard Institute, Barts and The London School of Medicine and Dentistry, Queen Mary University of London, London, United Kingdom,13 Center for Applied Genomics, Division of Human Genetics, Children’s Hospital of Philadelphia, Philadelphia, United States of America,14Department of Academic Rheumatology, University of Nottingham, Nottingham, United Kingdom,15Department of Molecular Neuroscience, Institute of Neurology, London, United Kingdom,16 Department of Basic and Clinical Neuroscience, Institute of Psychiatry, Psychology and Neuroscience, King’s College London, London, United Kingdom,17Neurology Unit, Department of Clinical Neurosciences, University of Cambridge, Cambridge, United Kingdom,18Division of Rheumatology and Clinical Immunogenetics, University of Texas Health Science Center at Houston, Houston, Texas, United States of America,19 Instituto de Parasitologia y Biomedicina Lopez-Neyra, Consejo Superior de Investigaciones Científicas, Granada, Spain,20Department of Hygiene and Epidemiology, University of Ioannina Medical School, Ioannina, Greece,21Wellcome Trust Centre for Human Genetics, University of Oxford, Oxford, United Kingdom,22Institut für Integrative und Experimentelle Genomik, Universität zu Lübeck, Lübeck, Germany,23Department of Molecular a11111
OPEN ACCESS
Citation:Prins B.P, Abbasi A, Wong A, Vaez A, Nolte I, Franceschini N, et al. (2016) Investigating the Causal Relationship of C-Reactive Protein with 32 Complex Somatic and Psychiatric Outcomes: A Large-Scale Cross-Consortium Mendelian Randomization Study. PLoS Med 13(6): e1001976. doi:10.1371/journal.pmed.1001976
Academic Editor:Phillipa J. Hay, Western Sydney University, AUSTRALIA
Received:June 21, 2015
Accepted:February 3, 2016
Published:June 21, 2016
Copyright:© 2016 Prins et al. This is an open access article distributed under the terms of the
Creative Commons Attribution License, which permits unrestricted use, distribution, and reproduction in any medium, provided the original author and source are credited.
Data Availability Statement:All our data which have been used for this study may be found in S1 Data file.
Funding:Please refer to file S1 Financial Disclosure for full information with regard to funding and financial support. The funders had no role in study design, data collection and analysis, decision to publish, or preparation of the manuscript.
Neuroscience, UCL Institute of Neurology, London, United Kingdom,24McKusick-Nathans Institute of Genetic Medicine and Department of Medicine, Division of Cardiology, Johns Hopkins University School of Medicine, Baltimore, Maryland, United States of America,25NHLBI’s Framingham Heart Study, Center for Population Studies and Harvard Medical School, Framingham, Massachusetts, United States of America, 26Institute of Psychological Medicine and Clinical Neurosciences, School of Medicine, Cardiff University, Cardiff, United Kingdom,27NIHR Barts Cardiovascular Biomedical Research Unit, William Harvey Research Institute, Queen Mary University of London, London, United Kingdom,28MRC Centre for Neuropsychiatric Genetics and Genomics, Institute of Psychological Medicine and Clinical Neurosciences, School of Medicine, Cardiff University, United Kingdom,29Department of Biostatistics, Boston University School of Public Health, Boston, Massachusetts, United States of America,30 Program in Medical and Population Genetics, Broad Institute of Harvard and MIT, Cambridge, Massachusetts, United States of America,31Division of Genetics, Brigham and Women’s Hospital, Harvard Medical School, Boston, Massachusetts, United States of America, 32Division of Rheumatology, Brigham and Women’s Hospital, Harvard Medical School, Boston,
Massachusetts, United States of America,33Partners HealthCare Center for Personalized Genetic Medicine, Boston, Massachusetts, United States of America,34 Faculty of Medical and Human Sciences, University of Manchester, Manchester, United Kingdom,35Department of Biostatistics, University of Michigan, Ann Arbor, Michigan, United States of America,36Department of Epidemiology and Biostatistics, School of Public Health, Imperial College London, London, United Kingdom,37 Department of Pediatrics, Perelman School of Medicine, University of Pennsylvania, Philadelphia, United States of America,38Endocrine Genetics Research Institute, McGill University Health Center, Montreal, Quebec, Canada,39Department of
Rheumatology & Clinical Immunology and Laboratory of Translational Immunology, University Medical Center Utrecht, Utrecht, the Netherlands,40Complex Disease Genetics, Cold Spring Harbor Laboratory, Cold Spring Harbor, New York, United States of America,41 Department of Epidemiology, Erasmus University Rotterdam, University Medical Centre Rotterdam, Rotterdam, the Netherlands,42 Campbell Family Mental Health Research Institute, Centre for Addiction and Mental Health, Toronto, Ontario, Canada,43 Department of Psychiatry, University of Toronto, Toronto, Ontario, Canada,44 Biostatistics Division, Dalla Lana School of Public Health, University of Toronto, Toronto, Ontario, Canada,45 Department of Twin Research and Genetic Epidemiology, King’s College London, London, United Kingdom,46Complex Genetic Section, Department of Medical Genetics, University Medical Center Utrecht, Utrecht, the Netherlands,47 Department of
Biostatistics, University of Liverpool, Liverpool, United Kingdom,48Department of Gastroenterology and Hepatology, University of Groningen, University Medical Center Groningen, Groningen, the Netherlands, 49Clinical Pharmacology, William Harvey Research Institute, Barts and the London School of Medicine, Queen Mary University of London, London, United Kingdom,50Cardiogenetics Lab, Cardiovascular and Cell Sciences Institute, St George’s Hospital Medical School, London, United Kingdom
☯These authors contributed equally to this work.
*[email protected](BPP);[email protected](BZA)
Abstract
Background
C-reactive protein (CRP) is associated with immune, cardiometabolic, and psychiatric traits and diseases. Yet it is inconclusive whether these associations are causal.
Methods and Findings
We performed Mendelian randomization (MR) analyses using two genetic risk scores (GRSs) as instrumental variables (IVs). The first GRS consisted of four single nucleotide
polymorphisms (SNPs) in the CRP gene (GRSCRP), and the second consisted of 18 SNPs
that were significantly associated with CRP levels in the largest genome-wide association
study (GWAS) to date (GRSGWAS). To optimize power, we used summary statistics from
GWAS consortia and tested the association of these two GRSs with 32 complex somatic and psychiatric outcomes, with up to 123,865 participants per outcome from populations of European ancestry. We performed heterogeneity tests to disentangle the pleiotropic effect of IVs. A Bonferroni-corrected significance level of less than 0.0016 was considered
Abbreviations:CAD, coronary artery disease; CCGC, CRP Coronary Heart Disease Genetics Collaboration; CRP, C-reactive protein; CRPPRS,
C-reactive protein polygenic risk score; DBP, diastolic blood pressure; eGFRcr, estimated glomerular
statistically significant. An observedp-value equal to or less than 0.05 was considered nom-inally significant evidence for a potential causal association, yet to be confirmed.
The strengths (F-statistics) of the IVs were 31.92–3,761.29 and 82.32–9,403.21 for
GRSCRPand GRSGWAS, respectively. CRP GRSGWASshowed a statistically significant
pro-tective relationship of a 10% genetically elevated CRP level with the risk of schizophrenia
(odds ratio [OR] 0.86 [95% CI 0.79–0.94];p<0.001). We validated this finding with
individ-ual-level genotype data from the schizophrenia GWAS (OR 0.96 [95% CI 0.94–0.98];p<
1.72 × 10⁻⁶). Further, we found that a standardized CRP polygenic risk score (CRPPRS) at
p-value thresholds of 1 × 10⁻⁴, 0.001, 0.01, 0.05, and 0.1 using individual-level data also
showed a protective effect (OR<1.00) against schizophrenia; the first CRPPRS(built of
SNPs withp<1 × 10⁻⁴) showed a statistically significant (p<2.45 × 10⁻⁴) protective effect
with an OR of 0.97 (95% CI 0.95–0.99). The CRP GRSGWASshowed that a 10% increase in
genetically determined CRP level was significantly associated with coronary artery disease
(OR 0.88 [95% CI 0.84–0.94];p<2.4 × 10⁻⁵) and was nominally associated with the risk of
inflammatory bowel disease (OR 0.85 [95% CI 0.74–0.98];p<0.03), Crohn disease (OR
0.81 [95% CI 0.70–0.94];p<0.005), psoriatic arthritis (OR 1.36 [95% CI 1.00–1.84];p<
0.049), knee osteoarthritis (OR 1.17 [95% CI 1.01–1.36];p<0.04), and bipolar disorder
(OR 1.21 [95% CI 1.05–1.40];p<0.007) and with an increase of 0.72 (95% CI 0.11–1.34;p
<0.02) mm Hg in systolic blood pressure, 0.45 (95% CI 0.06–0.84;p<0.02) mm Hg in
dia-stolic blood pressure, 0.01 ml/min/1.73 m2(95% CI 0.003–0.02;p<0.005) in estimated
glo-merular filtration rate from serum creatinine, 0.01 g/dl (95% CI 0.0004–0.02;p<0.04) in
serum albumin level, and 0.03 g/dl (95% CI 0.008–0.05;p<0.009) in serum protein level.
However, after adjustment for heterogeneity, neither GRS showed a significant effect of
CRP level (atp<0.0016) on any of these outcomes, including coronary artery disease, nor
on the other 20 complex outcomes studied. Our study has two potential limitations: the lim-ited variance explained by our genetic instruments modeling CRP levels in blood and the unobserved bias introduced by the use of summary statistics in our MR analyses.
Conclusions
Genetically elevated CRP levels showed a significant potentially protective causal
relation-ship with risk of schizophrenia. We observed nominal evidence at an observedp<0.05
using either GRSCRPor GRSGWAS—with persistence after correction for heterogeneity—for
a causal relationship of elevated CRP levels with psoriatic osteoarthritis, rheumatoid arthri-tis, knee osteoarthriarthri-tis, systolic blood pressure, diastolic blood pressure, serum albumin, and bipolar disorder. These associations remain yet to be confirmed. We cannot verify any causal effect of CRP level on any of the other common somatic and neuropsychiatric out-comes investigated in the present study. This implies that interventions that lower CRP level are unlikely to result in decreased risk for the majority of common complex outcomes.
Introduction
studies have shown that C-reactive protein (CRP), a well-studied biomarker of inflammation, is associated with and exhibits reliable predictive value for cardiovascular disease [19,20], type 2 diabetes [21], immunity-related disorders such as inflammatory bowel disease (IBD) [22], rheu-matoid arthritis [23], and all-cause mortality [20,24]. Nevertheless, the evidence for a causal involvement of CRP in these outcomes from traditional experimental or observational studies remains controversial [25,26], fueling the debate surrounding whether CRP contributes to the chain of causality in disease mechanisms [27]. The use of genetically informed instrumental var-iables (IVs), termed Mendelian randomization (MR), is a complementary approach to epidemi-ological observations and allows investigation of whether the effect of an exposure (i.e., CRP level) on observed outcome phenotypes is likely to be causal [28].
Recent large-scale MR studies, focusing mainly on cardiovascular disease and metabolic traits, failed to show a causal association between CRP level and these outcomes (S1 Table). This has led to the notion that elevated CRP levels do not causally contribute to these traits and disorders. However, these studies used a single CRP-associated single nucleoid polymorphism (SNP) or a very limited set of CRP-associated SNPs (S1 Table). Common SNPs serving as prox-ies for CRP level represent only a small effect on CRP level per se and thus require a large enough sample size to detect causal effects on the outcome. Moreover, most studies have gener-ally included a limited range of common complex diseases, often not more than two or three outcomes, or they have been performed in a single or small population, yielding inadequate study power (S1 Table). In other words, the evidence for a causal relationship between CRP and a broad range of common traits or diseases remains inconclusive. This is mostly due to the lack of well-powered MR studies that use optimally informative genetic IVs for CRP. Here, we sought to comprehensively examine the hypothesis that genetically determined CRP level directly contributes to common somatic and psychiatric outcomes. To optimize IV power, we applied a MR approach using summary statistics from large-scale genome-wide association study (GWAS) consortia of 32 somatic and psychiatric phenotypes for the fourCRPvariants representing 98% of the common variation in theCRPgene and for the largest known set of independent SNPs known to be associated with CRP. We further aimed to confirm the identi-fied association between CRP and schizophrenia using a CRP polygenic risk score (CRPPRS)
from individual-level genotype data from the largest consortium of schizophrenia to date. We performed an in silico pathway analysis (seeDiscussion) to provide insights into the possible mechanism underlying the observed association of CRP level with schizophrenia.
Methods
Study Design and Rationale
The present MR study consists of two key components. First, we used established gene variants associated with CRP level and combined them to build two genetic risk scores (GRSs) for CRP. The first GRS consisted of only four SNPs in theCRPgene (GRSCRP) selected from the largest
recent MR study of CRP [29], and the second consisted of 18 SNPs that were associated with CRP level at a genome-wide significance level in the largest GWAS for CRP to date (GRSGWAS)
[30]. Second, we obtained summary association statistics from GWAS consortia for a panel of 32 common somatic and psychiatric outcomes (Table 1). BPP and BZA selected the studies, and contacted each consortium with a standardized request for study data, including the name of the study or consortium, the number of cases and controls, the number of available CRP SNPs for GRSCRPand GRSGWAS, and the estimated effect for each SNP (or its proxy) on
neurodegenerative, and psychiatric), including at least 1,566, and up to 184,305, participants per outcome from populations of European ancestry (Table 1). These outcomes were selected based on the following two inclusion criteria: (i) the outcome having been associated with CRP level in epidemiological studies and (ii) availability of large meta-GWAS analyses for the out-come (Table 1).
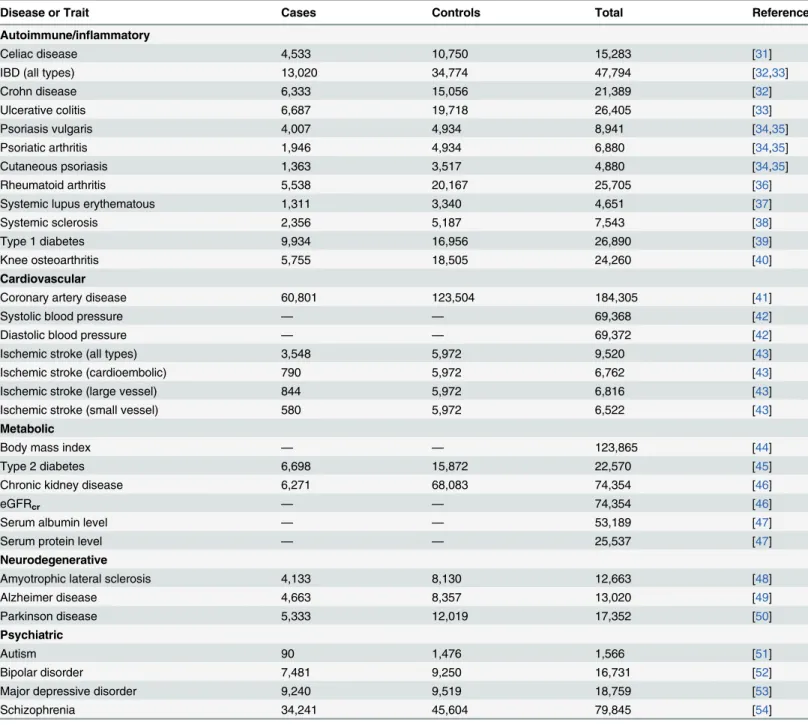
Table 1. Diseases and traits included in this study.
Disease or Trait Cases Controls Total Reference
Autoimmune/inflammatory
Celiac disease 4,533 10,750 15,283 [31]
IBD (all types) 13,020 34,774 47,794 [32,33]
Crohn disease 6,333 15,056 21,389 [32]
Ulcerative colitis 6,687 19,718 26,405 [33]
Psoriasis vulgaris 4,007 4,934 8,941 [34,35]
Psoriatic arthritis 1,946 4,934 6,880 [34,35]
Cutaneous psoriasis 1,363 3,517 4,880 [34,35]
Rheumatoid arthritis 5,538 20,167 25,705 [36]
Systemic lupus erythematous 1,311 3,340 4,651 [37]
Systemic sclerosis 2,356 5,187 7,543 [38]
Type 1 diabetes 9,934 16,956 26,890 [39]
Knee osteoarthritis 5,755 18,505 24,260 [40]
Cardiovascular
Coronary artery disease 60,801 123,504 184,305 [41]
Systolic blood pressure — — 69,368 [42]
Diastolic blood pressure — — 69,372 [42]
Ischemic stroke (all types) 3,548 5,972 9,520 [43]
Ischemic stroke (cardioembolic) 790 5,972 6,762 [43]
Ischemic stroke (large vessel) 844 5,972 6,816 [43]
Ischemic stroke (small vessel) 580 5,972 6,522 [43]
Metabolic
Body mass index — — 123,865 [44]
Type 2 diabetes 6,698 15,872 22,570 [45]
Chronic kidney disease 6,271 68,083 74,354 [46]
eGFRcr — — 74,354 [46]
Serum albumin level — — 53,189 [47]
Serum protein level — — 25,537 [47]
Neurodegenerative
Amyotrophic lateral sclerosis 4,133 8,130 12,663 [48]
Alzheimer disease 4,663 8,357 13,020 [49]
Parkinson disease 5,333 12,019 17,352 [50]
Psychiatric
Autism 90 1,476 1,566 [51]
Bipolar disorder 7,481 9,250 16,731 [52]
Major depressive disorder 9,240 9,519 18,759 [53]
Schizophrenia 34,241 45,604 79,845 [54]
eGFRcr, estimated glomerularfiltration rate from serum creatinine.
Genetic Instruments
Weak IVs yielding insufficient statistical power may have hampered estimation of causal effects of CRP on the outcomes in previous analyses (S1 Table). Our MR approach, by using GWAS data and combining multiple independent SNPs into a GRS (i.e., IV), has the potential to greatly increase power. The selected SNPs have been described elsewhere [30,55,56] and are further detailed inS2–S4Tables. These IVs were used to test the combined effect of the associa-tions of CRP-level-influencing alleles with the outcomes. Our approach was implemented in such a way that the effects of both independent SNPs in theCRPgene (GRSCRP) [55,56] (S1
Methods) and independent SNPs known to be genome-wide significantly associated with CRP levels (GRSGWAS) [30], as well as pleiotropic effects of SNPs, could be discriminated [57].
Plei-otropy exists if CRP SNPs influence exposures (risk factors) other than CRP level and therefore violate one of the key MR assumptions.
Statistical Analysis
All analyses were done using the GRS function implemented in the grs.summary module of the R package Genetics ToolboX (version 2.15.1 for Windows). The grs.summary module approxi-mates the regression of an outcome onto an additive GRS, using only single SNP association summary statistics extracted from GWAS results. The method is described in more detail else-where [58]. In brief, we performed MR analyses using GRS IVs in two steps. First, we used four individualCRPgene SNPs (i.e., IVs) associated with CRP level [56,59] (S2andS3Tables) to create a weighted GRS, named GRSCRP,corresponding to the joint effect of the four SNPs within theCRPgene [55]. We extractedω(the estimated coefficient, or weight) for individual SNPs from association results reported by the CRP Coronary Heart Disease Genetics Collabo-ration (CCGC) [29,55];ωrepresents a one-unit (in mg/l) increase of the natural log of CRP level (lnCRP) per dose of the coded allele. The four tagging SNPs represent 98% of the common variation in theCRPgene, assuming a minor allele frequency of0.05 and anr2threshold of
0.8, and aggregately explain ~2% of the total variation (i.e., phenotypic variance) in serum CRP level in populations of European descent [55,59]. Second, we constructed a multilocus GRS, named GRSGWAS, that combined 18 SNPs associated with serum CRP level at a
genome-wide significance level (p<5×10⁻⁸;S2andS3Tables), derived from a large meta-GWAS analy-sis of CRP conducted by the CHARGE (Cohorts for Heart and Aging Research in Genomic Epidemiology) Consortium [30]. This multilocus GRS explains approximately ~5% of the total variation in serum CRP level [30].
We integratedωfor each CRP SNP from the reference data of CCGC [55] or meta-analysis of GWASs [30] for CRP level with the summary association statistics extracted from the GWAS consortium data for each outcome (S1 Data;S2 Methods). This MR approach using meta-GWAS summary statistics data is equivalent to an inverse-variance-weighted meta-anal-ysis and has previously been validated in comparison to individual-level data [57,60]. To esti-mate the causal effect of CRP level on an outcome, we obtained theβvalues (estimated effects from regression analysis) for the effects of CRP SNPs on the outcome, with standard errors, seβ, from the corresponding GWAS results. Where no summary statistics for a CRP SNP in the
the likelihood function, theαIVvalue and its standard error, seα, can be approximated with the
formulaαffi(Sω×β× seβ−2) /(Sω2× seβ−2), with seαffip1/Sω2× seβ−2. lnCRP was used as
the outcome in reference studies [30,55], so in obtaining theωvalues (i.e., effect sizes) for each of the CRP SNPs, a unit increase in lnCRP equals a 10 symmetric percentage (s%) increase in CRP level, which corresponds to a unit change in the level of a continuous outcome or logit of risk estimate (i.e., beta coefficient) for a dichotomous outcome [61]. TheαIVvalue (i.e., causal estimate) for each CRP SNP is, therefore, presented for each outcome as corresponding to a 10-s% increase in actual CRP level. During the course of this study, an updated, larger GWAS dataset for coronary artery disease (CAD) became publicly available (CARDIoGRAMplusC4D Consortium, release 2015 [41]); we therefore redid the analysis for CAD using the release 2015 data.
To assess which SNPs might have violated the key MR assumption regarding pleiotropy, we performed goodness-of-fit tests to correct both GRSs for the heterogeneity of their correspond-ing SNPs’effects on each outcome. Heterogeneity, which indicates the potential presence of pleiotropy, was measured using theQstatistic and was considered statistically significant at a conservative uncorrectedp-value of<0.05. Although heterogeneity could be an indicator of pleiotropy, there are other factors that could introduce heterogeneity in the analyses. Even though the adjustments for heterogeneity that we have made could be overconservative, we have used this method in order to minimize false positives. After stepwise removal of SNPs with potential pleiotropic effects, we repeated the analyses until significant heterogeneity was no longer observed.
To further ensure the strength of these two GRSs as IVs, we generated anF-statistic for each outcome. We used variance in lnCRP explained by each set of CRP SNPs (2% and 5%, respec-tively, for GRSCRPand GRSGWAS) to calculate theF-statistic using the formulaF-statistic =
[R2× (n−1−K)]/[(1−R2) ×K], whereR2represents the proportion of variability in CRP level that is explained by the GRS,nrepresents sample size, andKrepresents the number of IVs included in model (i.e., for this studyK= 1) [62]. As a rule of thumb, anF-value above ten indi-cates that a causal estimate is unlikely to be biased due to weak instruments [57].
Multiple Testing
The present study included 32 independent sample sets. For each sample set, we did one statis-tical test, for which a global nominal significance level of0.05 was considered as satisfactory to derive conclusions. The need for correction for multiple testing is debatable. Nevertheless, to ensure the validity of our conclusions, we took a conservative approach and applied a Bonfer-roni-corrected significance threshold calculated as 0.05 divided by 32 (i.e., 0.0016). We consid-ered a statistical test with an observedp-value more than 0.05 as a definitely nonsignificant result, i.e., no association; an observedp-value equal to or less than 0.05 as nominally signifi-cant evidence for a potential, but yet to be confirmed, causal association; and an observed p-value equal to or less than 0.0016 as statistically significant evidence for a causal association.
CRP Polygenic Risk Score and Schizophrenia Using Individual-Level
Data
In an ancillary follow-up study, inspired by comments by the editors and the reviewers, we aimed further to determine whether GRSGWASwas causally associated with schizophrenia
excluded from our analysis. To evaluate whether the observed protective causal association between GRSGWASand schizophrenia was persistent, we investigated whether the CRPPRSwas
also protectively associated with schizophrenia. Briefly, CRPPRSvalues were calculated for each
individual by summing the total effect of the SNP dosages by their effect size. In addition to the 18 genome-wide significant CRP SNPs, we grouped subthreshold CRP-associated SNPs at the followingp-value thresholds: 1 × 10⁻⁴, 0.001, 0.01, 0.05, and 0.1. Standardized CRPPRSvalues
were tested for association with schizophrenia case status in each cohort with adjustment for ten principal components (PCs). A fixed effects inverse-variance-weighted meta-analysis was performed across all 36 cohorts to obtain the overall effect size estimate as explained inS4 Methodsand elsewhere [63]. The variance in schizophrenia case status explained by CRPPRS
was estimated using the deviation in Nagelkerke’s pseudo-R2between a null model (which included ten PCs) and the full model (which included GRS in addition to the ten PCs), calcu-lated in R using the Functions for Medical Statistics Book with Some Demographic Data (fmsb) R package (S3 Methods). Similar to previous studies, the statistical significance of CRPPRSvalues was estimated based on their logistic regression coefficient [64], and reported
CRPPRSORs correspond to a 1-SD increase in CRPPRS[65].
Results
Using GRSCRP, we first tested whether aCRP-gene-determined increase in lnCRP was
associ-ated with each outcome. InTable 2, the causal effects of lnCRP estimated for each outcome are summarized. We found no heterogeneity in the IV analyses (pheterogeneity0.11 for all out-comes), and GRSCRPwas a strong instrument (F31). IV analyses provided nominal evidence
for potential causal relationships of lnCRP with risk of Crohn disease (OR 0.78 [95% CI 0.65– 0.94];p<0.009), psoriatic arthritis (1.45 [1.04–2.04];p<0.03), and schizophrenia (0.90 [0.82–0.99];p<0.03), and with an increase in systolic blood pressure (SBP) (mean increase 1.23 mm Hg per 10-s% increase in CRP level [95% CI 0.45–2.01];p<0.002) and diastolic blood pressure (DBP) (0.70 [0.20–1.19];p<0.006). GRSCRPshowed no significant effect on
any of the other outcomes (Table 2;S1 Fig).
GRSGWASshowed a statistically significant protective effect of lnCRP on the risk of
schizo-phrenia (per 10-s% increase in CRP level, OR 0.86 [95% CI 0.79–0.94];p<0.0010) (Figs1and
S1;Table 3). In a follow-up analysis using the individual-level PGC data, we found that a GRS incorporating the same 18 CRP SNPs used to construct the GRSGWASwas again significantly
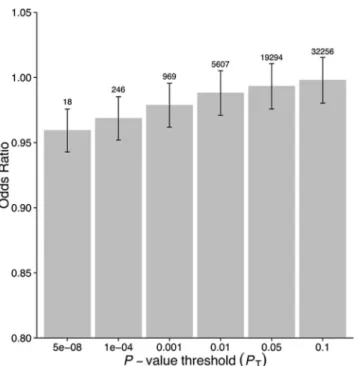
associated with a lower risk of schizophrenia (OR 0.96 [95% CI 0.94–0.98];p<1.72 × 10⁻⁶). This signal persisted when we included all SNPs meeting a less stringentp-value threshold of 1 × 10⁻⁴(OR 0.97 [95% CI 0.95–0.99];p<2.45 × 10⁻⁴). At less stringentp-value thresholds, less variance was explained by the logistic model, and the protective effect of CRP risk scores became less significant, but across allp-value thresholds, the direction of the effect was consis-tently protective (Figs2and3). To ensure that the association between risk alleles for CRP and schizophrenia was not driven by a small number of genome-wide significant SNPs, we per-formed a leave-one-out sensitivity analysis of the 18 genome-wide SNPs. In the 18 sets of 17 SNPs, the variance explained (Nagelkerke’s pseudo-R2) ranged from 0.012% to 0.034%, with p-values ranging from 9.3 × 10⁻⁵to 1.6 × 10⁻², suggesting that the protective effect observed between risk alleles for CRP and schizophrenia was not driven by a small number of SNPs with large effects.
GRSGWASalso showed moderate but nominally significant effects of lnCRP on the risk of
Table 2. The effect of the CRP genetic risk score instrument of four SNPs in CRP (GRSCRP) with somatic and neuropsychiatric outcomes.
Disease or Trait M N Effect Size (95% CI)1 Goodness-of-Fit Testp-Value p-Het F-Value
Autoimmune/inflammatory
Celiac disease 3 15,283 0.96 (0.77 to 1.21) 0.750 0.19 311.86
IBD (all types) 3 47,794 0.97 (0.84 to 1.13) 0.700 0.30 975.35
Crohn disease 4 21,389 0.78 (0.65 to 0.94) 0.009 0.25 436.47
Ulcerative colitis 4 26,405 1.10 (0.92 to 1.31) 0.290 0.92 538.84
Psoriasis vulgaris 4 8,941 1.23 (0.96 to 1.57) 0.110 0.95 182.43
Psoriatic arthritis 4 6,880 1.45 (1.04 to 2.04) 0.030 0.92 140.37
Cutaneous psoriasis 4 4,880 1.10 (0.76 to 1.59) 0.620 0.60 99.55
Rheumatoid arthritis 4 25,702 0.94 (0.77 to 1.15) 0.550 0.17 524.55
Systemic lupus erythematous 3 4,651 1.20 (0.80 to 1.81) 0.380 0.19 94.88
Systemic sclerosis 3 7,518 1.07 (0.78 to 1.45) 0.680 0.85 153.90
Type 1 diabetes 2 26,890 1.15 (0.90 to 1.47) 0.260 0.34 548.73
Knee osteoarthritis 4 24,260 0.94 (0.78 to 1.13) 0.500 0.23 495.06
Cardiovascular
CAD 4 184,305 1.00 (0.93 to 1.07) 0.965 0.65 1,775.37
SBP2 4 69,372 1.23 (0.45 to 2.01) 0.002 0.51 1,415.63
DBP2 4 69,368 0.70 (0.2x to 1.19) 0.006 0.68 1,415.71
Ischemic stroke (all types) 4 9,520 1.19 (0.93 to 1.53) 0.160 0.93 194.24
Ischemic stroke (cardioembolic) 4 6,762 1.02 (0.65 to 1.58) 0.940 0.96 137.96
Ischemic stroke (large vessel) 4 6,816 1.44 (0.93 to 2.21) 0.100 0.31 139.06
Ischemic stroke (small vessel) 4 6,552 1.18 (0.71 to 1.95) 0.520 0.36 133.06
Metabolic
Body mass index3 4 123,864 −0.017 (−0.06 to 0.02) 0.410 0.50 2,527.82
Type 2 diabetes 4 22,570 1.11 (0.94 to 1.32) 0.230 0.50 460.57
Chronic kidney disease 4 74,354 1.04 (0.88 to 1.22) 0.670 0.90 1,517.39
eGFRcr4 4 74,354 0.004 (−0.01 to 0.02) 0.400 0.88 1,517.39
Serum albumin level5 4 53,189 −0.002 (−0.02 to 0.01) 0.770 0.88 1,085.45
Serum protein level5 4 25,537 0.008 (−0.02 to 0.04) 0.640 0.12 521.12
Neurodegenerative
Amyotrophic lateral sclerosis 2 12,263 0.79 (0.60 to 1.04) 0.090 0.23 258.39
Alzheimer disease 2 13,020 1.26 (0.89 to 1.78) 0.200 0.11 265.67
Parkinson disease 3 17,352 1.00 (0.85 to 1.17) 0.960 0.33 354.08
Psychiatric
Autism 3 1,566 1.02 (0.97 to 1.07) 0.380 0.69 31.92
Bipolar disorder 4 16,731 1.17 (0.97 to 1.42) 0.110 0.49 341.41
Major depressive disorder 3 18,759 0.98 (0.81 to 1.18) 0.810 0.86 382.80
Schizophrenia 3 79,845 0.90 (0.82 to 0.99) 0.030 0.79 1,629.45
1Effect size (95% CI) per 1-mg/l increase in lnCRP. For risk of disease, effect size is given as an OR, otherwise given in the specific units in which the
outcome was measured. Derived from the IV causal estimatorα.
2Effect size unit is millimeters of mercury per 1-mg/l increase in lnCRP.
3Effect size unit is standard deviations per 1-mg/l increase in lnCRP (the body mass index results were inverse normal transformed to a distribution withμ
= 0 andσ= 1).
4Effect size unit is milliliters/minute/1.73 m2per 1-mg/l increase in lnCRP. 5Effect size unit is grams/deciliter per 1-mg/l increase in lnCRP.
eGFRcr, estimated glomerularfiltration rate from serum creatinine;F-value,F-statistic value for the genetic instrument;M, number of markers used in the
genetic instrument;N, number of samples in the disease/trait meta-analysis;p-het,p-value of heterogeneity of effect test.
Fig 1. Genetic risk score GRSGWASfor schizophrenia.Thex-axis shows the effect size for the 15 SNPs for which data were available in the PGC
schizophrenia dataset comprising the GRSGWASinfluencing levels of CRP, with corresponding standard error bars. They-axis shows the log OR of the GRSGWASSNPs for schizophrenia (SCZ) with corresponding standard error bars. The effect estimate of CRP level on disease risk is represented by the red solid line, with gradientα. The 95% CI of thisαestimate is represented by the grey dashed lines. The included SNPs are shown by Arabic
numbering: #1, rs2847281 (gene:PTPN2; chromosome: 18; basepair position: 12811593); #2, rs340029 (RORA; 15; 58682257); #3, rs6901250 (GPRC6A; 6; 117220718); #4, rs10745954 (ASCL1; 12; 102007224); #5, rs4705952 (IRF1; 5; 131867517); #6, rs12037222 (PABPC4; 1; 39837548); #7, rs12239046 (NLRP3; 1; 245668218); #8, rs6734238 (IL1F10; 2; 113557501); #9, rs13233571 (BCL7B; 7; 72609167); #11, rs1260326 (GCKR; 2; 27584444); #12, rs4129267 (IL6R; 1; 152692888); #13, rs1800961 (HNF4A; 20; 42475778); #14, rs4420065 (LEPR; 1; 5934049); #15, rs10521222 (SALL1; 16; 49716211); 12; 119905190); #17, rs2794520 (CRP; 1; 157945440). The three SNPs of #10, rs9987289 (PPP1R3B; 8; 9220768); #16, rs1183910 (HNF1A; and #18, rs4420638 (APOC1; 19; 50114786) were not present in the data of the PGC.
Table 3. The effect of the CRP genetic risk score instrument of 18 SNPs associated with CRP (GRSGWAS) on somatic and neuropsychiatric outcomes.
Disease or Trait M Effect Size (95% CI)1 Goodness-of-Fit Testp-Value p-Het F-Value
Autoimmune/inflammatory
Celiac disease 18 0.99 (0.85 to 1.16) 0.930 7.2 × 10⁻⁴ 804.26
IBD (all types) 15 0.85 (0.74 to 0.98) 0.030 1.4 × 10⁻⁵ 2,515.37
Crohn disease 17 0.81 (0.70 to 0.94) 0.005 4.4 × 10⁻⁷ 1,125.63
Ulcerative colitis 17 1.05 (0.91 to 1.21) 0.490 0.01 1,389.63
Psoriasis vulgaris 17 1.12 (0.90 to 1.40) 0.310 0.19 470.47
Psoriatic arthritis 17 1.36 (1.00 to 1.84) 0.049 0.04 362.00
Cutaneous psoriasis 17 1.00 (0.72 to 1.39) 0.990 0.16 256.74
Rheumatoid arthritis 18 0.93 (0.80 to 1.08) 0.350 1.8 × 10⁻⁶ 1,352.79
Systemic lupus erythematous 11 1.06 (0.71 to 1.58) 0.780 0.27 244.68
Systemic sclerosis 11 0.84 (0.62 to 1.14) 0.280 0.63 396.89
Type 1 diabetes 15 1.10 (0.92 to 1.31) 0.310 3.47 × 10⁻³ 1,415.16
Knee osteoarthritis 18 1.17 (1.01 to 1.36) 0.040 0.10 1,276.74
Cardiovascular
CAD 18 0.88 (0.84 to 0.94) 2.4 × 10⁻⁵ 7.5 × 10⁻¹² 9,403.21
SBP2 18 0.72 (0.11 to 1.34) 0.020 0.14 3,650.84
DBP2 18 0.45 (0.06 to 0.84) 0.020 0.02 3,651.05
Ischemic stroke (all types) 18 1.06 (0.87 to 1.29) 0.570 0.37 500.95
Ischemic stroke (cardioembolic) 18 0.98 (0.69 to 1.39) 0.920 0.35 355.79
Ischemic stroke (large vessel) 18 1.30 (0.92 to 1.82) 0.140 0.97 358.63
Ischemic stroke (small vessel) 18 0.85 (0.58 to 1.25) 0.420 0.76 343.16
Metabolic
Body mass index3 18 −0.005 (−0.03 to 0.02) 0.740 0.11 6,519.11
Type 2 diabetes 18 1.090 (0.95 to 1.24) 0.210 1.8 × 10⁻³ 1,187.79
Chronic kidney disease 18 0.960 (0.84 to 1.09) 0.500 0.07 3,913.26
eGFRcr4 18 0.011 (0.003 to 0.02) 0.005 7.2 × 10⁻⁹ 3,913.26
Serum albumin level5 18 0.011 (0.0004 to 0.02) 0.041 2.3 × 10⁻¹⁸ 2,799.32
Serum protein level5 18 0.031 (0.008 to 0.05) 0.009 0.03 1,343.95
Neurodegenerative
Amyotrophic lateral sclerosis 8 1.01 (0.79 to 1.29) 0.960 0.56 666.37
Alzheimer disease 11 1.26 (0.99 to 1.61) 0.060 0.23 685.16
Parkinson disease 10 1.06 (0.90 to 1.25) 0.500 0.50 913.16
Psychiatric
Autism 9 0.89 (0.70 to 1.13) 0.350 0.99 82.32
Bipolar disorder 18 1.21 (1.05 to 1.40) 0.007 0.15 880.47
Major depressive disorder 15 1.14 (0.96 to 1.36) 0.140 0.84 987.21
Schizophrenia 15 0.86 (0.79 to 0.94) 0.001 0.66 4,202.26
1Effect size (95% CI) per 1-mg/l increase in lnCRP. For risk of disease, effect size is given as an OR, otherwise given in the specific units in which the
outcome was measured. Derived from the IV causal estimatorα.
2Effect size unit is millimeters of mercury per 1-mg/l increase in lnCRP.
3Effect size unit is standard deviations per 1-mg/l increase in lnCRP (the body mass index results were inverse normal transformed to a distribution withμ
= 0 andσ= 1).
4Effect size unit is milliliters/minute/1.73 m2per 1-mg/l increase in lnCRP. 5Effect size unit is grams/deciliter per 1-mg/l increase in lnCRP.
eGFRcr, estimated glomerularfiltration rate from serum creatinine;F-value,F-statistic value for the genetic instrument;M, number of markers used in the
genetic instrument;p-het,p-value of heterogeneity of effect test.
Fig 2. Polygenic risk scores for elevated CRP level and protective effect on schizophrenia, using individual-level genetic data.
doi:10.1371/journal.pmed.1001976.g002
Fig 3. Polygenic risk scores for elevated CRP level and explained variance of schizophrenia using individual-level genetic data.
for CAD (0.88 [0.84–0.94];p<2.4 × 10⁻⁵) (Table 3; Figs4andS1). GRSGWASrevealed a
nomi-nally significant effect of lnCRP on blood pressure: an increase of 0.72 (95% CI 0.11–1.34;p<
0.02) and 0.45 (0.06–0.84;p<0.02) mm Hg in SBP and DBP, respectively (Table 3;S1 Fig). Likewise, a genetically determined 10-s% increase in CRP level was nominally associated with a 0.01 ml/min/1.73 m2(95% CI 0.003–0.02;p<0.005) higher estimated glomerular filtration rate from serum creatinine (eGFRcr), a 0.01 g/dl (0.0004–0.02;p<0.04) higher serum albumin level, and a 0.03 g/dl (0.008–0.05;p<0.009) higher serum protein level. The remaining out-comes tested for causal associations using GRSGWASdid not reach statistical significance,
though the corresponding GRSGWASproved to be a strong IV, withF-values82 (Table 3;S1
Fig).
Using GRSGWAS, there was no significant evidence of heterogeneity of the effect size for
knee osteoarthritis, bipolar disorder, schizophrenia, or SBP, while the heterogeneity test was statistically significant for psoriatic arthritis, IBD, Crohn disease, CAD, DBP, eGFRcr, serum albumin, and serum protein. These heterogeneities in the effects of GRSGWASmay be
attribut-able to pleiotropic effects of the SNPs used to build the GRSGWAS. We subsequently performed
a stepwise removal of SNPs from GRSGWASuntil no significant heterogeneity remained
(Table 4). This adjustment in the GRSGWASresulted in the removal of three SNPs from the
GRSGWASfor IBD (inGCKR,IRF1, andPTPN2), five SNPs from the GRSGWASfor Crohn
dis-ease (inGCKR,IL6R,IRF1,PABPC4, andPTPN2), one SNP from the GRSGWASfor psoriatic
arthritis (inIRF1), three SNPs for CAD (inAPOC1,HNF1A, andIL6R), one SNP from the GRSGWASfor DBP (inPABPC4), two SNPs from the GRSGWASfor eGFRcr(inLEPRand
GCKR), six SNPs from the GRSGWASfor serum albumin level (inAPOC1,BCL7B,GCKR,
PPP1R3B,PTPN2, andIRF1), and one SNP from the GRSGWASfor serum protein level (in
GCKR). After removal of these variants from the GRSGWAS, we found no statistically significant
(atp<0.0016) association between genetically increased lnCRP level and any of these out-comes (Table 4). However, the effect estimate of CRP on DBP, serum albumin, and psoriatic arthritis showed nominal association atp<0.05. For example, for DBP, 17 SNPs remained in the GRSGWASand yielded a slightly lower causal estimate (compared to the values before
adjustment) of a 0.39 (95% CI−0.01 to 0.78) mm Hg increase in DBP per 10-s% increase in lnCRP level, with a nominal significance ofp<0.05.
Likewise, we hypothesized that the fact that GRSGWASshowed a nonsignificant effect of
CRP on celiac disease, ulcerative colitis, rheumatoid arthritis, type 1 diabetes, and type 2 diabe-tes can be to some extent explained by the significant heterogeneity observed for these out-comes (Table 3). The stepwise adjustment in the GRSGWASresulted in the removal of two SNPs
from the GRSGWASfor celiac disease (inPABPC4andPTPN2), one SNP from the GRSGWASfor
ulcerative colitis (inGCKR), five SNPS from the GRSGWASfor rheumatoid arthritis (inHNF4A,
IL6R, SALL1,NLRP3, andPTPN2), one SNP from the GRSGWASfor type 1 diabetes (in
PTPN2), and one SNP from the GRSGWASfor type 2 diabetes (inAPOC1). After adjusting for
heterogeneity, the association of GRSGWASwith these outcomes remained statistically
nonsig-nificant (Table 4).
Discussion
In this large-scale cross-consortium MR study of 32 complex outcomes, we found evidence for a potential protective causal relationship between elevated CRP level and schizophrenia in both genetic IVs (i.e., GRSCRPand GRSGWAS) and confirmed this protective relationship in
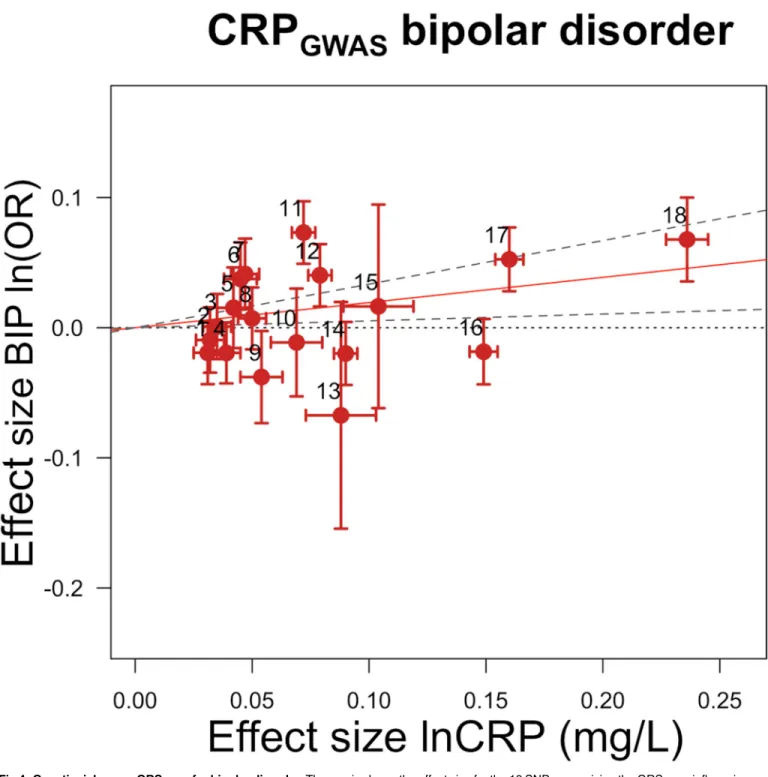
Fig 4. Genetic risk score GRSGWASfor bipolar disorder.Thex-axis shows the effect size for the 18 SNPs comprising the GRSGWASinfluencing levels of CRP, with corresponding standard error bars. They-axis shows the log OR of the GRSGWASSNPs for bipolar disorder (BIP) with
corresponding standard error bars. The effect estimate of CRP level on disease risk is represented by the red solid line, with gradientα. The 95% CI of thisαestimate is represented by the grey dashed lines. The included SNPs are shown by Arabic numbering: #1, rs2847281 (gene:PTPN2;
chromosome: 18; basepair position: 12811593); #2, rs340029 (RORA; 15; 58682257); #3, rs6901250 (GPRC6A; 6; 117220718); #4, rs10745954 (ASCL1; 12; 102007224); #5, rs4705952(IRF1; 5; 131867517); #6, rs12037222 (PABPC4; 1; 39837548); #7, rs12239046 (NLRP3; 1; 245668218); #8, rs6734238 (IL1F10; 2; 113557501); #9, rs13233571 (BCL7B; 7; 72609167); #10, rs9987289 (PPP1R3B; 8; 9220768); #11, rs1260326 (GCKR; 2; 27584444); #12, rs4129267 (IL6R; 1; 152692888); #13, rs1800961 (HNF4A; 20; 42475778); #14, rs4420065 (LEPR; 1; 5934049); #15, rs10521222 (SALL1; 16; 49716211); #16, rs1183910 (HNF1A; 12; 119905190); #17, rs2794520 (CRP; 1; 157945440); #18, rs4420638 (APOC1; 19; 50114786).
arthritis, knee osteoarthritis, SBP, DBP, eGFRcr, serum albumin level, serum protein level, and bipolar disorder, using GRSGWASas an IV. However, after adjustment for heterogeneity,
nei-ther GRS showed a significant effect (atp<0.0016) of CRP level on any of these outcomes, including CAD, nor on the 20 other common somatic and psychiatric outcomes we investi-gated, including celiac disease, ulcerative colitis, psoriasis (all types), rheumatoid arthritis, sys-temic lupus erythematous, syssys-temic sclerosis, type 1 and 2 diabetes, stroke (all types), body mass index, chronic kidney disease, amyotrophic lateral sclerosis, Alzheimer disease, Parkinson disease, autism, and major depressive disorder.
CRP Protection against Schizophrenia
Strikingly, as opposed to the current literature and previous inconclusive small-scale studies [66–68], our findings suggest that genetically elevated levels of CRP are not predisposing but in fact protective for schizophrenia. The significant causal protective role of CRP for schizophre-nia was consistent in both IVs using summary statistics, i.e., GRSCRPand GRSGWAS. When
incorporating 18 genome-wide CRP-associated SNPs using individual-level data, we confirmed a modest, but significant, protective effect of CRP level for schizophrenia. This signal persisted when we included all SNPs meeting a less stringentp-value threshold of 1×10⁻⁴. Notably, the leave-one-out sensitivity analysis revealed that the genetic overlap between CRP level and schizophrenia we observed at genome-wide and 1×10⁻⁴significance thresholds was not driven by a few major SNPs. In contrast, others have previously shown that CRP levels are signifi-cantly elevated in patients with schizophrenia [69,70], with a recent meta-analysis concluding
Table 4. The effect of the CRP genetic risk score instrument of 18 SNPs associated with CRP (GRSGWAS) on somatic and neuropsychiatric out-comes after correcting for heterogeneity.
Disease or Trait M Effect Size (95% CI)1 Goodness-of-Fit Testp-Value p-Het
Autoimmune/inflammatory
Celiac disease 16 1.05 (0.90 to 1.23) 0.56 0.10
IBD 12 0.92 (0.79 to 1.06) 0.24 0.14
Crohn disease 12 0.93 (0.79 to 1.08) 0.34 0.12
Ulcerative colitis 16 1.11 (0.96 to 1.28) 0.16 0.12
Psoriatic arthritis 16 1.42 (1.05 to 1.94) 0.02 0.14
Rheumatoid arthritis 13 0.83 (0.71 to 0.97) 0.02 0.09
Type 1 diabetes 14 1.06 (0.89 to 1.27) 0.52 0.07
Cardiovascular
CAD 15 0.98 (0.91 to 1.06) 0.65 0.20
DBP2 17 0.385 (0.008 to 0.78) 0.05 0.09
Metabolic
Type 2 diabetes 17 0.95 (0.82 to 1.10) 0.52 0.09
eGFRcr3 16 0.001 (−0.007 to 0.01) 0.74 0.11
Serum albumin level4 12 −0.017 (−0.03 to−0.004) 0.01 0.07
Serum protein level4 17 0.021 (−0.002 to 0.05) 0.07 0.31
1Effect size (95% CI) per 1-mg/l increase in lnCRP. For risk of disease, effect size is given as an OR, otherwise given in the specific units in which the
outcome was measured. Derived from the IV causal estimatorα.
2Effect size unit is millimeters of mercury per 1-mg/l increase in lnCRP. 3Effect size unit is milliliters/minute/1.73 m2per 1-mg/l increase in lnCRP. 4Effect size unit is grams/deciliter per 1-mg/l increase in lnCRP.
M, number of markers used in the genetic instrument;p-het,p-value of heterogeneity of effect test.
that the association between elevated CRP and schizophrenia is indeed robust [71]. Given that clinical studies report elevated CRP levels in schizophrenia, one would expect to find that alleles for elevated CRP would confer an increased risk for schizophrenia. The fact that we found the completely opposite effect—in a cohort of over 25,000 cases and 30,000 controls— should give one pause when deriving clinical meaning from these results. Our observation that a genetically determined marginal increase in the level of CRP is likely to be protective for schizophrenia may fuel the debate about whether the observed CRP elevation in schizophrenia is a by-product of the pathogenesis of schizophrenia or directly contributing to clinical mani-festations of the disorder [6]. Our finding may also point out potential biases in previous stud-ies regarding the causes of elevated CRP levels in patients with schizophrenia, such as reverse causality and/or pleiotropic effects within chosen instruments.
The exact mechanism for how elevated CRP levels are linked to schizophrenia requires a well-defined experimental analysis. In addition to CRP variants, other recent studies have iden-tified several inflammatory genetic variants associated with schizophrenia and bipolar disorder, which include variants in the major histocompatibility complex (MHC) region on Chromo-some 6p21 [72]—harboring many cytokine genes [54,73–76]—and in theIL10promoter [77],
TNFpromoter [78],IL1B[79], and C4 [80].
Biological Annotation
Following comments made by the reviewers, we explored the possible underlying pathways that may explain the potential protective causal association between CRP and schizophrenia. We performed a follow-up in silico functional pathway analysis using a previously reported approach [81] as summarized inS5 MethodsandS4–S13Tables. In brief, our results show that pathways associated with the interferon response are significantly enriched amongst genes har-bored by CRP loci and their associated expression quantitative trait loci (eQTLs) and that there are differentially expressed genes between schizophrenia cases and controls. Previous studies showed that the induction of T cell IFN cytokine release stimulates microglia and astrocytes to facilitate glutamate clearance in neuronal cells without evoking inflammatory mediators [82,83]. One could speculate that CRP-interferon pathways may induce neuroprotection by contributing to glutamate clearance, leading to the protection of neurons against the oxidative stress associated with an excess of glutamate [84,85], and thereby offering a protective effect against schizophrenia.
CRP GRS
GWASAssociation with Bipolar Disorder
As for bipolar disorder, we found a nominal effect of a 1.21-fold increase in risk for bipolar dis-order with a 10-s% increase in CRP level. Though this nominal predisposing effect needs to be confirmed, our finding corroborates epidemiological observations suggesting that elevated CRP is associated with the disease and supports a potential causal influence of general inflam-mation in bipolar disorder [86]. We note that, though it may be biologically sensible, this result failed to pass multiple testing correction. Confirmation by replication in independent cohorts, functional follow-up analyses, or the use of a stronger CRP GRSGWASin upcoming studies is
required to draw a definitive conclusion.
CRP GRS
GWASAssociation with Blood Pressure and Hypertension
in line with numerous epidemiological studies that have highlighted an association between elevated CRP and an increased risk of hypertension. For instance, one study found an associa-tion between CRP loci and hypertension in Asian individuals [87]. An additional line of sup-port for a possible causal association of CRP and blood pressure comes from an experimental study in which an increase inCRPgene expression in mice, and subsequently CRP protein lev-els, led to a rise in SBP particularly [88]. Moreover, an ex vivo study by Zhou et al. showed that combining IL6 treatment and mechanical strain leads to a consistent increase in CRP expres-sion at the protein and mRNA levels in smooth muscle cells [89]. Both inflammatory factors and local mechanical strains are abundant in blood vessels and are well-known risk factors for high blood pressure. Our finding did not reach a statistically significant level after correction for multiple testing; thus, it may echo previous MR studies that have failed to find a causal rela-tionship between CRP level and blood pressure or hypertension in Europeans [90,91]. How-ever, our systematic literature review showed that previous studies had some limitations (S1 Table). For instance, no study used a refined GWAS set of 18 CRP-associated SNPs; instead, they tested single or a limited set of CRP SNPs. Using such instruments might have led to biased estimates as their corresponding effects on CRP levels have been found to be small [30,57]. A combination of weak instruments and small sample sizes might have led to type II error [28,57] and hence to a conclusion of no causal association between CRP and blood pres-sure traits in previous studies. When all of the evidence is taken together, a direct link between CRP and blood pressure remains to be elucidated, though our nominal associations between GRSCRPand GRSGWASand blood pressure do add to a line of findings from experimental
stud-ies suggesting a potential causal relationship between CRP and blood pressure.
CRP GRS
GWASAssociation with Osteoarthritis
Our nominally significant finding that CRP might be a potential causal factor for knee osteoar-thritis (using GRSGWAS) should be interpreted with caution. In line with our findings, we have
previously shown that levels of CRP were higher in women with early radiological knee osteo-arthritis (i.e., Kellgren-Lawrence grade 2+) and in women whose disease progressed [92]. Addi-tionally, another study showed that genetically elevated CRP levels contribute to osteoarthritis severity [93]. However, other studies have found contrasting results [71,72,94]. One systematic review provided evidence that the relationship between CRP and osteoarthritis does exist but is dependent on body mass index [95]. It remains to be further investigated whether weight gain over the lifetime mediates the potential causal association between genetically elevated CRP and knee osteoarthritis.
CRP GRS
GWASShows No Association with Other Remaining Outcomes
The present study was able to calculate nominal causal estimates for IBD, Crohn disease, psori-atic arthritis, CAD, eGFRcr, serum albumin level, and serum protein level using CRP GRSGWAS,
but the estimates were altered by removal of SNPs from GRSGWASbased on heterogeneity tests,
resulting in nominal or nonsignificant associations. These outcomes appeared therefore to have heterogeneity in the causal estimates, suggesting that these observed estimates were biased, likely due to pleiotropic effects of CRP loci. These results corroborate negative findings of previous studies (S1 Table), suggesting that a causal role of CRP in these traits and diseases is unlikely.
Methodological Concerns and Advantages
Pleiotropic biases in Mendelian randomization analyses using CRP GRSGWAS. A
heterogeneity sources was able to indicate and exclude several already known pleiotropic loci from the GRSGWASIV. For instance, the use of a SNP inIL6R(rs4129267), amongst others,
resulted in heterogeneity of effects on CAD risk. The same variant contributed to heterogeneity of effects for Crohn disease in our study, and it has been shown that this SNP is associated with levels of biomarkers other than CRP [56]. Further, a MR study found thatIL6RSNPs, specifi-cally the nonsynonymous SNP rs8192284, are associated with CAD risk and CRP levels [96]. Our selectedIL6RSNPs, namely rs4537545 and rs4129267, are in extremely high linkage dis-equilibrium with rs8192284 (r20.96 for both SNPs in HapMap data, CEU population). Car-riers of the risk allele of rs8192284 have higher CRP, IL6, and fibrinogen levels [96]. Fibrinogen is also a well-known risk factor for CAD. Therefore, it is unclear so far which biomarker(s) mediates the effect ofIL6RSNPs on CAD. Besides theIL6locus,APOC1andPABPC4have been indicated as pleiotropic in three out of 32 our investigated outcomes, andPTPN2and
GCKRin six. With this information taken together, we were able to disentangle at least part of the pleiotropy regarding the causal estimates of CRP for outcomes. Again, we found no signifi-cant association of CRP GRSGWASwith IBD, Crohn disease, psoriatic arthritis, CAD, eGFRcr,
serum albumin level, and serum protein level after adjustment for heterogeneity.
Using summary statistics of large-scale consortia. It is of utmost interest whether the
observed effect of CRP as a risk predictor for human disease is causal, and thus whether reduc-tion of CRP levels will lower the risk of disease. Here, we investigated the causality of CRP in 32 phenotypes by leveraging very large sample sizes collected by GWAS consortia, an approach that was much better powered than most previous MR studies. We found that genetically ele-vated CRP levels approximated by powerful instruments did not appear to contribute directly to most of the studied somatic and psychiatric outcomes. Our findings are consistent with pre-vious MR studies reporting null associations of genetically elevated CRP levels with inflamma-tion-related outcomes including CAD [56,59,97], type 2 diabetes [98], high body mass index [99], Alzheimer disease, and depression [100]. All previous MR studies were substantially lim-ited to a single or a few outcomes, used only SNPs in theCRPgene, or had sample sizes much smaller than that of the present study (S1 Table). In addition to these studies, the current GWAS data do not corroborate epidemiological observations suggesting that elevated CRP lev-els are associated with amyotrophic lateral sclerosis [101], Alzheimer disease [102], Parkinson disease [103], and major depressive disorder [104]. Furthermore, patients with immunity-related disorders frequently have a very high CRP level (as high as 100 mg/l) due to their dis-ease status. Our findings may therefore more favorably indicate reverse causality. Taken together, these results show that CRP is highly unlikely to contribute causally to most of the major common somatic and neuropsychiatric outcomes that were investigated in the present study, with the possible exception of schizophrenia.
Strength of instrumental variables. The results presented inTable 2show that our
GRSCRPis not a weak instrument, as indicated by its highF-values owing to the large sample
sizes of available outcomes from GWASs for the phenotypes under study. The strength of our instrument increased considerably in all disease classes when we used variants of multiple loci associated with CRP in GWASs. However, the variants comprising the CRP GRSGWASexplain
Using summary statistics instead of individual-level data. Here we used summary asso-ciation statistics obtained from previously conducted meta-GWASs in order to maximize our study power. One may argue this may induce bias compared to when one uses individual-level data. Nevertheless, previous studies showed high agreement in results from MR methods using GWAS summary data and individual-level data [60,107]; Furthermore, our analyses of individ-ual-level data for schizophrenia led to the same conclusion as our analyses using summary sta-tistics data, confirming the robustness of our methodological approach.
Other potential sources of bias. An important rationale for MR is that the gene variants
do not change over time and are inherited randomly. Thus, the genetic variants are considered free from confounding and reverse causation [108]. However, one cannot completely control for the possibility of confounding of genotype–intermediate phenotype–disease associations. For instance, there could be a confounding effect by ethnic/racial group (i.e., population strati-fication), but this is unlikely to be a major problem in most situations [108]. In the present study, we included summary statistics data from highly credible results of meta-GWASs. All the original meta-GWASs corrected for population stratification in cohort-level analyses and at meta-GWAS level.
Another caveat of MR is that developmental compensation might occur, through a genotype being expressed during fetal development that in turn buffers the effects of either environmen-tal or genetic factors, a process called canalization [108,109]. Therefore, buffering mechanisms could hamper the associations between genetic variants and the outcome of interest. As opposed to this, a lifetime exposure to a risk factor may enhance its effects on the disease [109]. However, it is not clear to what extent genetically determined small changes in any given expo-sure would be sufficient to induce compensation [108].
All 32 of the meta-GWASs from which instrument summary estimates were taken were per-formed in individuals of European descent in Europe and the US and included thousands of samples for each outcome (S1 Table), which was also the case for our previous CRP meta-GWAS from which we chose the CRP-associated SNPs to calculate GRSGWAS. Therefore, the
results of this MR study are applicable to individuals of European descent and are not necessar-ily generalizable to other ethnic groups.
Conclusion
We showed that elevated CRP levels driven by genetic factors are causally associated with pro-tection against schizophrenia, suggesting that CRP may be one important puzzle piece that leads to an improved understanding of the pathogenesis of schizophrenia. We observed nominal evidence that genetically elevated CRP is causally associated with SBP, DBP, knee osteoarthritis, and bipolar disorder. Based on current GWAS data, we cannot verify any causal effect of CRP on the other 27 common somatic and neuropsychiatric outcomes investigated in the present study. Therefore, disease-associated rise in CRP levels may be a response to the disease process rather than a cause for these 27 outcomes. This implies that interventions to lower CRP levels are unlikely to result in decreased risk for the majority of common complex outcomes.
Supporting Information
S1 Consortia. Consortia coauthors and collaborators. (DOCX)
S1 Data. Individual association summary statistics of CRP lead SNPs and/or proxies with traits and diseases.
S1 Fig. GRSCRPand GRSGWASfor each studied outcome. (DOCX)
S1 Financial Disclosure. Authors’funding information.
(PDF)
S1 Methods. Linkage disequilibrium of the four GRSCRPSNPs.
(DOCX)
S2 Methods. CRP GRSGWASfor Alzheimer disease and body mass index.
(DOCX)
S3 Methods. Web links. (DOCX)
S4 Methods. CRP polygenic risk score (CRPPRS) for schizophrenia.
(DOCX)
S5 Methods. In silico (gene) pathway analyses highlight the role of interferon in the causal pathway between CRP and schizophrenia.
(DOCX)
S1 Table. Previous Mendelian randomization analyses using CRP variants as instruments. (XLSX)
S2 Table. CRP lead variants used in the genetic risk scores as instrumental variables. (XLSX)
S3 Table. Proxy SNPs of CRP lead variants used in the genetic risk scores as instrumental variables.
(XLSX)
S4 Table. Biologically prioritized candidate gene set associated with CRP used as the input query to the gene set enrichment analysis.
(XLSX)
S5 Table. Pathway enrichment results for the biologically prioritized candidate gene set associated with CRP used as the input query to the gene set enrichment analysis. (XLSX)
S6 Table. Genes (n= 144) that were significantly differentially expressed between
schizo-phrenia and unaffected controls in the hippocampus. (XLSX)
S7 Table. Pathway enrichment results for 144 genes that were significantly differentially expressed between schizophrenia and unaffected controls in the hippocampus.
(XLSX)
S8 Table. Biologically prioritized candidate gene set of CRP from Vaez et al. [81] (fromS5
Table,“CRP genes,”in blue) and differentially expressed genes in schizophrenia cases
ver-sus controls from Hwang et al. [110] (fromS7 Table,“SCZ expr genes,”in red) used as the
input query to the pathway analysis. (XLSX)
S9 Table. Pathway enrichment results for the combined set of the biologically prioritized
schizophrenia cases versus controls from Hwang et al. 2013. (XLSX)
S10 Table. List of genes at 108 genome-wide significant loci associated with schizophrenia. (XLSX)
S11 Table. Brain and blood eQTL for credible sets of SNPs of the 108 schizophrenia loci. (XLSX)
S12 Table. List of genes at 108 genome-wide significant loci associated with schizophrenia (yellow), brain eQTL (red), and blood eQTL (blue).
(XLSX)
S13 Table. Pathway enrichment results for the list of genes at 108 genome-wide significant loci associated with schizophrenia (yellow) and those associated with brain eQTL (red) and blood eQTL (blue).
(XLSX)
Acknowledgments
We thank for Dan Arking for providing the genome-wide summary statistics data on CRP polymorphisms for the autism GWAS. We would also like to acknowledge the rheumatoid arthritis and systemic lupus erythematosus consortia, the Genetic Investigation of Anthropo-metric Traits (GIANT) consortium, and the PGC for making publicly available the data from which we extracted summary association statistics for CRP SNPs. The PAGE Consortium is grateful to Alex Tsoi for adding the consortium information and membership list.
The Type 1 Diabetes Genetics Consortium would like to thank all participants and their families, and also thank Smari Kristinsson, Larus Arni Hermannsson, and Asbjörn Krisbjörns-son of Raförninn for their extensive software design and contribution. We would like to thank the people with motor neuron disease and their families for their participation in this project. We acknowledge sample management undertaken by Biobanking Solutions funded by the Medical Research Council at the Centre for Integrated Genomic Medical Research, University of Manchester.
Consortia Coauthors
Please refer toS1 Consortiafor the full names and affiliations of coauthors from the following five consortia: the Schizophrenia Working Group of the Psychiatric Genomics Consortium, the Autism Spectrum Disorder Working Group of the Psychiatric Genomics Consortium, the GERAD1 Consortium, the International Consortium for Blood Pressure Genome-Wide Asso-ciation Studies, and the PAGE Consortium.
Author Contributions
SG CP TR DVH MD NW AAC AD HH HM JE JK DA TS BK CVD JM APM RW CW PM JP JGP YJ HS. All authors have read, and confirm that they meet, ICMJE criteria for authorship.
References
1. Stockinger B. Immunology: cause of death matters. Nature. 2009; 458:44–45. doi:10.1038/458044a
PMID:19262664
2. Baumgart DC, Carding SR. Inflammatory bowel disease: cause and immunobiology. Lancet. 2007; 369:1627–1640. doi:10.1016/S0140-6736(07)60750-8PMID:17499605
3. Bruunsgaard H, Pedersen M, Pedersen BK. Aging and proinflammatory cytokines. Curr Opin Hema-tol. 2001; 8:131–136. PMID:11303144
4. Cesari M, Penninx BWJH, Newman AB, Kritchevsky SB, Nicklas BJ, Sutton-Tyrrell K, et al. Inflamma-tory markers and cardiovascular disease (The Health, Aging and Body Composition [Health ABC] Study). Am J Cardiol. 2003; 92:522–528. PMID:12943870
5. Couzin-Frankel J. Inflammation bares a dark side. Science. 2010; 330:1621. doi:10.1126/science. 330.6011.1621PMID:21163993
6. Fan X, Goff DC, Henderson DC. Inflammation and schizophrenia. Expert Rev Neurother. 2007; 7:789–796. doi:10.1586/14737175.7.7.789PMID:17610386
7. Grimaldi MP, Vasto S, Balistreri CR, di Carlo D, Caruso M, Incalcaterra E, et al. Genetics of inflamma-tion in age-related atherosclerosis: its relevance to pharmacogenomics. Ann N Y Acad Sci. 2007; 1100:123–131. doi:10.1196/annals.1395.010PMID:17460170
8. Hanson DR, Gottesman II. Theories of schizophrenia: a genetic-inflammatory-vascular synthesis. BMC Med Genet. 2005; 6:7. doi:10.1186/1471-2350-6-7PMID:15707482
9. Johnson TE. Recent results: biomarkers of aging. Exp Gerontol. 2006; 41:1243–1246. doi:10.1016/j. exger.2006.09.006PMID:17071038
10. Kiecolt-Glaser JK, Glaser R. Depression and immune function: central pathways to morbidity and mortality. J Psychosom Res. 2002; 53:873–876. PMID:12377296
11. Kiecolt-Glaser JK, McGuire L, Robles TF, Glaser R. Emotions, morbidity, and mortality: new perspec-tives from psychoneuroimmunology. Annu Rev Psychol. 2002; 53:83–107. doi:10.1146/annurev. psych.53.100901.135217PMID:11752480
12. Lynch MA, Mills KHG. Immunology meets neuroscience—opportunities for immune intervention in neurodegenerative diseases. Brain Behav Immun. 2012; 26:1–10. doi:10.1016/j.bbi.2011.05.013
PMID:21664452
13. Meyer U, Schwarz MJ, Müller N. Inflammatory processes in schizophrenia: a promising neuroimmu-nological target for the treatment of negative/cognitive symptoms and beyond. Pharmacol Ther. 2011; 132:96–110. doi:10.1016/j.pharmthera.2011.06.003PMID:21704074
14. Pardo CA, Vargas DL, Zimmerman AW. Immunity, neuroglia and neuroinflammation in autism. Int Rev Psychiatry. 2005; 17:485–495. doi:10.1080/02646830500381930PMID:16401547
15. Sansoni P, Vescovini R, Fagnoni F, Biasini C, Zanni F, Zanlari L, et al. The immune system in extreme longevity. Exp Gerontol. 2008; 43:61–65. doi:10.1016/j.exger.2007.06.008PMID:17870272 16. Hotamisligil GS. Inflammation and metabolic disorders. Nature. 2006; 444:860–867. doi:10.1038/
nature05485PMID:17167474
17. Mantovani A, Allavena P, Sica A, Balkwill F. Cancer-related inflammation. Nature. 2008; 454:436– 444. doi:10.1038/nature07205PMID:18650914
18. Dantzer R, O’Connor JC, Freund GG, Johnson RW, Kelley KW. From inflammation to sickness and depression: when the immune system subjugates the brain. Nat Rev Neurosci. 2008; 9:46–56. doi:
10.1038/nrn2297PMID:18073775
19. Emerging Risk Factors Collaboration, Kaptoge S, Di Angelantonio E, Lowe G, Pepys MB, Thompson SG, et al. C-reactive protein concentration and risk of coronary heart disease, stroke, and mortality: an individual participant meta-analysis. Lancet. 2010; 375:132–140. doi:10.1016/S0140-6736(09) 61717-7PMID:20031199
20. Emerging Risk Factors Collaboration, Kaptoge S, Di Angelantonio E, Pennells L, Wood AM, White IR, et al. C-reactive protein, fibrinogen, and cardiovascular disease prediction. N Engl J Med. 2012; 367:1310–1320. doi:10.1056/NEJMoa1107477PMID:23034020