LEARNING FROM TASTE:
BRAIN CONNECTIVITY, ADAPTATION, AND BEHAVIORAL CORRELATES
Jennifer Rose Sadler
A dissertation submitted to the faculty at the University of North Carolina at Chapel Hill in partial fulfillment of the requirements for the degree of Doctor of Philosophy in the Department of
Nutrition in the Gillings School of Global Public Health.
Chapel Hill 2020
© 2020
ABSTRACT
Jennifer Rose Sadler: Learning from taste: Brain connectivity, adaptation, and behavioral correlates
(Under the direction of Kyle S. Burger)
Food choices are the foundation of eating habits and contribute to weight status and health. Food choices are informed by expectations about a food’s reward value learned through appetitive food conditioning. This dissertation investigated brain connectivity during conditioning via food reward and punishment and brain adaptation to repeated exposure to food cue and tastes. An overarching goal was to identify how individual differences in behavioral
characteristics relate to brain response and learning outcomes.
following repeated taste administration. Additionally, individual differences in the magnitude of change was correlated with age/sex adjusted BMI.
ACKNOWLEDGEMENTS
I have many people to thank for completion of this stage of my training as a scientist. First and foremost, I am ever grateful to Kyle Burger, my mentor. From my first day at UNC, Kyle treated me as a peer and a friend. Kyle’s thoughtful instruction guided me through every step of my PhD. I am especially appreciative that Kyle shared so much of his experience as an early career faculty member with me. As I leave UNC, I feel wholly prepared for the next step in my career and beyond.
I am also grateful for the support and instruction of my committee members. Dr. Jessica Cohen, who met with me repeated to share her expertise in graph-theory and functional
connectivity analyses; Dr. Dana Small, whose knowledge in eating behavior and neuroimaging fields pushed my work to greater heights; Dr. Dianne Ward, who provided guidance and support in addition to thoughtful comments, and Dr. Penny Gordon-Larsen, who encouraged me to always consider the broader impact of my work.
My research was made possible by the Neuropsychology of Ingestive Behavior Lab. Dr. Grace Shearrer was a key part of this work. Grace’s guidance throughout planning my
appetitive Probabilistic Selection Task analysis. Also, I would like to acknowledge those who helped me on my road to graduate school – Drs. Michael Lowe and Harvey Grill. Their mentorship of my undergraduate and postgraduate research helped me find my passion and showed me the value of thoughtful mentorship.
I am grateful for the support of my friends and family. Thank you to Anna and Madison, who always provided a lending hand and empathetic ear. Without them, I would not have made it to the end of this process with my sanity intact. Also, thank you to my little sister Alison, who continually shares wisdom beyond her years, and to my older sister Rachel, who tackled grad school first. Thank you to my parents Allen and Kathy for raising me to be curious, humble, and work hard. You both pushed me to always achieve to my fullest potential and choose the right tool for the job. I am lucky to have the additional support of the Sadler family, who welcomed me with love and kindness. I couldn’t ask for better people to call my family.
PREFACE
Chapters 3, 4, and 5 represent three full, original research manuscripts that are currently under review. This work was done in collaboration with other scientists who provided feedback throughout the analysis and writing process.
Chapter 3 contains work produced with input from the following writing group: Grace E. Shearrer, Nichollette T. Acosta, Afroditi Papantoni, Jessica R. Cohen*, Dana M. Small*, Soyoung Q. Park, Penny Gordon-Larsen*, and Kyle S. Burger*.
Chapter 4 contains work produced with input from the following writing group: Grace E. Shearrer, Afroditi Papantoni, Penny Gordon-Larsen*, and Kyle S. Burger*.
Chapter 5 contains work produced with input from the following writing group: Grace E. Shearrer, Afroditi Papantoni, Sonja T. Yokum, Eric Stice, and Kyle S. Burger*.
TABLE OF CONTENTS
LIST OF TABLES ... XIV LIST OF FIGURES ... XV LIST OF ABBREVIATIONS AND SYMBOLS ... XVII
CHAPTER I. INTRODUCTION... 1
Specific Aims ... 2
Aim 1 ... 3
Aim 2 ... 3
Aim 3 ... 4
CHAPTER II. BACKGROUND ... 5
Consequences of Obesity ... 5
Eating Behavior and Reinforcement Learning ... 6
Neural Circuits in Reinforcement Learning ... 8
Individual Differences in Reinforcement Learning ... 13
Motivation for Dissertation Studies ... 16
CHAPTER III. METHODS ... 18
Study Samples and Data Collection Overview ... 18
Aims 1 and 2 ... 18
Functional Neuroimaging Analysis ... 28
Functional Connectivity ... 28
Graph Theory Network Analysis ... 30
CHAPTER IV. NETWORK ORGANIZATION DURING PROBABILISTIC LEARNING VIA TASTE OUTCOMES ... 32
Overview ... 32
Introduction ... 33
Methods ... 36
Sample ... 36
Measures ... 36
FMRI Preprocessing ... 39
FMRI Group-Level Main Effects Analysis ... 40
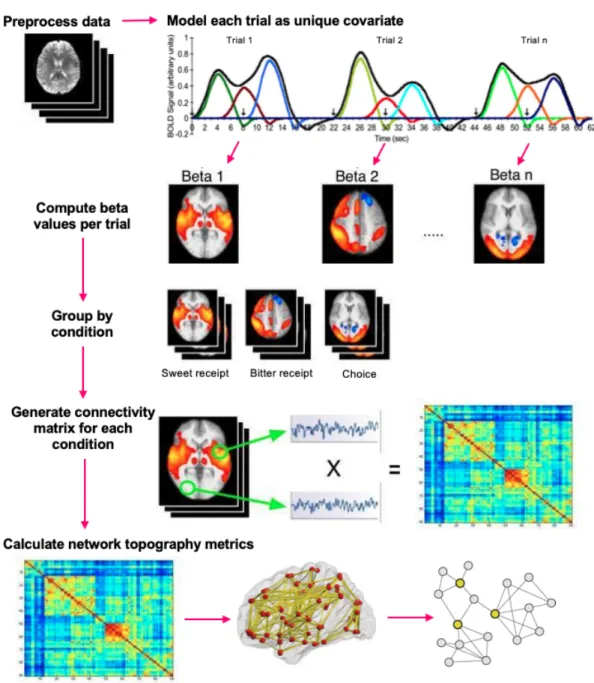
Betaseries and Functional Connectivity ... 41
Graph Construction & Parameters. ... 41
Behavioral Analysis ... 43
Results ... 44
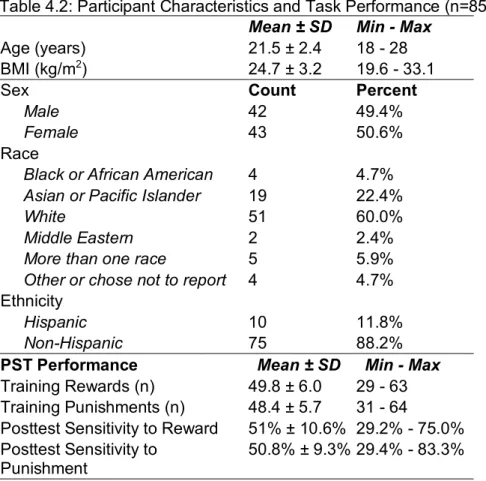
Participant Characteristics ... 44
Whole-brain response during choice, reward, and punishment... 45
Network Organization during Choice, Reward, and Punishment ... 49
Association of Community Segregation, Integration, and Hubness with Behavioral Outcomes. ... 49
Discussion... 52
CHAPTER V. BEHAVIORAL AND PHYSIOLOGICAL FACTORS ASSOCIATED WITH APPETITIVE PROBABILISTIC SELECTION TASK PERFORMANCE ... 60
Overview ... 60
Introduction ... 61
Methods ... 63
Procedures ... 64
Appetitive Probabilistic Selection Task ... 65
Data Analysis ... 66
Post Hoc Tests for Interactions with Sex ... 67
Results ... 68
Sample Characteristics and Appetitive Probabilistic Selection Task Performance ... 68
Multivariate Regression Models to Predict PST Posttest Learning Outcomes ... 69
Post Hoc Tests for Interaction with Sex ... 72
Discussion... 74
CHAPTER VI. CORRELATES OF NEURAL ADAPTATION TO FOOD CUES: THE ROLE OF OBESITY RISK FACTORS... 79
Overview ... 79
Introduction ... 80
Methods ... 82
Sample Recruitment ... 82
Study Overview ... 83
Measures ... 83
Neuroimaging Data Parameters and Data Preprocessing ... 86
Behavioral Data Analysis ... 88
Results ... 88
Sample Characteristics... 88
Brain Response to fMRI Food Reward Paradigm ... 89
Aim 1: How do brain networks organize during a food-motivated learning task?... 101
Aim 2: Can we predict performance on a food-motivated learning task from psychological, behavioral, and physiological measures? ... 102
Aim 3: How does brain response to taste change over repeated exposure to a food cue and receipt? ... 103
Limitations and Strengths ... 104
Limitations ... 104
Strengths ... 109
Future Directions of Research ... 111
Pilot Testing Modifications to the Appetitive Probabilistic Selection Task ... 111
Testing Dynamic Functional Connectivity During Conditioning ... 112
Predicting Eating Behavior and Weight Change ... 113
Significance and Public Health Impact ... 114
APPENDIX A: SUPPLEMENTAL MATERIALS FOR CHAPTER IV ... 117
Probabilistic Selection Task Performance ... 117
Functional Connectivity Differences Between Reward and Punishment ... 119
Measures of Community Topology ... 120
Measures of Nodal Topology during Choice, Reward, and Punishment ... 122
APPENDIX B: EXPLORATORY FACTOR ANALYSIS OF VARIABLES ASSOCIATED WITH REINFORCEMENT LEARNING... 125
Overview and Hypothesis ... 125
Aim ... 125
Interim Methods ... 126
Data ... 126
Exploratory Factor Analysis Assumptions and Sample Size ... 126
Exploratory Factor Analysis & Factor Scores ... 127
Multivariate Linear Regression of Factor Scores on Posttest Performance... 128
Interim Discussion ... 130
APPENDIX C: SUPPLEMENTAL MATERIALS FOR CHAPTER V ... 131
Associations between independent and dependent variables... 131
Goodness of Fit Metrics for Multivariate Linear Regression Model to Predict Overall Accuracy (% choose reward and avoid punishment) ... 132
Goodness of Fit Metrics for Multivariate Linear Regression Model to Predict Sensitivity to Reward (% choose reward) ... 134
Post-Hoc Power Calculations ... 135
Correction for Multiple Comparisons ... 136
LIST OF TABLES
Table 3.1. Beverage Composition ... 19
Table 3.2. Graph Characteristics and Metrics ... 31
Table 4.1. Reinforcer Composition and Selection ... 38
Table 4.2: Participant Characteristics and Task Performance (n=85) ... 45
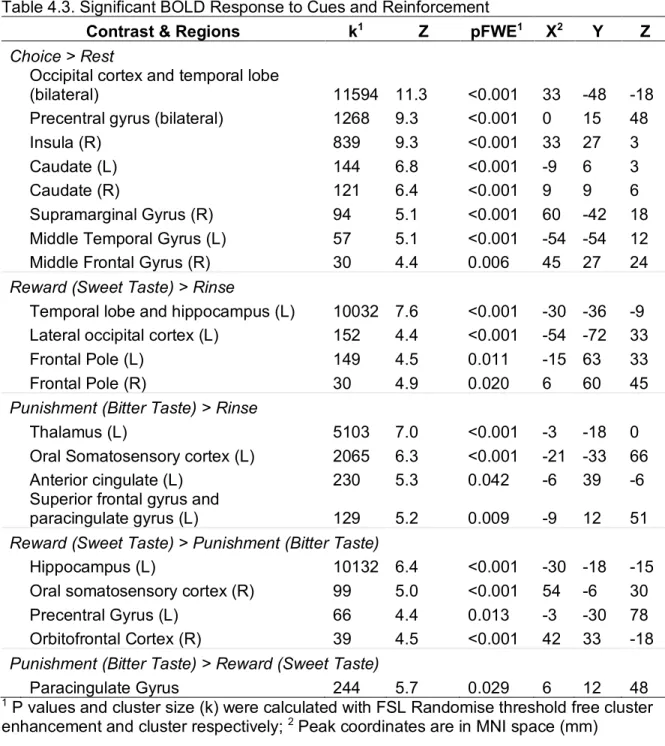
Table 4.3. Significant BOLD Response to Cues and Reinforcement ... 47
Table 4.4: Module Graph Parameters between Choice and Reinforcement ... 51
Table 5.1: Participant Characteristics (n=89) ... 68
Table 5.2: Descriptive statistics of predictors and outcomes and differences by sex (n=89) ... 69
Table 5.3: Linear regression analyses predicting learning performance outcomes from behavioral and physiological predictors (n=89)... 71
Table 5.4: Linear regression to predict posttest overall accuracy and test for a significant interaction of sex and SPQ (n=89) ... 73
Table 6.1: Participant Characteristics (n=154) ... 90
Table 6.2: Greater BOLD Response in Late Task Phase relative to Early Task Phase ... 92
Table A.1: PST Training Performance... 118
Table A.2: Repeated Measures ANOVA to test for differences in PST training accuracy over time between pairs ... 119
Table A.3: Community Segregation, Integration, and Hubness Measures during Choice, Reward, and Punishment ... 121
Table A.4: Metrics of Nodal Topology ... 122
Table B.1: Correlations between variables included in the EFA ... 127
Table B.2: Factor Loadings of behavioral and physiological variables (n=90) ... 129
Table B.3: Linear regression analyses predicting appetitive PST performance outcomes from factor scores (n=89) ... 129
Table C.1: Correlation Matrix of Variables (n=89) ... 131
Table C.2: Variance Inflation Factor for Independent Variables... 132
LIST OF FIGURES
Figure 2.1: Classical and Instrumental Conditioning ... 7
Figure 2.2: Brain Regions in the Corticostriatal Loop. ... 10
Figure 2.3. Network-Based Approaches to Study Brain Response. ... 12
Figure 3.1: Consort Chart for Aims 1 and 2. ... 20
Figure 3.2. Appetitive Probabilistic Selection Task ... 26
Figure 3.3: Food Reward fMRI Paradigm ... 28
Figure 3.4: Betaseries Connectivity and Network Analyses ... 30
Figure 4.1: Graph Theory Measures of Functional Network Organization ... 35
Figure 4.2: BOLD Response During Choice, Reward, and Punishment ... 48
Figure 4.3: Network Community Structure during Choice, Reward, and Punishment ... 50
Figure 4.4: Segregation of Community 1 during choice is positively associated with posttest sensitivity to punishment. ... 52
Figure 5.1: Interaction of Sex and Sensitivity to Punishment Questionnaire (SPQ) scores on Posttest Overall Accuracy (n=89) ... 73
Figure 6.1: FMRI Food Reward Paradigm ... 86
Figure 6.2: BOLD Response to Cue Predicting Milkshake Administration and Milkshake Receipt ... 91
Figure 6.3: Differences in BOLD Response to Milkshake Cues and Receipt from Early Task Phase to Late Task Phase ... 92
Figure 6.4: BMI Percentile and TFEQ Restraint Scores are Associated with PE Change in the Left Posterior Cingulate Cortex ... 93
Figure 6.5: Parental Risk of Weight Gain is Associated with Significantly Higher Right Caudate PE in Early and Late Task Phases ... 94
LIST OF ABBREVIATIONS AND SYMBOLS ≥ Greater than or equal to
> Greater than < Less than
≤ Less than or equal to ANOVA Analysis of Variance
b Beta coefficient
BMI Body Mass Index
BMI% Body mass index percentile BOLD Blood oxygen level dependent
Cm Centimeters
χ2 Chi-squared CI Confidence interval
FMRI Functional magnetic resonance imaging
G Grams
HbA1c Glycated hemoglobin
K Cluster Size
Kg Kilograms
L Liters; Lateral
M Mean; Medial
Mg Milligrams
ROI Region of Interest
S Summation
SD Standard deviation SE Standard Error
SSS Sensory-specific Satiety US United States
V Ventral
CHAPTER I. INTRODUCTION
Overweight and obesity affect over two thirds of adults in the US,1 and are associated with increased risk for diseases including type 2 diabetes, cardiovascular disease, and certain cancers.2–4 Genetics, metabolism, environment, and lifestyle choices all contribute to weight status,5–8 but food choice is one of the most proximal, modifiable determinants of weight.6,9,10 Information from behavioral, social, and environmental cues influences our choices about when, what, and how much to eat.11,12 For cues to influence food choices, individuals must first learn about the cue through appetitive, food conditioning.13–15 Food conditioning, or the process through which we learn to associate a cue with the motivational value of a food, creates expectations for food reward or punishment, and helps individuals predict the outcome of a choice based on prior experience.16 Food conditioning helps optimize behavior to increase food reward, avoid averse outcomes, and direct the appropriate amount of effort towards a goal based on the outcome. Reinforcement learning is mediated by changes in brain response,17 so characterizing how the brain responds to food cues and taste can help us better understand food reinforcement.
cues and taste changes over the course of learning. During repeated cue-reinforcer pairings, response to a food cue increases in the striatum, while response to taste decreases in the striatum and OFC.21 The strength of brain adaptation has been correlated with longitudinal weight change,21 but not cross-sectional measures of eating behavior or trait sensitivity to reward and punishment. Given the foundational role of food conditioning for food choices and for the development of eating habits, an improved understanding how the brain responds to food reinforcement is needed. Beyond brain response, it is important to examine how biobehavioral characteristics such as BMI, eating behavior constructs, and trait sensitivity to reward and punishment relate to individual differences in food conditioning. Individual differences in these traits are associated with reinforcement learning via secondary
reinforcers,22–24 but few studies have examine their relationships to food conditioning. Identifying brain response during food conditioning and characteristics that relate to sensitivity to food reinforcement can together help better understand food choices, which in turn can inform research on eating habits and weight change.
Specific Aims
This dissertation seeks to address gaps in our understanding of the neural basis of food conditioning and individual-level factors that contribute to differences in how we learn from taste. Utilizing reinforcement learning and food reward tasks, this research examined how functional brain connectivity and network organization, representing how regions of the brain interact, are associated with performance on a taste-motivated, response-dependent reinforcement learning task, called the appetitive Probabilistic Selection Task (PST). Second, we identified
individual-level factors affect how we learn associations between foods and their cues and how the brain responds to food conditioning. Understanding individual differences in food
conditioning allows us to better predict eating behavior and identify those at risk for habitual overeating and weight gain.
Aim 1
Examine brain response, functional connectivity, and network organization associated with choice, reward via sweet taste, and punishment via bitter taste during an appetitive probabilistic selection task.
• Hypothesis: Brain response during choice will be associated with brain response in the
medial OFC and prefrontal cortex; sweet taste will be associated with response in the insula, dorsal anterior cingulate cortex, OFC, and amygdala response; and bitter taste will be associated with response in the OFC and amygdala. Network organization will show fewer subnetworks in response to choice compared to food reward and
punishment, reflecting more synchronization across the brain during choice.
Aim 1b: Test how facets of network organization relate to sensitivity to reward and punishment as measured by the appetitive probabilism selection task.
• Hypothesis: Increased community segregation across conditions will be associated with
improved task performance as measured by task posttest accuracy. Aim 2
Test how psychological, behavioral, and physiological variables associate with
sensitivity to reward. Overall performance will be associated with working memory capacity, and trait sensitivity to reward and punishment.
Aim 3
Test the effect repeated exposure to a cue predicting milkshake receipt and milkshake taste administration on brain response during a fMRI food reward paradigm.
• Hypothesis: Repeated exposure to a cue predicting milkshake receipt will be associated
with increased striatal response over time. Repeated exposure to milkshake taste administration will be associated with decreased OFC response over time.
Aim 3b: Test for associations between the magnitude of change over time and measures of eating behavior, adiposity, and weight gain risk.
• Hypothesis: BMI and weight gain risk factors, including parental weight status and high
CHAPTER II. BACKGROUND Consequences of Obesity
Obesity is a medical condition characterized by the accumulation of body fat. Obesity, formally defined by a body mass index (BMI) above 30.0 kg/m2, affected almost 40% of American adults in 2015 to 2016,25 and is on the rise globally.26–28 Obesity increases risk for a number of diseases including type 2 diabetes, cancer, and ischemic heart disease,2,4,29–31 making it one of the top five risk factors of preventable death.32 Elevated weight also has a high financial burden; obesity incurs about $147 billion US dollars in healthcare costs each year.33 For individuals with obesity, this translates to a $1,450 US dollar increase in annual health expenses, as compared to someone at a normal weight. Beyond increasing the risk of disease, death, and healthcare costs, obesity is also associated with increased risk of depression34 and is a possible risk factor for the development of cognitive dysfunction and dementia later in life.35,36 Given the wide range of adverse effects associated with obesity, public health research has focused on ways to treat obesity and prevent weight gain. At the most fundamental level, obesity is caused by an imbalance between caloric intake and energy expenditure.
determinants of a person’s weight status.1,26 Therefore, understanding eating behavior,
specifically how aberrant eating habits develop, is a key point of study in the etiology of obesity. Eating Behavior and Reinforcement Learning
Food is omnipresent in the modern food environment.44 The wide availability of palatable, energy dense, and ready-to-eat foods presents a constant pressure to make decisions about what, when, and how much to eat. Food choices depend heavily on the combination of context (e.g. hunger state) and preferences.12 Context represents the combination of physiological and environmental signals that influence our decisions. Such signals include hunger; dietary goals; the time of day; social influences, and the physical environment in which a decision is made.11,45–49 Depending on the context, choices can be vastly different. For example, someone may refuse a favorite food if they’re full, or someone may eat a food they dislike to fit in with peers. Conversely, an individual’s food preferences, representing their appraisal of how much they like a food, are more stable.50 Some taste preferences are innate, such as the preference for sweet or dislike of bitter tastes,46,51,52 but the majority of food preferences are acquired through reinforcement learning.53 Two systems of reinforcement learning underpin how we acquire information about food: classical conditioning and instrumental conditioning.
conditioning in ingestive behavior includes processes like conditioned taste aversion, flavor-nutrient learning, and flavor-flavor learning.
Figure 2.1: Classical and Instrumental Conditioning
Conditioned taste aversion was first demonstrated by Rzóska, who showed that after a rodent was made sick by injection of a noxious agent after consuming a food, the rat would immediately begin to avoid that food.58 This effect has been replicated in other rodent studies,59 and in humans conditioned taste aversion can have lifetime effects on food preferences.60 Unlike conditioned taste aversion, flavor-nutrient learning and flavor-flavor learning are motivated by reward. Flavor-nutrient learning is thought to be the backbone of taste
preferences. Flavor-nutrient learning occurs when a food’s post-ingestive effects, specifically the caloric or protein content, is learned to be associated with the food’s flavor, creating a
learning help individuals form preferences via associative mechanisms. In turn, learned preferences set expectations for the reinforcing value of foods to help drive food choice.
While, classical conditioning is the process through which we learn predictions, instrumental (or operant) conditioning is the process through which we learn optimization (Figure 2.1B). Instrumental conditioning involves learning to associate a stimulus with a response that is related to reinforcement. Originally described by E.L Thorndike as “trial and error learning,”66 instrumental conditioning helps an individual select the best action to gain a reward or avoid a punishment. A critical component of instrumental conditioning is that
conditioned responses only occur in the presence of the learned stimulus. This is accomplished through three stages of learning, referred to as three-term contingency.66 First, a discriminative stimulus occurs, which cues a response. The response itself is the next stage of learning,
followed by consequences. When the consequence of a response is favorable, that behavior will be reinforced and the relationship between the discriminative stimulus and outcome is
strengthened.66 When the consequence is aversive, the response will be down regulated or adapted.66 In the context of ingestive behavior, instrumental conditioning is represented in goal-directed behaviors to earn or avoid foods, such as how rodens learn to lick a feeder that contains sucrose solution,67 or how people learning to avoid an item on the menu because it’s not to their liking.67 Instrumental conditioning underpins many goal-directed behaviors related to food, and a key difference between these instrumental conditioning and classically conditioning is the reflexiveness of response. Classical conditioning responses are automatic and implicit, while instrumental behavior is under the control of the actor. Together, classical and
instrumental conditioning provides a framework for the processes that contribute to food preferences and food choices.
Neural Circuits in Reinforcement Learning
by dopamine signaling. Dopamine, a neurotransmitter synthesized from tyrosine, was originally thought to respond to reward, since electrophysiological recordings showed action potential spikes in dopaminergic neurons in the striatum in response to rewards.68 Seminal work by Schultz et al. demonstrated that dopamine signal also predicts rewards following conditioning.69 Following repeated pairings of a cue with palatable food, firing of dopaminergic neurons in response to the food reward slowed, and instead dopamine signaling shifted to the cue that predicted reward.69 This work established that with conditioning, cues become motivationally salient and confer their own value for anticipation of reward.70 The predictive value of cues encoded by dopamine provides the basis for another aspect of reinforcement learning; prediction error, or the difference between expected and actual outcomes.71
Prediction error can be categorized into two types: positive prediction error, where the outcome is better than expected, or negative prediction error, where the outcome is worse. Differences in dopamine signaling correspond to the two types of prediction error. Dopamine response increases following receipt of an unexpected reward, signifying a positive prediction error.72,73 Conversely, when an expected reward is withheld, dopamine response decreases, signaling a negative prediction error.72,74 Pharmacological manipulations of dopaminergic function demonstrate that too much or too little dopamine can impact reinforcement learning. Increasing dopamine signaling via administration of a dopamine agonist disrupts reinforcement learning in humans,75 while blocking dopamine signal via a dopamine antagonist prevents animals from learning to associate a cue with its paired reinforcer.76 Finally, individual
Dopamine signal from the midbrain projects to other brain regions, such as the prefrontal cortex, to coordinate learning. The corticostriatal loop is an especially important pathway that coordinates motivated behaviors (Figure 2.2).
Figure 2.2: Brain Regions in the Corticostriatal Loop.
The corticostriatal loop includes projections from midbrain areas, such as the dorsal and ventral striatum and ventral pallidum, to the prefrontal cortex. The prefrontal cortex is a large area covering the anterior portion of the frontal lobe. Brain regions in the prefrontal cortex have many functions. Broadly, the prefrontal cortex is involved in executive function, which controls behaviors like decision making, action selection, problem solving, and planning.79 Specific areas of the prefrontal cortex are part of the corticostriatal loop, including the orbitofrontal cortex (OFC), ventromedial prefrontal cortex (vmPFC), and dorsolateral prefrontal cortex (dlPFC).80 Each of these prefrontal regions have important functions for reinforcement learning. The OFC is closely tied to taste and other sensory inputs, and is thought to link sensory representations of cues to their value as outcomes.81 The vmPFC is also involved in assessing the value of
outcomes, and especially contributes to choosing between multiple outcomes.82,83 The dlPFC monitors the incentive value of outcomes and anticipates future rewards.81,84 Of note, the corticostriatal pathway is bidirectional, so information from the prefrontal cortex is
communicated through “top-down” projections that mediate response to feedback and change dopamine signaling as needed.85,86
In addition to the corticostriatal loop, pathways involved in memory are of particular importance for reinforcement learning. Reinforcement learning, especially in when it involves complex decision making, relies on working memory. Working memory is a system that
temporarily processes and stores information needed for cognition.87 Working memory recruits multiple brain regions across the frontoparietal network, which included the dlPFC, the anterior cingulate cortex, and the parietal cortex.88 Similar to its function in the corticostriatal loop, when involved in working memory, the dlPFC functions to integrate information for decision-making. The anterior cingulate cortex is thought to control attention, while the parietal cortex completes sensory and perceptual processes needed for working memory.88 Working memory is closely linked to reinforcement learning. Evidence from studies of disorders with working memory impairments, such as schizophrenia, show that working memory deficits can interrupt
reinforcement learning.89,90 Individuals with high working memory capacity are able to learn cue-reinforcement contingencies faster.87 Thus, classical and instrumental conditioning both rely on working memory to provide the processing power needed for learning.
In addition to these pathways, other regions of the brain are implicated in reinforcement learning. One such region is the amygdala. During reinforcement learning, the amygdala was previously thought to respond only to aversive stimuli,91 however, it also shows BOLD response to rewards.92–94 Thus, the amygdala is thought to communicate information about reinforcement context and expectations,95 contributing to value signals along with the OFC,96,97 and the
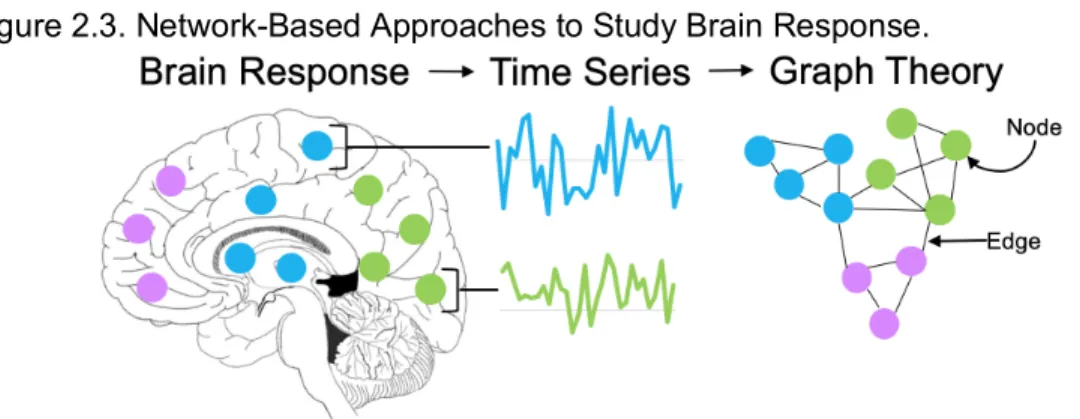
important information regarding how brain regions work together to produce complex behaviors. Functional connectivity and network-based approaches characterize how activity in brain
regions correlate over time.99 Functional connectivity and network structure can exist between spatially distinct regions, theoretically representing the flow of information across the brain.100–102 Functional connectivity correlates regional brain activity over time in a pairwise fashion,
reflecting synchronous response across areas. Network-based analyses of brain response build on functional connectivity by applying graph-theory measures to connectivity data. Regions of the brain are treated as “nodes” of a graph and their pairwise functional connectivity or
correlation as “edges”100 (Figure 2.3). This approach provides information about the architecture of brain networks and the relationships between groups of brain areas.
Figure 2.3. Network-Based Approaches to Study Brain Response.
functional subnetworks, or modules, that are theorized to perform specialized tasks.104 Modularity, particularly of the sensory-motor subnetwork, predicts individual differences in response to cognitive training,105 suggesting that modularity is a marker for brain plasticity.106 During reinforcement learning, module organization of the striatum changes, such that the striatum becomes more closely connected to cue-processing and value assessment regions.107 Further, individual differences in how readily the striatum changes modules are positively associated with learning performance,107 supporting that individual differences in the formation of efficient pathways for decision making is related to behavioral outcomes. Critically, the reinforcers used to study brain response to reinforcement learning are often text or visual representations of secondary reinforcers, like money. A primary reinforcer, such as food, may have more saliency108 and could contribute to different network organization and dynamics over learning.109 To date, no study has examined network structure during reinforcement learning on a response-dependent, food-motivated task.
Individual Differences in Reinforcement Learning
Reinforcement learning is a highly conserved process, yet there are observed variations in how quickly and how strongly individuals undergo conditioning. In rodent models of
reinforcement learning, animals show individual differences in their susceptibility to food cues, in behavioral phenotype named sign-tracking and goal-tracking.110,111 Sign-tracking animals
construct of cue-reactivity. Cue-reactivity represents an individual’s sensitivity to conditioned cues and is closely tied to cravings. People with higher cue-reactivity show stronger approach bias towards cued foods116,117 and increased intake of craved foods.118 Cue-reactivity may also affect the degree to which brain response changes during conditioning. In humans, an fMRI study identified that during classical conditioning via pairing a novel cue with administration of a chocolate milkshake, striatal BOLD response to the taste decreases over time, while striatal BOLD response to the predictive cue increases.21 The degree to which striatal response changed over the course of conditioning predicted with weight gain over two years, suggesting that increasing motivational response towards cues could translate to weight gain.21 Together, animal models and human research support that individual differences in sign-tracking and cue-responsiveness can change reinforcement learning and contribute to elevated risk of weight gain.
Additional physiological and psychological characteristics are associated with individual differences in reinforcement learning. Individuals at an elevated weight show stronger classical conditioning when a novel cue is paired with a chocolate milkshake compared to healthy weight participants.119 Also, obesity is associated with insensitivity to punishment on conditioning tasks. Obese animals show increased tolerance for punishment via foot shock in order to receive a food reward.120 In humans, obesity is associated with insensitivity to negative feedback on a decision making task that operates through instrumental conditioning, while sensitivity to positive feedback was the same in the obese group as the healthy weight group.23 Diet also impacts individual differences in reinforcement learning. Consumption of a high-fat, high-sugar diet causes impairments in discriminative learning that precedes weight gain and obesity in preclinical models.121 Further, a high sucrose diet was associated with delayed outcome
feedback measured by the Iowa Gambling Task,123 a decision making task that utilizes instrumental conditioning.124
performance on reinforcement learning tasks and response to prediction error.90 In summary, a number of characteristics including adiposity, diet, and cognitive and psychological constructs are associated with individual differences in reinforcement learning.
Motivation for Dissertation Studies
Reinforcement learning is a key component of eating behavior53 and is associated with brain response across a number of regions including the midbrain, prefrontal cortex, insula, parietal cortex, and amygdala.20,80,107,131–133 Food motivated reinforcement learning is widely studied in behavioral neuroscience research with animal models using primary reinforcers or direct manipulation of dopaminergic circuity.134 However, human neuroimaging studies of reinforcement learning typically utilize secondary reinforcers, such as monetary gain/loss or visual feedback. Few studies have bridged animal and human models of reinforcement learning by examining functional brain response to food reinforcement learning. This dissertation sought to address these gaps by testing whole brain response and network connectivity during food-motivated reinforcement learning and biobehavioral factors that contribute to individual differences in conditioning. First, I examined task-based functional connectivity and network organization to characterize how regions of the brain integrate during reinforcement learning on a response-dependent, taste-motivated instrumental conditioning task. Second, I examined how individual-level characteristics predict learning in the same sample. Finally, in a separate
sample, I examined tested the impact of repeated exposure to a food cue and taste on brain response to stimuli, and how the magnitude of change in brain response related to risk factors for weight gain.
insight into how food reinforcement affects brain network structure during the task, and show that module assignment of regions involved in reward processing and expectations change between choice, reward, and punishment conditions. By testing biobehavioral correlates of appetitive reinforcement learning, the second study in this series identifies factors that make individuals more responsive or resistant to learning from food reward and punishment.
CHAPTER III. METHODS
This dissertation employed several methods to examine individual differences in appetitive reinforcement learning.
Study Samples and Data Collection Overview Aims 1 and 2
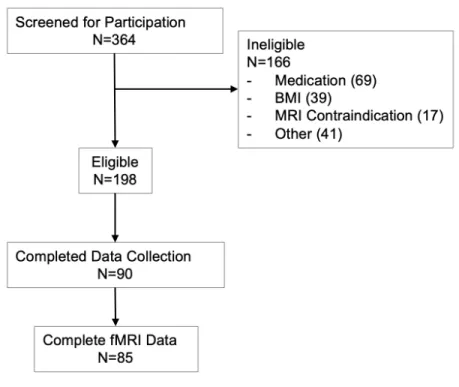
Data used for aims 1 and 2 were collected in a study designed to probe individual differences in learning from food reward and punishment. Data were collected from March to December 2018 in Chapel Hill, North Carolina, USA. Participants were recruited through a University-operated online recruitment pool (Join the Conquest), online advertisements via Craigslist, and flyer postings across the University of North Carolina at Chapel Hill campus. Possible participants were screened for eligibility through an online screening form. Eligibility criteria included: 1) aged 18-28 years, 2) body mass index between (BMI) 20.0 kg/m2 and 32.0 kg/m2. Exclusion criteria were: 1) contraindications of MRI, such as metal implants, piercings that cannot be temporally removed, 2) current smoker, 3) self-report of a current or past diagnoses of an eating disorder, 4) chronic illness or medication requirement that could affect diet, 5) diagnosis of a major psychological condition, such as bipolar, schizophrenia, major affective disorder, and 6) allergy or intolerance to any study foods. Recruitment and retention are shown in Figure 3.1.
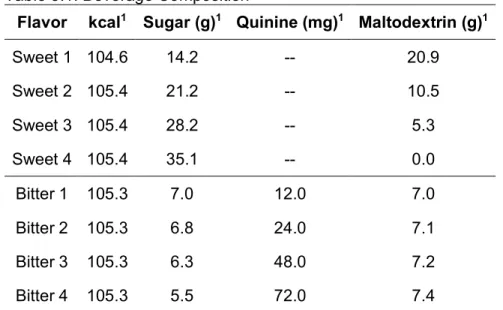
punishment sensitivity. Roughly one hour prior to neuroimaging, participants completed a taste test to select beverage stimuli for the scan. During the taste test, participants were instructed to taste and rate 20mL samples of four sweet and four bitter beverages. The eight beverages were made from a base of water (940mL), unsweetened Kool-Aid® Cherry powder (4.5g) and simple syrup (60 mL). Additional simple syrup or a quinine solution were added to the beverages to create different levels of sweetness or bitterness. The composition of the beverages can be seen in Table 3.1. The beverages were calorically-matched with the addition of maltodextrin, a soluble, neutral-tasting carbohydrate powder. During the taste test, participants rated the beverages on pleasantness, desire to consume, sweetness, bitterness, and intensity on visual analog scales (VAS) anchored at -100 and 100. All sweet beverages were sampled in a random order, then participants ranked the beverages from most pleasant to least pleasant, with the highest ranked beverage selected as the reward for the probabilistic selection task. The same process was then completed with the bitter beverages, and the lowest ranked beverage was selected as the punishment.
Table 3.1. Beverage Composition
Flavor kcal1 Sugar (g)1 Quinine (mg)1 Maltodextrin (g)1
Sweet 1 104.6 14.2 -- 20.9
Sweet 2 105.4 21.2 -- 10.5
Sweet 3 105.4 28.2 -- 5.3
Sweet 4 105.4 35.1 -- 0.0
Bitter 1 105.3 7.0 12.0 7.0
Bitter 2 105.3 6.8 24.0 7.1
After completing the taste test and questionnaires, participants were escorted to neuroimaging UNC’s Biomedical Research Imaging Center (BRIC) for neuroimaging. All
neuroimaging data was collected on a Siemens Prisma 3T scanner (Siemens Medical Solutions, Munich, Germany). Following an anatomical scan, participants completed four runs of the appetitive probabilistic selection task (PST) during fMRI scans, then the scan concluded. After the scan, participants completed the appetitive PST posttest to assess conditioning. To conclude the visit, participants were debriefed and compensated.
Figure 3.1: Consort Chart for Aims 1 and 2.
Aim 3
research personnel via a phone interview. Eligibility criteria included 1) aged 14 to 17 years, 2) body mass index between (BMI) 18.0 kg/m2 and 25.0 kg/m2. Exclusion criteria were 1) current use of psychoactive medications or drugs more than weekly, 2) contraindication of MRI, such as pregnancy and recent head injury with a loss of consciousness, 3) significant cognitive
impairment 4) any major medical problems such as Type I diabetes, and 5) diagnosis of current Axis I psychiatric disorder. For eligible participants, parental and participant consent was
obtained before data collection. Recruitment data were not tracked during data collection, so a consort chart is not provided for this study.
Data collection included two baseline assessments: 1) a behavioral assessment, and 2) a fMRI scan assessment. At the initial baseline behavioral assessment, participants completed metabolic and physiological measures including doubly-labelled water dosing and initial urine collection to measure energy expenditure, resting metabolic rate assessment, and body
composition assessment using a Bod Podâ air displacement plethysmograph (CosMed, Rome, Italy). Participants also completed eating behavior questionnaires and an eating disorder
interview. During the behavioral assessment, parents provided self-reported height and weight data for themselves and the adolescents other biological parent, and completed a measure of their child’s pubertal development. At the baseline scanning assessment, participants completed behavioral and fMRI measures of food reward and general reward abnormalities. Participants were asked to not eat anything after 4 hours before the baseline assessments to mimic a hunger level that is similar to just prior to a meal. Participants completed anatomical and
doubly labeled water urine samples. Following baseline measures, participants completed annual assessments at 1-, 2-, and 3-year follow-ups. At each of the follow-ups, participants completed surveys, diagnostic interviews, and anthropometric and body composition measurements.
Measures and Study Procedures Functional Magnetic Resonance Imaging
In aims 1 and 3, functional magnetic resonance imaging (fMRI) is employed to examine brain response to food reinforcement learning in real time. FMRI, like other forms of nuclear magnetic resonance imaging, measures brain response by exploiting metabolic properties of the brain. The neuronal processes that underlie brain signal, including the release and reuptake of neurotransmitters and propagation of action potentials, require energy in the form of adenosine triphosphate (ATP). Neurons generate ATP through cellular respiration, the process through which glucose is metabolized to produce energy. Cellular respiration requires glucose and oxygen, so as neuronal activity increases, blood flow increases to bring metabolic substrates to upregulated neurons. Capitalizing on the different magnetic properties of oxygenated and deoxygenated blood, researchers developed a way to measure changes in gradients of
oxygenated and deoxygenated blood in the brain, called blood oxygen level-dependent (BOLD) response. BOLD response identifies regions where change from oxygenated to deoxygenated blood is the strongest as a proxy for neuronal activity.135 This way to spatially capture brain response over time is at the core of fMRI.136
evoke a neural state of interest, or experimental condition, which can be compared to BOLD response recorded during a different state, or control condition. Comparison is done through creating contrasts, which tests for BOLD response that is significantly different in the
experimental condition compared to the control condition. Contrasting the experimental
condition greater than the control condition (experimental > control) identifies stronger activity in the experimental condition, while the reverse contrast shows activity that is weaker in the experimental condition. Selection of a proper control condition is critical to successfully identify brain response associated with the condition of interest. In taste neuroimaging, the control condition is typically administration of a non-caloric solution designed to mimic the osmolarity of saliva, called tasteless or neutral solution. Tasteless solution allows researchers to control for brain response to administration of a liquid without evoking response to flavor or calories.
FMRI is incredibly powerful, but the method has key limitations. The first major limitation of fMRI is caused by the way MRI images are acquired. Because EPI images are rapidly
acquired over time, various types of artifacts, especially motion, can impact the quality of MRI signal. Motion is especially problematic because it can be conflated with real signal, contributing to false-positives in the data.138,139 To protect against motion before/during scanning,
Another limitation of fMRI is due to physiological properties of the BOLD response. BOLD signal is based on blood flow, but the hemodynamic response to any given stimuli lags about 5-7 seconds behind the event. This lag causes the temporal resolution of fMRI to be blurred. To counteract this limitation, paradigms can be run through optimization programs to optimize onset timing to maximize BOLD signal for each scan. This is done through adding a jitter, or variable length gap, between events so that different slices of the brain are captured over the course of events. In reconstruction of the slices, a jitter helps produce the best possible representation of BOLD response in the experimental condition of interest.141 Another way to account for lag in hemodynamic response is applied during preprocessing, the data cleaning steps prior to analysis. During preprocessing, the paradigm’s timing is convolved onto the hemodynamic response function to attempt to match the onset of stimuli to a curve modeling the BOLD response delay.141 It is critical that the timing of fMRI paradigms account for this delay in hemodynamic response.
The final limitation of fMRI is centered around statistical power. In the past 5 years, the understanding of power in neuroimaging research has evolved significantly. Poorly powered studies have a much greater likelihood of producing false positives and their findings are often not replicable.142 The simplest way to increase power is to collect more data.143 This can be done by adding more subjects or more trials, depending on the question of interest. The samples presented in this dissertation include 85 and 154 participants (aims 1 and 3, respectively), representing some of the largest samples in ingestive behavior neuroimaging research.
Appetitive Probabilistic Selection Task
Aims 1 and 2 use data from a novel appetitive probabilistic selection task (PST), designed to assess response to feedback from a sweet reward beverage and a bitter
disease.78 In the original study, participants completed an initial training where on any given trial, they were presented a pair of novel symbols (Japanese Kanji characters), and asked to choose one of the symbols. Following their choice, they were presented with “Correct!” or “Incorrect” as feedback. The feedback in the training was probabilistic – each symbol had a percent with which it was correct. For example, symbol A had an 80% likelihood of being
correct. Symbol A was paired with symbol B, which was only 20% correct. There were two other pairs of symbols – the CD pair (70/30%) and the EF pair (60/40%). Participants completed training trials until they were able to accurately choose the higher probability symbol from the AB pair on 65% of trials. In the original paper, the average number of training trials was 200.78 Following completion of the training, participants completed the posttest for the task. During the posttest, participants were presented with the same training symbols in novel combinations (e.g. symbol A paired with symbol C) in random sequence. Learning from positive and negative outcomes were assessed as the proportion of posttest trials where participants selected symbol A over other shapes and the proportion of posttest trials where participants avoid symbol B over other symbol, respectively.78
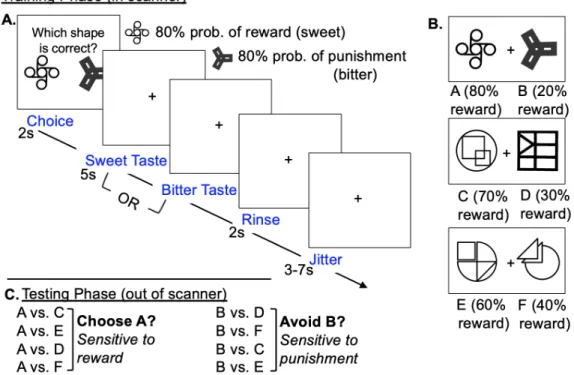
Figure 3.2. Appetitive Probabilistic Selection Task
Tastes were delivered via programmable syringe pumps. Syringes filled with the sweet and bitter beverages and tasteless solution were connected via plastic tubing to a second set of tubing that fit into participants' mouths and delivered the taste similar to a straw. There was a 3-7s (mean=5s) jitter between trials. Second, in the original PST, training was completed for a variable amount of trials, until participants reached a minimum accuracy criterion for each pair of shapes. In the appetitive PST, participants completed 104 training trials over four runs, each 6 minutes and 44 seconds in length. Training was completed for a fixed number of trials to limit the impact of sensory specific satiety as participants consumed about 400mL of reinforcer beverages and tasteless neutral solution during the training. The length of the training was also limited because of the third major change to the PST: the training was completed during an fMRI scan. Neuroimaging adds constraints to the time available for participants to complete the training. As such, the number of trials was limited to the length of the scan window of 45
presented novel pairings of the shapes and asked to select the shape that is more likely to be “correct”. The pairings included one shape from the AB set (A: 80% correct, B: 20% correct), as this set is the most reliable predictor of positive/negative outcome. The proportion of trials in which that participant selects the A shape represented their sensitivity to reward, and the proportion of trials in which that participant avoids the B shape represented their sensitivity to punishment. 48 trials (24 with the A shape, 24 with the B shape) were presented.
Appetitive Conditioning Taste Administration Paradigm
Aim 3 uses data from an appetitive conditioning paradigm designed to examine brain response during cue-elicited anticipation of a palatable, chocolate milkshake and consumption of the milkshake (Figure 3.3).Cues were two images (a glass of milkshake and a glass of water) that signaled impending delivery of either 0.5 ml of milkshake or tasteless solution (respectively). On 40% of the trials the taste was not delivered following the cue to allow investigation of neural response to anticipation of a taste that was not paired with receipt of the taste (unpaired trials). However, no difference in response was observed between paired and unpaired milkshake and tasteless solution cues was observed in internal testing, paired and unpaired cues were combined for analyses to maximize statistical power. In total, there were 30 events each of milkshake receipt and tasteless solution receipt, and 50 events each of the milkshake cue and the tasteless solution cue. Tastes were delivered using programmable syringe pumps. Syringes filled with milkshake and tasteless solution were connected via flexible plastic tubing to a manifold that fit into participants' mouths and delivered the taste to a
Figure 3.3: Food Reward fMRI Paradigm
Functional Neuroimaging Analysis
Aim 1 of the dissertation applies advanced methods for the identification of functional networks in the brain. These methods are discussed here.
Functional Connectivity
Standard GLM-based fMRI analyses show regions of BOLD response following a
stimulus. The clusters identified from this approach are interpreted as independent, because the GLM model does not account for interactions between brain regions. However, research has established that cognition and behavior are not the result of independent activity across regions, but rather the product of connected brain response.144 Regions send information through
testing, while functional connectivity is more descriptive in nature. Functional connectivity analyses have the added benefit of application for prediction. Functional connectivity analyses can be applied to identify brain-connectivity signatures of disease states, or classify participants into groups.146 As such, applications of functional connectivity have rapidly increased in recent years.
Functional connectivity is measured as pairwise correlations between brain regions over time.99 Before calculating functional connectivity, researchers must select a priori regions of interest (ROIs) to model connectivity between. In fMRI data where no stimuli are presented, called resting-state scans, functional connectivity can be modelled as correlations between unmodeled BOLD response in ROIs. However, to measure functional connectivity in task-based fMRI data, additionally processing is required to account for stimuli. Multiple approaches exist to account for task design in functional connectivity analyses, this work uses betaseries
Figure 3.4: Betaseries Connectivity and Network Analyses
Graph Theory Network Analysis
sets of nodes and edges.149 In graph theory applications to neuroimaging, brain regions are treated as nodes and their functional correlations are treated as edges.149 Graph theory analysis can describe network structure using a wide number of metrics. Some key metrics for our investigation are presented in Table 3.2.
Table 3.2. Graph Characteristics and Metrics
Characteristic Description Metric Calculation
Modularity How a network separated into subnetworks/modules Modularity Maximization of the density of in module connections. Segregation How separate a node is from
the rest of the graph
Clustering Coefficient
The number of triads compared to possible triads Integration
How well connected a node is to other nodes outside its
community
Participation Coefficient
The ratio of in-community connections to out-community
connections Hubness How central a node is across the whole graph Betweenness Centrality
The number of shortest paths between nodes that travel
through that node In brief, the first metric we examined was modularity, which identifies densely connected modules (also called subnetworks or communities) that theoretically perform specialized
CHAPTER IV. NETWORK ORGANIZATION DURING PROBABILISTIC LEARNING VIA TASTE OUTCOMES
Overview
Reinforcement learning guides food decisions, yet how the brain learns from taste in humans is not fully understood. Existing research examines reinforcement learning from taste using passive condition paradigms, but response-dependent instrumental conditioning may better reflect natural eating behavior. Here, we examined brain response during a
taste-motivated reinforcement learning task and how measures of task-based network structure were related to behavioral outcomes. During a functional neuroimaging scan, 85 participants
completed a probabilistic selection task where reinforcement was delivered as a sweet, reward beverage, or a bitter, punishment beverage. Whole brain response and functional network topology measures, including identification of communities and community integration,
segregation, and hubness, were examined during choice, reward, and punishment conditions. During choice, we found robust whole brain response in the visual cortex, temporal gyrus, and motor cortex, and that regions of interest in the intracalcarine cortex and fusiform gyrus were organized into communities with the medial orbitofrontal cortex. Relative to the bitter taste, sweet taste was associated with increased whole brain response in the hippocampus, oral somatosensory cortex, and orbitofrontal cortex. Sweet taste was also related to differential community assignment of the ventromedial prefrontal cortex and ventrolateral prefrontal cortex. Lastly, during choice, increasing segregation of a community containing the amygdala,
decision-making and response to reinforcement on a response-dependent, taste-motivated conditioning task.
Introduction
Overweight and obesity affects over two thirds of American adults,151 making it a major preventable risk factor for a number of diseases including type 2 diabetes,152–154 certain types of cancer,30,155 and cardiovascular disease.2,156,157 A variety of individual, social, and environmental factors contribute to the development of overweight and obesity, but eating behavior is
considered a key point of study for understanding the etiology of obesity.8 At its core, eating behavior is made up of all the food choice we make over time. When making a choice about what to eat, information from internal states,11 food preferences,46 dietary goals,158 and the environment159,160 are integrated in the brain, which selects the best action to perform a
motivated action (e.g. satiating hunger, satisfying a craving, or following a diet). These decisions are represented by increased brain response in regions across the prefrontal and cingulate cortices,161 including the medial orbitofrontal cortex (mOFC), which encodes the value of an outcome;162 the anterior cingulate cortex (ACC), a region that assesses the cost of actions;163 the ventromedial prefrontal cortex (vmPFC), which weighs the value of an outcome against the costs associated with the action to assign overall value to actions;164,165 and the dorsolateral prefrontal cortex (dlPFC), a region that modulates computations.165
Once a choice is made, consuming the food selected provides initial information about the reinforcing properties of foods via the generation of flavor perceptions, which vary from delicious to disgusting. Sweetness, which indicates the potential presence of energy, is
reinforcement can be operationalized as instrumental conditioning.98 Following the instrumental conditioning framework: individuals learn to associate a cue (food image or logo) with a given response (e.g. choosing or avoiding the food), and the subsequent reinforcement from
consuming the food. In the brain, this process recruits aforementioned decision-making regions, and integrates signal from areas involved in motivation and taste processing.161 Neural
response to taste is well characterized - palatable taste evokes response in the striatum, insula, dorsal ACC, OFC, and amygdala,167,168 while bitter taste also activate the OFC and
amygdala.169,170
Standard analyses of functional neuroimaging data provide information about how blood oxygen level dependent (BOLD) response in the brain changes in response to a given stimulus, but does not capture how areas the brain interact in response to the stimulus. Cognition and behavior are the product of a coordinated flow of information between brain areas, and network-based approached provide important detail on the functional organization of the brain during response to a stimulus. Network based approaches are founded in functional connectivity, which characterizes how activity in brain regions correlate over time.99 Functional connectivity is undirected, and can exists between spatially distinct regions, theoretically reflecting
synchronous response. Functional connectivity is increased between the ventral striatum, insula, amygdala and hippocampus during reinforcement via monetary gain.103 In response to a palatable taste reinforcer, functional connectivity of the OFC and insula is increased.171
Network-based analyses of brain response apply graph-theory to functional connectivity and provide important information about the architecture of brain networks. Regions of the brain are treated as “nodes” of a graph and the functional connectivity as “edges.”100 Metrics include the organization of brain regions into functional subnetworks that are theorized to perform
specialized task (modularity); the density of connections of a region and its neighbors
reinforcement and motor learning, the communities reorganize, such that the communities become more segregated with learning.107,172 Network organization of the basal ganglia is particularly important in this process.173 To date, brain network organization during food reinforcement has not been probed.
Figure 4.1: Graph Theory Measures of Functional Network Organization
The extant studies on brain response during food reinforcement primarily use passive, classical conditioning tasks, where no choice is involved. Classical conditioning and
instrumental conditioning via secondary reinforcers are associated with differences in BOLD response,174 so it stands to reason that brain response during taste-mediated instrumental conditioning may diverge from prior response to passive conditioning tasks. To fill these gaps, this study tested brain response during instrumental conditioning with a taste reinforcer. We adapted a canonical probabilistic learning task, which measures learning from reward and punishment,78 by using beverages as reinforcement. The primary aim of the study was to
associated with a fewer number of communities than reward and punishment, reflecting more synchronization across the brain during choice. In addition to these aims, we also tested if measures of network segregation, hubness, and integration were connected to behavioral outcomes including task performance and preference ratings of the sweet and bitter beverages. We hypothesized that increased community segregation across conditions would be associated with improved task performance as measured by posttest accuracy.
Methods Sample
Ninety (n=90) male and female participants were recruited from the Chapel Hill, North Carolina area to complete a cross sectional study. Eligibility criteria included: 1) age 18-28 years, 2) body mass index between (BMI) 20.0 kg/m2 and 32.0 kg/m2. Exclusion criteria were: 1) contraindications of MRI (e.g. metal implants, piercings, pregnancy), 2) current smoking, 3) self-reported current or past diagnoses of an eating disorder, 4) chronic illness or medication requirement that could affect diet, 5) diagnosis of a major psychological condition (bipolar, schizophrenia, major affective disorder), and 6) allergy or intolerance to any study foods. The Institutional Review Board of the University of North Carolina at Chapel Hill approved all methods and study participants gave written consent before the start of testing. For this
analysis, three (n=3) participants who ended scanning early and two (n=2) participants who had <29 trials (representing 56% of possible trials) of reward or punishment were excluded. The resulting analytic sample was n=85 participants.
Measures
Anthropometrics & Demographics
Height (to the nearest 0.5 cm) and weight (to the nearest 0.1 kg) were measured with a wall-mounted stadiometer and a calibrated scale by trained research staff. BMI was calculated as kg/m2. Demographics including age, race, and ethnicity were assessed via self-report. Beverages and Preference Assessment
Beverages used in the instrumental conditioning task as reward and punishment were selected based on participant ratings via a taste test. During the taste test, participants were instructed to taste and rate 20mL samples of 4 sweet and 4 bitter beverages. The eight beverages were made from a base of water (940mL), unsweetened Kool-Aid® Cherry powder (4.5g) and simple syrup (60 mL). Simple syrup or a quinine solution were added to the
beverages to create different levels of sweetness or bitterness. The composition of the
beverages can be seen in Table 4.1. The beverages were calorically-matched with the addition of maltodextrin, a soluble, neutral-tasting carbohydrate powder. Levels of sweetness and bitterness were selected from previous studies of taste preference175. Beverages were rated in pleasantness, desire to consume, sweetness, bitterness and intensity on VAS anchored at -100 and 100. All sweet beverages were sampled in a random order, then participants ranked the beverages from most pleasant to least pleasant, with the highest ranked beverage selected as the reward for the probabilistic selection task (see 2.2.4). The same process was then
Table 4.1. Reinforcer Composition and Selection
Flavor kcal1 Sugar (g)1 Quinine (mg)1 dextrin (g)Malto- 1 Selected as Reinforcer Sweet 1 104.6 14.2 -- 20.9 11 (12.9%) Sweet 2 105.4 21.2 -- 10.5 17 (20.0%) Sweet 3 105.4 28.2 -- 5.3 20 (23.5%) Sweet 4 105.4 35.1 -- 0.0 37 (43.5%) Bitter 1 105.3 7.0 12.0 7.0 5 (5.9%) Bitter 2 105.3 6.8 24.0 7.1 11 (12.9%) Bitter 3 105.3 6.3 48.0 7.2 19 (22.4% Bitter 4 105.3 5.5 72.0 7.4 50 (58.8%) 1Values reported for 300mL portion of each beverage
Neuroimaging Methods
Anatomical and functional imaging data were collected in a Siemens Prisma 3T scanner (Siemens Medical Solutions, Munich, Germany) at UNC’s Biomedical Research Imaging Center (BRIC). Visual stimuli were presented with a digital projector/reverse screen display system. Tastants were delivered using programmable syringe pumps (Braintree Scientific BS-8000, Brain-Tree, MA) operated through a program written in PsychoPy,176 to ensure consistent volume, rate, and timing of taste delivery. A set of tubing attached to the scanner bed was placed into the participants' mouths and delivered the tastes. Button press response was collected via a 5-button response pad (Current Designs Pyka Response Pad, Philadelphia, PA) held in the participant’s right hand. Blood-oxygen-level-dependent (BOLD) signal was collected during functional runs under the following scanning parameters: TR = 2000ms, TE = 20ms, flip angle = 80°, with a spatial resolution of 3.0mm. Images were collected with whole-brain
TR/TE of 2100ms/2.4ms, flip angle of 15°, TI of 1100ms, matrix size of 256x256, FOV of 22cm, and slice thickness of 1mm.
Probabilistic Selection Task
Participants completed a modified, taste-based version of the Probabilistic Selection Task,78 measuring response to reward and punishment. The task was composed of training and posttest phases. In the training phase, participants were presented with pairs of novel shapes, and asked to select the “correct” shape to receive a reward. Participants were instructed that when they chose “incorrectly”, they would receive a punishment taste. Feedback was
probabilistic; each shape was reinforced at a prespecified probability. Three pairs were presented during the scan: 1) AB pair (A: 80% correct; B: 20% correct); 2) CD pair (C: 70% correct, D: 30% correct); 3) EF pair (E: 60% correct, F: 40% correct). Pairs were presented in a random, intermixed order. Reward and punishment feedback was given in the form of 3mL of sweet (correct) or bitter (incorrect) taste. Tastes were delivered over 5 seconds in the absence of any visual stimuli then followed by a 1mL rinse of a tasteless solution made to mimic the taste of saliva, delivered over 2 seconds. The next trial proceeded following a 3-7 second jitter. In total, participants completed 104 training trials over four runs, each 6 minutes and 44 seconds in length. Following the training phase during the fMRI scan, participants completed the posttest phase of the task outside of the scanner. During the posttest, participants were presented with one shape from the AB set (A: 80% correct, B: 20% correct) paired with shapes from the other two sets and asked to select the shape that is more likely to be “correct”. Learning was
using fMRIPrep. FMRIPrep preprocessing included skull stripping using Advanced
Normalization Tools (ANTs); tissue segmentation using FSL’s Automated Segmentation Tool (FAST); and spatial normalization to Montreal Neurological Institute (MNI) 152-Asymmetrical space using ANTs’ registration option. FreeSurfer was used to reconstruct surfaces from structural images. Functional images were then motion corrected using FSL’s MCFLIRT, corrected for fieldmap distortion, and spatially smoothed using a 6mm Gaussian full width half maximum isotropic kernel. In FSL, final preprocessing included adjusting for autocorrelation and highpass filtering and adjusting for nuisance regressors, including the 6 motion parameters, their derivatives, and high motion time points (>0.9).
FMRI Group-Level Main Effects Analysis
Neuroimaging analyses were primarily completed in FSL (FMRIB Software Library, www.fmrib.ox.ac.uk/fsl) Individual and group level analyses were carried out in FSL’s FMRI Expert Analysis Tool (FEAT).179,180 At the individual level, within subject models assessed brain response to 1) choice via button press > baseline; 2) reward via sweet taste > rinse; and 3) punishment via bitter taste > rinse. Individual level contrasts also included reward > punishment; and punishment > reward. Motion parameters were included as nuisance regressors at the individual level.