The Role of Obesity-Associated Adipose Tissue Inflammation in Breast Cancer Growth, Progression, and Metastasis
By Lydia Eisenbeis
Senior Honors Thesis Department of Nutrition
University of North Carolina at Chapel Hill May 1st, 2020
Approved:
______________________ Stephen D. Hursting, PhD, MPH (Advisor)
Abstract
Background: Breast cancer is currently the second leading cause of cancer-related death in the United States and the most commonly diagnosed cancer among women. Approximately 85,000 new cancer cases per year can be attributed to obesity, a known risk factor for breast cancer that alters key physiological pathways linked to tumorigenesis and metastasis. In the obese state, adipose tissue undergoes remodeling which promotes chronic, low-grade inflammation. This inflammatory response can result in increased serum levels of several proteins involved in cellular growth, proliferation and survival that are also known to support breast cancer progression and metastasis. In addition, obesity-associated adipocytes are known to secrete pro-inflammatory cytokines which have been indicated as potential mediators in the progression of breast cancer. Targeting inflammation using non-steroidal anti-inflammatory drugs (NSAIDs), such as Sulindac, has shown promising results in decreasing breast cancer recurrence; however, additional research is necessary to assess their efficacy in obesity-associated breast cancer models. This study therefore aims to investigate the role of obesity-associated changes in the adipose secretome in driving breast cancer progression and metastasis.
Methods: To model the response of breast cancer cells to alterations in the adipose secretome in vitro, we cultured multiple metastatic breast cancer cell lines in fat conditioned media (FCM) derived from the mammary fat pads of female C57Bl/6 mice on Control, diet-induced obesity (DIO), and DIO+Sulindac diets. Phenotypic assays including MTT and wound-healing assays were conducted to determine proliferative and migratory differences between the varying FCM diet conditions. Following characterization, pro-inflammatory mediators were identified using a Luminex assay and gene expression analysis in mammary adipose tissue. The efficacy of Sulindac as a strategy for mitigating obesity-associated adipose tissue inflammation and breast cancer progression was evaluated.
Results: Treatment with FCM, regardless of the diet group from which the FCM was obtained, increased both cell viability and migration of multiple breast cancer cell lines in vitro, indicating its role in promoting cancer cell proliferation and metastasis. No significant differences were observed between the Control, DIO and DIO+Sulindac diet conditions following phenotypic analysis; however, gene expression and multiplexed cytokine analyses revealed increased concentrations of pro-inflammatory cytokines in the DIO conditions relative to both control and DIO+Sulindac conditions.
Table of Contents
1. Introduction 5
a. Breast Cancer Prevalence and Mortality 5
b. Obesity and Breast Cancer 5
c. Obesity-Associated Adipose Tissue Inflammation 7 d. Effects of Anti-Inflammatory Treatment on Breast Cancer 9 e. Fat Conditioned Media as a Model for the Adipose Secretome 11
2. Goals and Hypothesis 13
3. Methods 14
4. Results 19
5. Discussion 39
6. Conclusion 49
Acknowledgements
Introduction
Breast Cancer Prevalence and Mortality
Cancer is a worldwide public health concern with rapidly increasing incidence and mortality rates1. In 2018 alone, there were 18.1 million new reported cancer cases and 9.1 million
cancer deaths2. Among women, breast cancer is the most commonly diagnosed cancer and the
second leading cause of cancer-related death in the United States2. Breast cancer starts as a
localized disease but has the capacity to spread to local lymph nodes and distant organs, a process known as metastasis. In breast cancer, metastatic spread most commonly occurs to the lungs, liver, bones, or brain, all of which present significant clinical challenges for breast cancer treatment3–5.
Although advances in treatment and early mammographic detection reported between 1989 and 2017 demonstrated a 40% decline in overall breast cancer deaths, metastasis remains one of the largest contributors to breast cancer mortality6. Importantly, patients with Stage I, localized breast
cancers have a nearly 100% five-year survival rate, whereas patients with Stage IV, metastatic breast cancers have only a 27% five-year survival rate7. As there is no cure for metastatic breast
cancer, current treatment options must instead focus on managing recurrence and progression of the disease, highlighting the importance of research in this field.
Obesity and Breast Cancer
Obesity is an epidemic affecting over one-third of the entire United States adult population and is an established risk factor for many breast cancer subtypes8,9. Approximately 85,000 new
cancer cases per year can be attributed to obesity, 9% of which are breast cancer cases10. Not only
sensitive to chemotherapy treatment compared to nonobese patients15–17. The higher body mass
index of obese individuals (BMI ≥ 30) has also been associated with greater risk of mortality following breast cancer diagnosis, with some studies indicating as much as a 3-fold increased risk compared to normal weight individuals18–21. Interestingly, even women with a normal-range BMI
but high body fat composition have been shown to exhibit similar health risks to obese individuals, due to poor adipose tissue quality and metabolic abnormalities22.
On a cellular level, an influx of excess energy in the obese state is converted to triacylglycerol and stored in adipose tissue depots. Adipose tissue accommodates for the accumulation of triacylglycerol primarily through the growth of preexisting adipocytes, a process known as adipose hypertrophy23. This chronic positive energy balance and atypical expansion of
adipocytes promotes adipocyte hypoxia and necrosis, which has previously been shown to drive nearby cells cells into a dynamic process known as epithelial-to-mesenchymal transition (EMT)23–
25. Cells that undergo EMT experience multiple molecular changes that enable them to transition
from polarized, epithelial cells into mobile, mesenchymal cells26,27. These changes enhance the
cell’s migratory capacity, stemness, invasiveness and resistance to apoptosis, which thereby contribute to cancer progression and metastasis27,28. Previous work in our lab utilizing obese mouse
models have demonstrated these phenotypic changes using MMTV-Wnt-1 basal-like breast cancer26. Gene expression analyses of tumors from lean and obese mice displayed significant
Numerous clinical studies have further investigated the prognostic significance of tumor cell invasion into peritumoral adipose tissue29,30. Adipose tissue invasion by breast cancer cells has
been found to be positively correlated with tumor burden, metastatic spread, and poor patient outcome31,32. Strikingly, a 2008 study revealed axillary lymph node metastases in 40.7% of
patients with adipose tissue invasion by breast cancer cells. Only 11.3% of patients without adipose tissue invasion, however, developed metastases32. Experimental data report a similar oncogenic
relationship between adipose tissue and tumor cells—mice injected with mammary carcinoma cells demonstrated increased cell growth in adipocyte-rich environments, as well as more efficient metastatic spread33,34. Although both obesity and adipose tissue have been shown to alter cancer
outcomes by modifying many pathways involved in tumorigenesis and metastasis, the precise mechanisms modeling these responses remain illusive25,35.
Obesity-Associated Adipose Tissue Inflammation
Despite the gap in knowledge surrounding the obesity-breast cancer link, one well-known hallmark of dysfunctional adipose tissue remodeling in the obese state is the establishment of a pro-inflammatory microenvironment24. This inflammatory response, stimulated in part by
infiltrating cells such as macrophages, dendritic cells and fibroblasts, can result in increased serum levels of several proteins involved in cancer growth and progression36. In addition, it has been
suggested that the proximity of adipocytes to growing tumors facilitates metabolic symbiosis—
the adipocytes drive a metabolic shift in cancer cells to increase utilization of available fuel sources, thereby supporting tumor growth37,38. As a part of this adipocyte-cancer crosstalk,
interleukin (IL)-6, has been noted to increase tumor cell differentiation and angiogenesis, aiding in cancer cell development40–42. There is experimental evidence that the overexpression of IL-6 in
tumor-surrounding adipocytes may directly mediate the invasive activity of metastatic 4T1 breast cancer cells in murine models, and when depleted with anti-IL-6 antibodies, these invasive capabilities are decreased34,43–45. Importantly, human models have demonstrated a similar
response, as high levels of serum IL-6 has been clinically correlated with larger tumor size and faster disease progression46.
Sustained obesity also increases the production of prostaglandins—a group of inflammatory signaling molecules derived from long-chain fatty acids that are associated with enhanced cancer cell survival, migration, and immunosuppression47. Analyses of breast tissue
from obese women have demonstrated increased levels of prostaglandins compared to lean women48. Furthermore, elevated intratumoral prostaglandin levels in the obese state have been
linked to tumor progression of multiple cancer cell lines by directly inhibiting the proliferative functions of CD4+ and CD8+ T cells49–51. This inhibition blocks adaptive immunity, and
subsequently drives CD4+ differentiation into regulatory T cells, further suppressing the immune response49,50. One specific eicosanoid thought to contribute to immune evasion, Prostaglandin E2
(PGE2), has also been detected in high amounts in malignant breast tumors52. PGE2 has recently
emerged as a mediator of oncogenic signaling pathways in breast cancer tumor cells, contributing to regulatory T cell proliferation, impaired NK cell viability, and M2 macrophage promotion, all of which support immune suppression and subsequent tumorigenesis53,54. Additionally, migratory
murine C3L5 and human MDA-MB-231 breast cancer cells show elevated PGE2 levels in
The accumulation of PGE2 in breast cancer models is in part stimulated by aberrant
upregulation of the enzymes necessary for its production: Cyclooxygenase 1 and 2 (COX-1, and COX-2)55. The current body of evidence suggests that these enzymes are regulated by growth
factors and pro-inflammatory cytokines, such as IL-6, that are secreted by the adipose tissue under obese conditions57. Moreover, overexpression of the inducible COX-2 enzyme has been observed
in approximately 40% of breast cancer patients, but not observed in normal breast tissue58,59.
Elevated COX signaling has also been positively correlated with several factors related to the aggressiveness of breast cancer including tumor size, proliferative rate, and metastasis59,60. These
factors contribute to overall worse patient outcome, and five-year disease-free survival rates were found to be significantly lower in patients with overexpressed COX-2 levels compared to those with low COX-2 levels60. The COX and PGE2-stimulated inflammatory response not only creates
a favorable environment for cancer cell growth and survival, but has also been shown to increase chemoresistance in many cancer subtypes61,62. Although the present knowledge concerning the
role of adipocytes in chemoresistance is limited, current evidence suggests that PGE2, previously
implicated in promoting obesity-associated inflammation, may also mediate chemoresistance by supporting cancer stem cell survival62. This data illustrates the limits of current treatment plans
and the importance of further research regarding the crosstalk between the adipose tissue and cancer cells.
Effects of Anti-Inflammatory Treatment on Breast Cancer
COX-2 enzyme in knockout mice reduced tumor burden by 50% and decreased overall tumor sizes compared to wild-type mice63. Additional experimental studies have indicated that inhibition of
COX-1 and COX-2, using specific non-steroidal anti-inflammatory drugs (NSAIDs), is sufficient to lower serum prostaglandin levels and decrease the inflammatory burden on the host36. Treatment
with the NSAID aspirin, in synergy with an anti-PD-1 antibody, promoted both rapid tumor regression and eradication of melanoma tumors in mice when compared to anti-PD-1 treatment alone65. NSAIDs have even shown potent anti-proliferative results by inducing cell apoptosis in
many cancer subtypes66–68. Furthermore, the benefits of NSAIDs in clinical oncology have been
indicated in numerous studies. In colorectal, prostate, and ovarian cancers, epidemiologists have identified an inverse relationship between NSAID use and cancer incidence, with significantly decreased cancer risk following NSAID treatment69–71. Similar data is also available for breast
cancer, as studies have indicated that women who regularly consumed the NSAID aspirin are at a 20% lower risk for developing breast cancer than those who do not consume aspirin72. In addition
to cancer prevention, studies have also shown that NSAID usage can reduce breast cancer recurrence and chronic low-grade inflammation, particularly among obese women39.
Preliminary work in our lab has demonstrated this link between obesity-associated inflammation and breast cancer using the NSAID Sulindac, a dual COX-1 and COX-2 inhibitor that decreases downstream production of PGE2. Upon analysis, mice fed a DIO (diet-induced
findings suggest a strong link between inflammatory mediators in obesity-associated adipose tissue and breast cancer progression.
Fat Conditioned Media as a Model for the Adipose Secretome
Current, but limited research investigating the role of adipocytes in the progression of numerous cancers have utilized media conditioned from varying adipocyte sources to model the adipose secretome in vitro73–78. Adipose explants and subsequent adipose conditioned media are
often difficult to work with and must be cultured fresh; however, they provide one of the most representative methods for studying and characterizing the adipose secretome, and therefore the interaction between adipocytes and cancer cells in vitro. Many of the current studies utilizing conditioned media use adipose derived stem cells (ASCs), 3T3-L1 adipocytes, or preadipocytes to generate their media73–77,79. While these studies have indicated increased proliferative and
migratory activity of multiple cancer cell lines cultured in conditioned media, the results remain inconsistent across multiple different sources and lack generalizability74–78. An additional
drawback of these studies is that the sources of conditioned media are manipulated to contain purified and cultured cells or cell lines, and are thus not representative of the numerous primary cell types present in the adipose tissue in vivo74,77–79.
Goals and Hypothesis
This project aims to elucidate the mechanisms and specific pro-inflammatory mediators through which obesity-associated adipose tissue inflammation promotes breast cancer growth, progression, and metastasis using FCM as a model for the adipose secretome in vitro.
Aim 1. Test the effects of FCM on the metastatic potential of breast cancer cell lines in vitro.
Multiple metastatic cell lines were cultured in either control, DIO, or DIO+Sulindac FCM. Cell line viability and proliferation in response to FCM dosing were assayed using MTT assays. Once an effective dose was determined, functional assays using all three FCM conditions were performed. Breast cancer cells conditioned with FCM were assayed for classical metastatic phenotyping including wound-healing assays.
Aim 2. Identify pro-inflammatory candidates secreted from mammary adipose tissue that
drive tumor growth and metastatic potential in the obese state.
Methods
Preliminary Animal Study
180 9-week old female C57BL/6NCrl mice (Charles River Labs, Wilmington, MA) were randomized to receive either a Control (10% kcal from fat, D12450J Research Diets) diet or a DIO (60% kcal from fat, D12492 Research Diets) diet for 15 weeks. After 15 weeks on diet, the mice were randomized to either stay on diet or switch to the same diet supplemented with 140 ppm Sulindac for an additional five weeks. Mice were then injected orthotopically into the 4th mammary
fat pad with 20,000 cells of either E0771, metM-WntLiver, or metM-WntLung metastatic tumor cell
lines. Mice were palpated for tumor growth and imaged via in vivo IVIS bioluminescent imagining to monitor metastasis (PerkinElmer, Akron, OH). Mice were sacrificed when primary tumor size reached 1.5cm in any direction. Excised tumors were measured and weighed ex vivo and taken for formalin fixation-paraffin embedding (FFPE) to be sectioned for GFP immunohistochemical (IHC) staining. Intensity of GFP-IHC stain was quantified to determine overall metastatic burden.
Generation of FCM
incubated at 37°C for 24 hours to allow for saturation of secreted factors. Following incubation, media was sterile-filtered through a 0.2𝜇𝑚 vacuum filter and stored in 1mL aliquots at -80°C.
FCM Filtration
Control, DIO, and DIO+Sulindac FCM aliquots were thawed on ice and thoroughly mixed prior to filtration. The FCM was then divided into two equivalent volumes of 500µL each. One 500µL aliquot was set aside on ice as the unfiltered FCM, while the other was added to an Amicon Ultra-0.5 centrifugal filter (3 kDa membrane size) (Sigma Aldrich, St. Louis, MO) and centrifuged at 4°C, 14,000xg for 15 minutes to isolate proteins above 3 kilodaltons in size. Following the initial centrifugation, the filtered, deproteinated flow-through was collected and resuspended back to 500µL with sterile 1X Phosphate Buffered Saline (PBS). The protein filtrate was captured in the centrifugal filter was washed three times with 250µL of 1X PBS and centrifuged for 5 minutes at 14,000xg and 4°C following each subsequent wash. The final, protein-containing filtrate of FCM was collected through centrifugation at 10,000xg and 4°C for 3 minutes and resuspended back to 500µL in PBS. Each unfiltered, filtered flow-through and filtrate fraction was mixed with 2% FBS media to the appropriate, dilute concentration. All steps were done on ice or at 4°C.
Pierce Bicinchoninic Acid (BCA) Total Protein
BCA was performed according to manufacturer’s protocol (ThermoFisher Scientific,
Waltham, MA). Briefly, dilute albumin Bovine Serum Albumin (BSA) standards were prepared using stock albumin standard and PBS in triplicate. 0.25𝜇𝐿 of BSA standards, and unfiltered FCM samples from each of the Control, DIO, and DIO+Sulindac diet conditions were mixed with 200𝜇𝐿
subtracted from each BSA standard and FCM sample absorbance value and plotted as a standard curve to determine protein concentration.
Cell Concentration MTT Assay
MTT assays were conducted using a progression series of four murine breast cancer cell lines, all generated using the MMTV-Wnt1 model. Two nonmetastatic breast cancer lines, E-Wnt (basal-like, ER+) and M-Wnt (claudin-low, TNBC) were grown directly from clones taken from an MMTV-Wnt1 tumor80, while two metastatic lines, metM-WntLiver, metM-WntLung, were derived
from the liver and lung metastases following serial transplantation of the nonmetastatic M-Wnt cell line into the mammary fat pad of a SCID mouse81. The metM-WntLiver, metM-WntLung, and
M-Wnt cell lines (2,500 cells per well) were seeded separately in serum restricted, 2% FBS cell culture media in 96 well plates and incubated for 24 hours at 37ºC and 5% CO2. Following
incubation, culture media was replaced with 200µL of either control 2% FBS media, or a 1:10 dilution of Control, DIO, or DIO+Sulindac FCM in 2% FBS media for an additional 24 hours. Media was then aspirated and the cells were stained with 100uL of MTT solution (1:10 dilution of 3-(4,5-dimethylthiazol-2-yl)-2,5-diphenyl tetrazolium bromide and 2% cell culture media) for an additional 2 hours, covered, and incubated at 37°C and 5% CO2. The MTT reagent was removed,
Additional 96 well plates of human derived MDA-MB-231 breast cancer cells (10,000 cells per well), and metM-WntLiver (25,000 cells per well) were seeded in 2% FBS media and incubated
for 24 hours at 37ºC and 5% CO2.MetM-WntLung ObR3 (Ob-R shRNA plasmid transfected into
metM-WntLung cells to generate leptin receptor knockdown cell lines26, 25,000 cells per well) and
metM-WntLung Con5 (scrambled control shRNA Plasmid transfected into metM-WntLung cells26,
25,000 cells per well) cell lines were also seeded, but in 2% FBS media with 2𝜇𝑔/𝑚𝐿 Puromycin (to maintain plasmid in cell lines), and incubated for 24 hours at 37ºC and 5% CO2. Media was
removed and the cells were then treated with 100uL DIO FCM at a 1:20, 1:40, 1:80, 1:160, 1:320, 1:640, or 1:1280 concentration for either 24 or 48 hours. Subsequent MTT assays with these cell lines were conducted using either Control or DIO FCM at 1:10, 1:20, 1:40, 1:80, and 1:160 concentrations. MTTs were completed following the same procedure listed above.
Wound-Healing Assay
Cell migration chambers (Ibidi, Fitchburg, WI) were placed in each well of a 24 well plate. The metM-WntLiver and metM-WntLung metastatic cell lines and the M-Wnt non-metastatic cell line
(35,000 cells chamber side) were seeded in 2% FBS media with an additional 3mL of 2% FBS media surrounding the chambers, and placed in an incubator at 37°C and 5% CO2 for 18-24 hours.
Subsequent assays using metM-WntLiver, metM-WntLung Obr3, and metM-WntLung Con5 cell lines
additional 24 hours of treatment. Final images were taken on the EVOS FL Auto 2 Imaging System and percent closure was calculated using the MRI Wound Healing Plugin on ImageJ software.
Luminex Assay
Luminex assays were performed according to the Novex Multiplex kit manufacturer specifications (ThermoFisher Scientific, Waltham, MA) and analyzed on a Luminex MAGPIX (Luminex, Austin, TX). Unfiltered, protein filtrate, and flow-through fractions from Control, DIO, and DIO+Sulindac FCM diet conditions were prepared in 1:1, 1:2, and 1:4 dilute concentrations for the cytokine panel and 1:4, 1:8, and 1:16 dilute concentrations for the diabetes panel.
Gene Expression Analysis
Mammary fat pads contralateral from growing tumor were harvested from lean and obese mice. Tissue was flash-frozen and subsequently processed for microarray gene expression analysis using Clariom S HT arrays (Affymetrix, Santa Clara, CA). Sample-level gene expression levels were generated using TAC 4.0 software (Affymetrix, Santa Clara, CA). Gene Set Enrichment Analysis (GSEA) was performed on sample-level data as previously described82,83. Leading edge
Results
1. Sulindac reverses the tumor burden and metastatic potential of breast cancer in vivo
Preliminary work assessing the efficacy of NSAIDs on breast cancer outcomes in obese mouse models determined Sulindac to be a compelling treatment option for reducing tumor burden. Female C57Bl/6 mice fed DIO and DIO+Sulindac diets exhibited increased weight gain over the course of 24 weeks compared to mice fed Control and Control+Sulindac diets (Figure 1A). No differences were noted between the Sulindac groups and their non-Sulindac supplemented counterparts. DIO mice also demonstrated significantly larger tumor weights compared to the other diet group conditions in the metM-WntLiver cell lines (Figure 1B, p<0.001), metM-WntLung (Figure
1C, p<0.001), and E0771 (Figure 1D, p<0.001) cell lines. The E0771 and metM-WntLiver tumor
bearing mice on DIO+Sulindac diets grew tumors similar in size to both the Control and Control+Sulindac diet groups while the DIO+Sulindac mice with metM-WntLung tumors exhibited
weights similar in size to only the Control diet.
Metastatic potential of the mice on each diet was assessed and calculated using total percent lung metastases. Mice fed a DIO diet had a significantly greater occurrence of lung metastases compared to the other diets in each of the metM-WntLiver (Figure 1E, p<0.001), metM-WntLung
Figure 1. Control, Control+Sulindac, DIO, and DIO+Sulindac mouse weights measured over a 24 week time period on diet (A). Ex vivo primary tumor weights measured 4 weeks post injection of metM-WntLiver (B), or metM-WntLung (C), E0771 (D) cells. Percentage of lung metastases in
metM-WntLiver (E), and metM-WntLung (F), E0771 (G) cell lines. Statistical analysis conducted
Cont rol
Cont rol+
Sulin
dac DIO
DIO+ Sulin dac 0 2 4 6 8 Diet Group W ei g h t (g )
metM-Wntliver Ex Vivo Tumor Weight
a
a
a b
5 10 15 20
15 20 25 30 35 Week W ei g h t (g )
Mouse Weights by Diet Group
Control Control+Sulindac DIO DIO+Sulindac Diet Switch Tumor Injection B Cont rol Cont rol+ Sulin
dac DIO
DIO+ Sulin dac 0 20 40 60
metM-Wntliver Lung Metastases
L u n g M et as ta si s (% ) a a b a Cont rol Cont rol+ Sulin
dac DIO
DIO+ Sulin dac 0 1 2 3 Diet Group W ei g h t (g )
E0771 Ex Vivo Tumor Weight
a a
a b
C D
Cont rol Cont rol+ Sulin
dac DIO
DIO+ Sulin dac 0 20 40 60
metM-Wntlung Lung Metastases
L u n g M et as ta si s (% ) a a b a Cont rol Cont rol+ Sulin
dac DIO
DIO+ Sulin dac 0 20 40 60 80 100
E0771 Lung Metastases
L u n g M et as ta si s (% ) a a b a Cont rol Cont rol+ Sulin
dac DIO
DIO+ Sulin dac 0 1 2 3 4 Diet Group W ei g h t (g )
metM-Wntlung Ex Vivo Tumor Weight
a,c
a
c b
E F G
2. Adipose tissue remodeling increases cancer cell proliferation in vitro
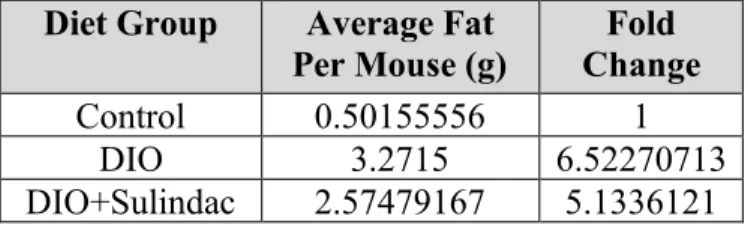
Having demonstrated that diet-induced obesity drives breast cancer progression and metastasis but is counteracted by Sulindac treatment in vivo, the mechanisms underlying this relationship were further explored using FCM in vitro. As was seen in the previous mouse study, mice that were used to generate FCM demonstrated increased weight gain in the DIO and DIO+Sulindac diet groups compared to the Control diet group (Figure 3A). Further analysis of the ex vivo mammary fat pad weights, shown in Figure 3B, indicate a significant increase in fat pad weight for the DIO mice compared to control mice (p<0.0001) and a significant decrease in weight for the DIO+Sulindac mice compared to the DIO mice (p<0.0001). Average fat per mouse was calculated in Table 1 and fold change differences were determined for the DIO and DIO+Sulindac mice compared to the Control mice. These results indicate that the average fat per DIO mouse was approximately 6.52 times greater, and per DIO+Sulindac mouse was approximately 5.13 times greater than the average Control fat pad weights.
Figure 3. Mouse weights on Control, DIO, and DIO+Sulindac diets over 8 months (A) and their mammary fat pad weights prior to FCM derivation (B). Statistical analysis was conducted using a
one-way ANOVA with a Tukey’s multiple comparisons test.
Table 1. Average fat per mouse in each diet group and calculated fold change differences in DIO and DIO+Sulindac mice compared to Control mice.
Diet Group Protein Concentration (µg/mL)
Control 1472.806
DIO 1368.806
DIO+Sulindac 1224.472
Table 2. BCA protein concentrations for Control, DIO and DIO+Sulindac FCM diets.
15-J un-2 018 24-A ug-2 018 2-No v-20 18 11-J an-2 019 0 20 40 60 Date W ei g h t (g ) Mouse Weights Control DIO DIO+Sulindac Cont rol DIO
DIO+ Sulin dac 0 1 2 3 4 5
Mammary Fat Pad Weight
Diet Group W ei g h t (g ) a b c
A B
Diet Group Average Fat Per Mouse (g)
Fold Change
Control 0.50155556 1
DIO 3.2715 6.52270713
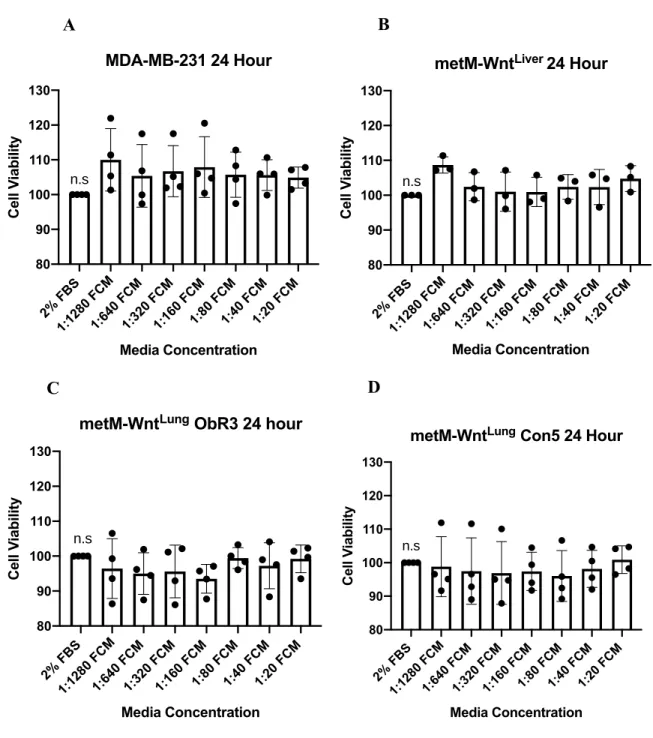
To assess the cell viability of multiple metastatic breast cancer cells following treatment with FCM, MTT assays were performed. Initial experiments were conducted using only DIO FCM to determine the most effective dosage. Six serial dilutions of FCM starting at a 1:20 concentration were completed with MDA-MB-231, metM-WntLiver, metM-WntLung ObR3, and metM-WntLung
Con5 breast cancer cell lines. Both 24 hour (Figure 4) and 48 hour (Figure 5) treatments were assessed and three biological replicates were completed. The 24-hour treatment in Figure 4 illustrated inconsistencies across the four cell lines, with variability between the biological replicates and insignificant differences between concentrations. On the other hand, the 48-hour treatment in Figure 5 demonstrated more consistent biological replicates with a similar trend across all four cell lines—as the concentration of FCM increased, the cell viability improved, reaching peak cell growth at a 1:20 concentration. Although there were varying differences across each cell line, all except the metM-WntLung Con5 demonstrated significantly greater cell growth at a 1:20
Figure 4. Cell viability of MDA-MB-231 (A), metM-WntLiver (B), metM-WntLung ObR3 (C),
and metM-WntLung Con5 (D) cell lines treated with DIO FCM to assess appropriate
concentration dosages over a 24 hour time period. Statistical analysis was conducted using a
one-way ANOVA with a Dunnett’s multiple comparison test (n.s = non-significant).
2% F BS
1:12 80 F
CM
1:64 0 FC
M
1:32 0 FC
M
1:16 0 FC
M 1:80 FCM 1:40 FCM 1:20 FCM 80 90 100 110 120 130 Media Concentration C el l V ia b ili ty
MDA-MB-231 24 Hour
n.s
2% F BS
1:12 80 F
CM
1:64 0 FC
M
1:32 0 FC
M
1:16 0 FC
M 1:80 FCM 1:40 FCM 1:20 FCM 80 90 100 110 120 130 Media Concentration C el l V ia b ili ty
metM-WntLiver 24 Hour
n.s
2% F BS
1:12 80 F
CM
1:64 0 FC
M
1:32 0 FC
M
1:16 0 FC
M 1:80 FCM 1:40 FCM 1:20 FCM 80 90 100 110 120 130 Media Concentration C el l V ia b ili ty
metM-WntLung ObR3 24 hour
n.s
2% F
BS
1:12
80 F
CM
1:64
0 FC
M
1:32
0 FC
M
1:16
0 FC
M 1:80 FCM 1:40 FCM 1:20 FCM 80 90 100 110 120 130 Media Concentration C el l V ia b ili ty
metM-WntLung Con5 24 Hour
n.s
A B
Figure 5. Cell viability of MDA-MB-231 (A), metM-WntLiver (B), metM-WntLung ObR3 (C),
and metM-WntLung Con5 (D) cell lines treated with DIO FCM to assess appropriate
concentration dosages over a 48 hour time period. Statistical analysis was conducted using a
one-way ANOVA with Dunnett’s multiple comparison test.
2% F BS
1:12 80 F
CM
1:64 0 FC
M
1:32 0 FC
M
1:16 0 FC
M 1:80 FCM 1:40 FCM 1:20 FCM 90 100 110 120 130 140 150 Media Concentration C el l V ia b ili ty
MDA-MB-231 48 Hour
a,b a,b
a a,b a,b,c a,b,c,d
b,c,d b,c,d
2% F
BS
1:12
80 F
CM
1:64
0 FC
M
1:32
0 FC
M
1:16
0 FC
M 1:80 FCM 1:40 FCM 1:20 FCM 90 100 110 120 130 140 150 Media Concentration C el l V ia b ili ty
metM-WntLiver 48 Hour
a a,b,c b,c c d a,b,c a,b,c a,b,c
2% F BS
1:12 80 F
CM
1:64 0 FC
M
1:32 0 FC
M
1:16 0 FC
M 1:80 FCM 1:40 FCM 1:20 FCM 90 100 110 120 130 140 150 Media Concentration C el l V ia b ili ty
metM-WntLung ObR3 48 Hour
a a a a a b b b
2% F BS
1:12 80 F
CM
1:64 0 FC
M
1:32 0 FC
M
1:16 0 FC
M 1:80 FCM 1:40 FCM 1:20 FCM 90 100 110 120 130 140 150 Media Concentration C el l V ia b ili ty
metM-WntLung Con5 48 Hour
a
a a a a a
a a
A B
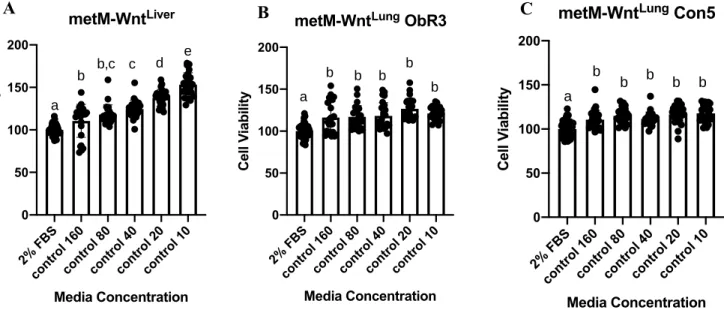
The MTT cell viability experiments were repeated using both Control and DIO FCM conditions, this time for three 24-hour biological replicates at 1:160, 1:80, 1:40, 1:20, and 1:10 concentrations. The MDA-MB-231 cell line was excluded from further assays due to growth variability and inconsistency. In the metM-WntLiver, metM-WntLung ObR3, and metM-WntLung
Con5 cell lines,all Control FCM (Figure 6) and DIO FCM (Figure 7) concentrations demonstrated significantly increased cell viability compared to the 2% FBS control. Furthermore, treatment with DIO FCM exhibited a greater dose-response effect than Control FCM treatment, with the greatest increase in cell viability at the 1:10 concentration for the metM-WntLiver (Figure 7A),
metM-WntLung ObR3 (Figure 7B) and metM-WntLung Con5 (Figure 7C) cell lines.
Figure 6. Cell viability of metM-WntLiver (A), metM-WntLung ObR3 (B), and metM-WntLung
Con5 (C) cell lines treated with Control FCM concentrations for 24 hours. Statistical analysis conducted using a one-way ANOVA with Tukey’s multiple comparisons test.
2% F
BS
cont
rol 1
60
cont
rol 8
0
cont
rol 4
0
cont
rol 2
0
cont
rol 1
0 0 50 100 150 200 metM-WntLiver Media Concentration C el l V ia b ili ty a
b b,c c d e
2% F
BS
cont
rol 1
60
cont
rol 8
0
cont
rol 4
0
cont
rol 2
0
cont
rol 1
0 0 50 100 150 200
metM-WntLung ObR3
Media Concentration C el l V ia b ili ty a
b b b b
b
2% F BS
cont rol 1
60
cont rol 8
0
cont rol 4
0
cont rol 2
0
cont rol 1
0 0 50 100 150 200 Media Concentration C el l V ia b ili ty
metM-WntLung Con5
a b
b b b b
Figure 7. Cell viability of metM-WntLiver (A), metM-WntLung ObR3 (B), and metM-WntLung
Con5 (C) cell lines treated with DIO FCM concentrations for 24 hours. Statistical analysis conducting using a one-way ANOVA with Tukey’s multiple comparisons test.
Given the in vivo mouse study results, a comparison between the Control FCM data in Figure 6 to the DIO FCM data in Figure 7 was expected to be robust; however, no noteworthy differences were observed. We considered that since the FCM was generated directly from the mammary fat pads of the mice, it may contain high levels of free fatty acids (especially in DIO FCM), which have been previously shown to induce apoptosis in breast cancer cell lines84. We therefore filtered
the FCM using Amicon Ultra-0.5 filters into protein-containing filtrate and non-protein containing flow-through fractions. After filtration, three more MTT biological replicates were conducted using Control, DIO and DIO+Sulindac FCM at a 1:10 concentration. Testing conditions included unfiltered FCM, protein filtrate FCM, and flow-through FCM fractions with metM-WntLiver,
metM-WntLung, and non-metastatic M-Wnt cell lines. The filtered flow-through FCM fractions
indicated that the filtration was successful for the metM-WntLiver (Figure 8A), metM-WntLung
(Figure 8B), and M-Wnt (Figure 8C) cell lines. Following 24 hours of FCM treatment, the only
2% F BS DIO 160 DIO 80 DIO 40 DIO 20 DIO 10 0 50 100 150 200 Media Concentration C el l V ia b ili ty metM-WntLiver
a a a,b b c
d
2% F BS DIO 160 DIO 80 DIO 40 DIO 20 DIO 10 0 50 100 150 200 Media Concentration C el l V ia b ili ty
metM-WntLung ObR3
a a,b b,c b,c c d
A B
2% F BS DIO 160 DIO 80 DIO 40 DIO 20 DIO 10 0 50 100 150 200 Media Concentration C el l V ia b ili ty
metM-WntLung Con5
a a,b a,b a,b b c
significant difference observed between the diet conditions for all cell lines was a decrease in viability of cells treated with DIO FCM filtered flow-through, suggesting that a non-protein component was likely decreasing viability of cells treated with the unfiltered DIO FCM as well. The unfiltered fractions of each diet condition and for each of the metM-WntLiver (Figure 8D),
metM-WntLung (Figure 8E), and non-metastatic M-Wnt (Figure 8F) cell lines showed a significant
increase in cell viability compared to the 2% FBS control. Differences between the unfiltered FCM conditions were non-significant for all three cell lines.
MTT assays utilizing the filtered protein-containing filtrate fractions (Figure 8 G-I) demonstrated similar trends to the unfiltered FCM conditions, but with greater differences between diet conditions. When metM-WntLung cells were cultured in FCM, the Control-treated cells showed
significantly increased viability compared to DIO-treated (p=0.0431), but the other comparisons were not (Figure 8H). The M-Wnt cells also exhibited a significant increase in viability in cells treated with Control vs DIO FCM (p=0.0086), but again, not for the other conditions (Figure 8I). The metM-WntLiver, on the other hand, did not show any significant differences between any diet
2% F
BS
Cont
rol U
F DIO UF DIOS UF 0 50 100 150 200 metM-WntLiver Media Type C el l V ia b ili ty b b b a
2% F
BS
Cont
rol U
F DIO UF DIOS UF 0 50 100 150 200 metM-WntLung Media Type C el l V ia b ili
ty a b b
a,b
2% F
BS
Cont
rol U
F DIO UF DIOS UF 0 50 100 150 200 M-Wnt Media Type C el l V ia b ili ty b b b a
D E F
2% F BS
Cont rol F
iltra te DIO Filtr ate DIOS Filt rate 0 50 100 150 200 metM-WntLiver Media Type C el l V ia b ili ty
b b b
a
2% F
BS
Cont
rol F
iltra te DIO Filtr ate DIOS Filt rate 0 50 100 150 200 C el l V ia b ili ty metM-WntLung
b c b,c
a
2% F BS
Cont rol F
iltra te DIO Filtr ate DIOS Filt rate 0 50 100 150 200 M-Wnt C el l V ia b ili ty
b c b,c
a
G H I
2% F BS
Cont rol F
low Thro ugh DIO Flow Thr ough DIOS Flo
w Th roug h 0 50 100 150 metM-WntLiver Media Type C el l V ia b ili ty a a b a
2% F
BS
Cont
rol F
low Thro ugh DIO Flow Thr ough DIOS Flo
w Th
roug h 0 50 100 150 metM-WntLung Media Type C el l V ia b ili ty a a b a
A B C
2% F
BS
Cont
rol F
low
Thr
ough
DIO
Flo
w T
hrou
gh
DIO
S Fl
ow T
Figure 8. Cell viability for metM-WntLiver (A), metM-WntLung (B), and M-Wnt (C) cell lines
cultured in Control, DIO, and DIO+Sulindac filtered FCM flow-through conditions. Cell viability for metM-WntLiver (D), metM-WntLung (E), and M-Wnt (F) cell lines cultured in Control, DIO, and
DIO+Sulindac unfiltered FCM conditions. Cell viability for metM-WntLiver (G), metM-WntLung
(H), and M-Wnt (I) cell lines cultured in Control, DIO, and DIO+Sulindac filtered FCM filtrate conditions. Statistical analysis was conducted using a one-way ANOVA with Tukey’s multiple
comparison test.
Although there were greater observed differences in cell viability between the FCM diet conditions for the protein-containing filtrate compared to the unfiltered fraction, the differences between diet groups were again not as robust as expected. We therefore questioned how representative the quantity of fat used to generate the FCM was of the actual adipose secretome in vitro. As was seen in Table 1, the DIO and DIO+Sulindac mice had, on average, more fat per
mouse than the Control mice; however, the FCM was generating using a normalized 100mg of fat per 1mL of media for each diet condition. By treating with FCM generated from a standardized mass of fat from each diet group, we were potentially misrepresenting actual growing conditions in vivo. In the obese mouse, adjacent tumor cells were exposed to a secretome from a much larger
Figure 9. Cell viability for metM-WntLiver (A), metM-WntLung (B), and M-Wnt (C) cell lines
cultured in 1:10 Control and 1:5 DIO unfiltered conditions. Cell viability for metM-WntLiver (D),
metM-WntLung (E), and M-Wnt (F) cell lines cultured in 1:10 Control 1:5 DIO filtered FCM filtrate
conditions.
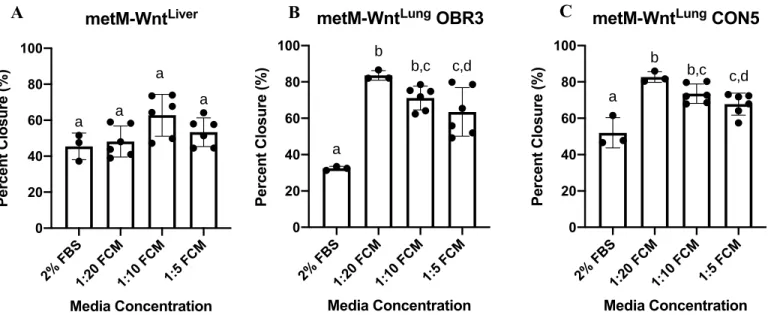
3. Fat conditioned media drives breast cancer migration in vitro
To assess the impact of the obese microenvironment on tumor cell migration, wound healing assays were conducted with metM-WntLiver, metM-WntLung Obr3 (leptin receptor knockdown) and
metM-WntLung Con5 (scramble control) breast cancer cell lines. Specifically, we elected to utilize
2% F
BS
Cont
rol U
F DIO UF 0 50 100 150 200 metM-WntLiver Media Type C el l V ia b ili ty
2% F
BS
Cont
rol U
F DIO UF 0 50 100 150 200 Media Type C el l V ia b ili ty metM-WntLung
2% F BS
Cont rol U
F DIO UF 0 50 100 150 200 M-Wnt Media Type C el l V ia b ili ty
A B C
2% F BS
Cont rol F
iltra te DIO Filtr ate 0 50 100 150 200 250 Media Type C el l V ia b ili ty metM-WntLiver
2% F BS
Cont rol F
iltra te DIO Filtr ate 0 50 100 150 200 250 Media Type C el l V ia b ili ty metM-WntLung
2% F
BS
Cont
rol F
iltra te DIO Filt rate 0 50 100 150 200 250 M-Wnt Media Type C el l V ia b ili ty
the metM-WntLung Obr3 and metM-WntLung Con5 cells to determine if leptin signaling might play
a role in differences between FCM treatments. Percent wound closure was calculated using representative images of the cell walls prior to FCM treatment (Figure 10A) and following 24 hours of FCM treatment (Figure 10B). Upon initial analysis of cell migration in DIO FCM of varying conditions, it was observed that the metM-WntLung ObR3 (Figure 11B) and metM-WntLung
Con5 (Figure 11C) cell lines both had significant increases in wound closure compared to the 2% FBS control. The metM-WntLiver (Figure 11A), however, did not exhibit any significant differences
between the 2% FBS control and the FCM conditions, indicating potential cell line differences. Interestingly, each increase in FCM concentration for the metM-WntLung ObR3 (Figure 11B) and
metM-WntLung Con5 (Figure 11C) cell lines demonstrated a decrease in percent wound closure.
While these decreases were only significant when comparing the 1:20 to 1:5 concentrations, this observed decrease may demonstrate a potential toxicity effect of the FCM at extremely high concentrations.
Figure 10. Cell migration of metM-WntLiver cells prior to wound healing (A) and after 24 hours
of treatment with DIO FCM (B). Percent wound closure was quantified using ImageJ wound-healing software.
Figure 11. Percent wound closure calculated using ImageJ wound-healing software for metM-WntLiver (A), metM-WntLung OBR3 (B), and metM-WntLung CON5 (C) cell lines after 24 hour
treatment with 1:5, 1:10, or 1:20 concentrations of Control FCM. Statistical analysis conducted using a one-way ANOVA with Tukey’s multiple comparison test.
Following the initial analysis using DIO FCM at varied concentrations, additional wound healing assays were conducted using metM-WntLiver, metM-WntLung, and M-Wnt cell lines
cultured in a 1:10 concentration of either Control, DIO, or DIO+Sulindac FCM. Statistical analysis revealed the metM-WntLiver (Figure 12A) and metM-WntLung (Figure 12B) cell lines to have
increased percent wound closure when treated with any of the FCM diet conditions compared to the 2% FBS control. The Control and DIO+Sulindac FCM conditions for the M-Wnt cell line (Figure 12C), on the other hand, did not show increased wound closure compared to the 2% FBS condition. The DIO FCM for the M-Wnt cell line was the only condition that demonstrated an increase in percent wound closure (Figure 12C, p=0.0138).
Despite the variance between cell lines, these wound healing assays are indicative of the
adipose tissue’s potential role in promoting migration of cancer cells. Although there were no
significant differences between the Control, DIO, and DIO+Sulindac FCM conditions, these
2% F BS 1:20 FCM 1:10 FCM 1:5 FCM 0 20 40 60 80 100 Media Concentration P er ce n t C lo su re ( % ) metM-WntLiver a a a a
2% F BS 1:20 FCM 1:10 FCM 1:5 FCM 0 20 40 60 80 100
metM-WntLung OBR3
Media Concentration P er ce n t C lo su re ( %
) b b,c c,d
a
2% F BS 1:20 FCM 1:10 FCM 1:5 FCM 0 20 40 60 80 100
metM-WntLung CON5
Media Concentration P er ce n t C lo su re ( % ) a b b,c c,d
preliminary results establish a prospective foundation for modeling the adipose tissue’s influence
on breast cancer migration and metastasis.
Figure 12. Percent wound closure calculated using ImageJ wound-healing software for metM-WntLiver (A), metM-WntLung (B), and M-Wnt (C) cell lines after 24 hour treatment with Control,
DIO, or DIO+Sulindac FCM. Statistical analysis conducted using a one-way ANOVA with
Tukey’s multiple comparison test.
4. Pro-inflammatory mediators in obesity-associated adipose tissue may be responsible for cancer progression and metastasis
In order to identify potential pro-inflammatory mediators in obesity-associated adipose tissue that may be influencing the previously observed increase in migratory breast cancer phenotypes, we conducted gene expression microarray analysis of lean and obese murine mammary fat pads. Analysis identified several inflammatory factors in the fat pads that have been identified as potential mediators of breast cancer progression and metastasis. Of these identified genes, those that were upregulated in DIO mammary fat pads compared to Control included IL-6, CCL9, CCL8, CCL6, CCL7, and CCL12 (Table 3). These cytokines are known to play a role in inflammatory
2% F BS
Cont rol F
CM
DIO FCM
DIO+ Sul F
CM 0 50 100 150 Media Type P er ce n t C lo su re ( % ) metM-WntLiver a
b b b
2% F BS
Cont rol F
CM
DIO FCM
DIO+ Sul F
CM 0 50 100 150 Media Type P er ce n t C lo su re ( % ) metM-WntLung a
b b b
2% F BS
Cont rol F
CM
DIO FCM
DIO+ Sul F
CM 0 50 100 150 M-Wnt Media Type P er ce n t C lo su re ( % )
a a,b b a,b
growth factor that has been shown to be critical for blood vessel survival (but not growth), was found to be downregulated in DIO compared to Control (Table 3)90–92.
Gene Symbol Fold Change FDR p-value Gene Description
IL-6 6.49 0.0126 A inflammatory and immune-suppressive cytokine involved in both local and systemic inflammatory responses85,87
CCL9 4.19 0.0256 A chemokine involved in inflammatory responses, cell proliferation, and metastasis86,88
CCL8 7.93 0.0256 Monocyte chemoattractant that recruits inflammatory monocytes to target tissues93,94
CCL6 2.73 0.0439 A chemokine involved in chronic inflammatory disorders and macrophage infiltration89,95,96
VEGFb -3.57 0.0622 A mediator of vascular survival and inhibitor of inflammation90,97
CCL7 6.09 0.0846 Monocyte chemoattractant that promotes the recruitment of innate immune cells to sites of inflammation93,98,99
CCL12 3.7 0.0862 A chemokine with roles in embryogenesis and hematopoiesis. Released in the tumor microenvironment to promote invasion, metastasis and epithelial to mesenchymal transition (EMT) 100–102
Table 3. Inflammatory gene expression fold change differences in DIO compared to control mammary fat pads.
To determine which subsets of genes and pathways most significantly contributed to the differences in DIO and Control adipose tissue, we conducted gene set enrichment analysis (GSEA)82,83. Upon first assessing broad hallmark pathways upregulated in DIO compared to
Control mammary fat pads, GSEA revealed four important gene sets: inflammatory responses, epithelial to mesenchymal transition, IL-6/JAK/STAT3 signaling, and TNF-𝛼 signaling via the inflammatory T-cell regulator, NF-𝜅B (Table 4). The enrichment scores and subsequent gene probes for each of these inflammatory pathways were assessed (Figure 13 A,B,C,D). Although pinpointing the significance of any one gene in a signature is difficult, further investigation revealed IL-6 as a leading edge gene, and thus an important driver of the observed phenotype, in all four pathways. CCL7 was also in the leading edge in both the IL-6/JAK/STAT3 and TNF-𝛼
Hallmark Pathways Normalized Enrichment Score (NES)
Inflammatory Response 2.1414
Epithelial to Mesenchymal Transition 2.1123
IL-6, JAK, STAT3 signaling 2.0827
TNF-𝜶 signaling via NF-𝜿B 1.8819
Table 4. Hallmark pathways upregulated in DIO compared to Control mammary fat pads.
Figure 13. Enrichment plots of hallmark inflammatory response (A), Epithelial to Mesenchymal Transition (B), IL-6, JAK, STAT3 signaling (C), and TNF-𝛼 signaling via NF-𝜅B (D) profiles
A B
Following our results indicating important roles for inflammatory signaling in obesity-associated adipose tissue, we decided to further probe gene expression in the C7 immunological gene sets in GSEA. Additional leading edge analysis of these gene sets implicated IL-6 again as a driver gene in 21 of the 182 most significant C7 gene sets (q<0.0001). Of these 21 gene sets, three with the highest enrichment scores are listed in Table 5. These three gene sets included genes upregulated in T-cells when treated with the pro-inflammatory stimulator IL-21, genes up in monocytes stimulated with LPS compared to those treated with an anti-inflammatory drug, and genes upregulated in macrophages activated with IFN-𝛼 compared to untreated macrophages. These GSEA results using the C7 gene sets clearly point to an inflammatory, activated, type I immune program in the obese adipose tissue that is not seen in lean adipose tissue.
Gene Set Gene Set Description Normalized
Enrichment Score (NES) GSE19198_1H_VS_6H_IL21_TREATE
D_TCELL_DN_signal Genes up in T cells when activated with pro-inflammatory IL-21 for 6 hours
vs 1 hour
2.219
GSE9988_ANTI_TREM1_VS_LPS_M ONOCYTE_DN_signal
Genes up in LPS treated monocytes vs treatment with an
anti-inflammatory
1.993
GSE35825_UNTREATED_VS_IFNA_S
TIM_MACROPHAGE_DN_signal Genes up in IFNmacrophages vs untreated 𝛼 stimulated macrophages
1.939
Table 5. Gene sets, descriptions, and normalized enrichment scores (NES) for gene sets similarly altered in DIO fat pads compared to Control fat pads.
IL-12 (Figure 13C), G-CSF (Figure 13D), and MCP-1 (Figure 13E). While all cytokines show clear differences between Control, DIO and DIO+Sulindac conditions, additional biological replicates must be completed before statistical analysis can be completed. The absence of cytokines in the filtered flow-through conditions, however, further illustrates the success of the FCM filtration process.
Figure 14. Leptin (A) and cytokine concentrations of IL-6 (B), IL-12 (C), G-CSF (D), and MCP-1 (E) determined by MAGPIX Luminex.
Unfil tere d Filte red Flow Thr ough Filte red Filtr ate 0 2000 4000 6000 8000 G-CSF C o n ce n tr at io n Unfil tere d Filte red Flow Thr ough Filte red Filtr ate 0 5000 10000 15000 20000 MCP-1 C o n ce n tr at io n
D E
Unfil tere d Filte red Flow Thr ough Filte red Filtr ate 0 500 1000 1500 2000 IL-6 C o n ce n tr at io n Unfil tere d Filte red Flow Thr ough Filte red Filtr ate 0 2000 4000 6000 8000 10000 Leptin C o n ce n tr at io n Unfil tere d Filte red Flow Thr ough Filte red Filtr ate 0 1 2 3 4 IL-12 C o n ce n tr at io n Control DIO DIO+S
Discussion
This study investigated the relationship between obesity-associated adipose tissue inflammation and breast cancer progression. We first assessed this relationship in vivo with lean, obese, and Sulindac-supplemented mice. Our analysis revealed significant differences between the diet conditions, specifically in tumor size and metastatic spread. Obese mice exhibited significantly larger tumors with greater metastatic burden than lean mice, but these effects were counteracted when the obese mice were supplemented with the NSAID Sulindac, as DIO+Sulindac mice developed tumors similar in size to lean mice with fewer metastases than DIO mice. Importantly, supplementation with Sulindac did not decrease the DIO+Sulindac mouse weights or body composition in comparison to the DIO mice, indicating that Sulindac targeted the pro-tumorigenic and inflammatory effects of obesity, not obesity itself. Our work also agrees with previous studies, as Sulindac has been shown to both inhibit 4T1 tumor growth and prolong life expectancy of immune-competent mice103.
To model the obesity-associated adipose secretome in vitro, we generated FCM from the mammary fat pads of mice fed Control, DIO, and DIO+Sulindac diets. Initial MTT cell viability assays revealed a positive growth trend for increasing DIO FCM concentrations in metM-WntLiver,
MDA-MB-231, metM-WntLung ObR3, and metM-WntLung Con5 cell lines when treated for
48-hours. The greatest cell growth was observed in the metM-WntLiver and MDA-MB-231 cell lines
at a 1:20 FCM concentration. These results suggest that treatment with more concentrated FCM may drive greater cell growth. No significant differences between FCM concentrations and the 2% FBS control were noted in the 24-hour treatment, indicating that cells may require prolonged treatment before the effects of FCM can be observed.
differences between the diet conditions. No dose-response effect was observed between the increasing Control FCM concentrations in the metM-WntLung ObR3 and metM-WntLung Con5 cell
lines, but a significant dose-response effect was observed in the metM-WntLiver cell line. On the
other hand, treatment with DIO FCM showed a significant dose-response effect in all three cell lines. Most notably, the 1:10 DIO FCM concentration exhibited the greatest cell viability, again suggesting that treatment with more concentrated FCM increases cell growth. The dose-response effect observed between concentrations in the DIO FCM may suggest an increased concentration of pro-tumorigenic factors in the obese state that may aid in driving tumor growth and progression. Our previous in vivo work illustrated robust differences between mice on Control and DIO diets, therefore leading us to believe that similar trends may be observed in vitro. Despite the greater dose-response effect seen in the DIO MTT assays compared to the Control, there were no observed phenotypic differences between cells treated with control and DIO FCM. One potential factor that may have contributed to these results is the toxicity of excess fatty acids present in the FCM. Numerous studies have implicated fatty acids as promoters of apoptosis, thereby decreasing cell proliferation and survival of many cancer subtypes104,105. Furthermore, fatty acids have even
been shown to directly suppress breast cancer growth by decreasing viability and proliferation105.
Excess fatty acids in the FCM may therefore have impaired cell growth, confounding an accurate comparison of the DIO and Control conditions.
FCM. Interestingly, the only filtered FCM flow-through fraction that differed from the 2% FBS control was DIO. This supports our hypothesis regarding higher fatty acid content in the unfiltered DIO FCM compared to the other diets, as the flow-through fraction in the DIO FCM should have a high concentration of free fatty acids.
Contrary to what was expected following filtration, assessment of the FCM protein filtrate revealed a decrease in cell growth for cells treated with DIO FCM compared to Control. While the excess fatty acids may still have contributed to toxicity in the initial MTT assays, the filtered data suggests that there may have been other factors leading to a lack of congruency between FCM and in vivo data for Control, DIO, and DIO+Sulindac comparisons. One such limitation that may have contributed to these findings stems from the generation of FCM. When generated, each FCM diet condition was normalized to 100mg of fat pad mass rather than the average fat per mouse. As DIO and DIO+Sulindac mammary fat pads had much greater average weight than the mammary fat pads from Control mice, it is expected that they would also experience a greater amount of fat-secreted factors in the adipose tissue secretome. In fact, the fat pads of DIO mice were on average 6.52 times more massive than the Control, and the fat pads of DIO+Sulindac mice were 5.13 times more massive than the Control. Normalizing the FCM to fat pad mass may therefore have contributed to a loss of these factors in the DIO and DIO+Sulindac conditions, as we were effectively treating our cells with 1/5-1/6 of what they would’ve been exposed to in vivo relative to control mice. This may explain the lack of differences seen between the FCM diet conditions and may have limited the ability to model the adipose tissue secretome in vitro.
when in previous MTTs using 1:10 for both DIO and Control FCM, we had noted a significant decrease in viability of cells treated with DIO FCM. Thus, it makes sense that although we did not see significant differences, we were increasing viability of the cells by increasing concentration of the DIO FCM. Additional biological replicates and ongoing studies are underway to further investigate this limitation, specifically with concentrations of DIO and DIO+Sulindac FCM that mimic the respective 6.52- and 5.13-fold changes. By normalizing the FCM to these fold changes, we hope to better model the adipose secretome, and all of its secreted factors, in each diet condition as it would occur in vivo.
Similar effects to those observed with cell proliferation were seen with migration and metastatic potential assessed using wound-healing assays. A significant increase in percent wound closure was noticed for two of the three metastatic breast cancer cell lines when treated with FCM compared to the 2% FBS control, indicating the role of FCM and the adipose tissue secretome on driving cell migration. These results agree with evidence of the obese microenvironment promoting breast cancer migration and metastasis, as seen in our previous in vivo work with Sulindac. Additionally, this observed increase in cell migration may be attributed to the adipose secretome and its secretion of pro-inflammatory cytokines. These findings can be better explained by current literature regarding secretome analysis of breast cancer-associated adipose tissue. Several studies have shown the pro-migratory effect of the adipose-tissue secretome, indicating that the composition of the secretory profile has the ability to promote breast cancer metastasis106,107.