THE GENDER FUNDING GAP WITHIN THE ENTREPRENUERIAL ECOSYSTEM IN THE UNITED STATES: DOES A CORRELATION EXIST AMONG GENDER,
INDUSTRY, AND FUNDING?
Abigail A. Staker
An honors thesis submitted to the faculty of the Kenan-Flagler Business School at the University of
North Carolina at Chapel Hill
Chapel Hill
2020
Approved by ___________________________________
ii
ABSTRACT
Abigail A. Staker
The Gender Funding Gap Within the Entrepreneurial Ecosystem in the United States: Does a Correlation Exist Among Gender, Industry, and Funding?
(Under the Direction of Maryann Feldman)
Recent studies highlight females’ positive impact within the business world and
entrepreneurial ecosystem. Within the entrepreneurial ecosystem, however, females lag behind
their male counterparts in funding accumulation. Previous research identified three primary
causes to this discrepancy: (1) lack of females in the financial capital industry, (2) implicit bias,
and (3) female- versus male-owned company characteristics and owner attitudes. What isn’t
addressed, however, is an analysis of the industries pursued by females versus males. My study
identifies and attempts to understand underlying causes in gender funding differences based on
industry. I use a mixed-method approach of quantitative and qualitative analysis. My findings
suggest (1) industry does not exhibit a significant role in gender funding differences, (2) implicit
bias continues to plague females, and (3) females are underrepresented across all industry lines.
Females receive fewer investment dollars than their male counterparts, appearing to directly
iii
ACKNOWLEDGEMENTS
I would like to recognize several individuals whose support and guidance throughout the senior
honors thesis made this completion possible.
Dr. Maryann Feldman – Thank you for all your help and advice throughout the senior honors
thesis process. I am forever grateful for your willingness to serve as my advisor!
Dr. Patricia Harms – Thank you for the guidance and help you have provided over the past year.
This process would not have been the same without you!
David Fisher – I cannot thank you enough for your assistance on my data analysis. My thesis
would be half of what it is today without your help!
Dr. Melissa Geil and Dr. Wendell Gilland – Thank you serving as committee members for my
honors thesis. Your advice and feedback proved invaluable to the completion of my thesis!
The Kenan Scholars Program and the Kenan Institute – Thank you for pushing me to purse a
senior honors thesis. I am forever grateful for the many opportunities this program has provided
me!
Mom, Dad, and Mimi – Thank you for always being there for me during the ups and downs of
this process. The completion of my thesis would not have been possible without you all by my
iv
TABLE OF CONTENTS
ABSTRACT ... ii
ACKNOWLEDGEMENTS ... iii
LIST OF TABLES ... vii
LIST OF FIGURES ... viii
INTRODUCTION ... 1
LITERATURE REVIEW ... 4
The Gender Funding Gap in the Entrepreneurial Space ... 4
Lack of Female Presence in the Financial Capital Industry ... 5
Implicit Bias in Entrepreneurial Financing ... 6
Female- Versus Male-Owned Company Characteristics and Owner Attitudes ... 8
Conclusion ... 14
METHODOLOGY ... 15
Hypothesis... 15
Quantitative Analysis ... 16
Sample Selection and Criteria ... 16
Data Collection ... 17
v
Data Analytics ... 19
Regression ... 19
Qualitative Analysis ... 19
Limitations ... 21
Quantitative Collection and Analysis: Crunchbase Database ... 21
Qualitative Collection and Analysis: Interview Subjects ... 22
Other ... 22
Conclusion ... 23
RESEARCH FINDINGS ... 24
Quantitative Analysis ... 24
Data Analysis ... 24
Regression Analysis ... 31
Qualitative Analysis ... 32
Investors... 32
Founders ... 34
Investors and Founders ... 35
DISCUSSION ... 37
vi
Conclusion ... 40
Future Research ... 40
APPENDICES ... 42
vii
LIST OF TABLES
Table 1. 1: Data Collection Attributes ... 17
viii
LIST OF FIGURES
Figure 1. 1: Percent of Total Funding Received by Year Founded and Gender (2010 to 2018) .. 25
Figure 1. 2: Average Funding Received by Year Founded and Gender (2010 to 201822) ... 26
Figure 1. 3: Total Funding by Industry and Gender from Founding Years (2010 to 2019) ... 28
Figure 1. 4: Number of Startups Founded Per Industry Sector (2010 to 2019) ... 29
1
INTRODUCTION
Within the workplace and business world, females continue to make advancements both
as leaders in established companies and founders of new ventures. As of 2019, females
accounted for 6.6% of Fortune 500 CEOs in the United States, increasing from 4.8% in 2018
(Connley, 2019). In 2019, venture capital1 (VC) investments in all-female founded startups hit a
record-setting $3.3 billion, representing 2.8% of funds invested across the entire United States
startup ecosystem (Clark, 2019). While popular press considers these statistics encouraging for
females within the business world, are they true triumphs? Currently, among Fortune 500
companies, more CEOs named John exist than all female CEOs combined (Miller, Quealy, &
Sanger-Katz, 2018). All-male founded startups received 88% of venture capital financing in
2019 (Clark, 2019). These percentages speak volumes to the distinct differences between males
and females within the business world.
Further, the gender inequality remains perplexing as recent studies highlight females’
positive impact within the business world and entrepreneurial ecosystem. Research conducted by
Boston Consulting Group and MassChallenge2 found females impacted revenue generated by
startups more positively than males. The study indicated female-led ventures generated 10%
more revenue over a five-year period compared to their male counterparts. However, while
females delivered higher revenues, a gender gap persisted in new-business funding (Abouzahr,
Taplett, Krentz, & Harthorne, 2018).
1 Venture capital is a form of private equity and a type of financing that investors provide to startup companies and
small businesses that are believed to have long-term growth potential. (https://www.investopedia.com/terms/v/venturecapital.asp)
2 MassChallenge strengthens the global innovation ecosystem by accelerating high potential startups across all
2
So, the question becomes, why do these distinct gender differences exist? At first glance,
gender bias appears at play. However, when female entrepreneurs like Elizabeth Holmes succeed
in obtaining significant funding for their business ventures, gender bias appears irrelevant. Thus,
new questions and ideas regarding the entrepreneurial gender funding gap surface. Elizabeth
Holmes, the founder of Theranos, provides the best, although most sensationalized, example to
date of a female’s ability to raise investment capital. Theranos, a blood-testing startup touting
proprietary technology, reached unicorn status with a $9 billion valuation. Ultimately, the
technology and Theranos proved worthless. However, before the exposure of Theranos’
technology as fraudulent, Elizabeth Holmes raised $700 million from outside funding sources
(Hartmans & Leskin, 2020). Obviously, her gender did not deter investors. Her ability to achieve
such noteworthy capital accumulation, with an unproven technology, brings into question current
research explanations for the funding gap, especially in regard to gender bias. Does funding
really hinge on the gender of the founder or does funding occur as a function of industry?
While research to date examines many reasons for the existence of a gender funding gap,
the anomaly witnessed with Elizabeth Holmes’ unprecedented capital accumulation inspired me
to assess the gender funding gap from a different approach. Specifically, my research will
examine the following question:
Does a discrepancy between entrepreneur funding and gender exist within different industry
sectors or does the discrepancy in funding exist as a function of the type of businesses pursued
by females versus males?
3
This research thesis intends to provide additional clarity as to why the gender funding gap
persists in the entrepreneurial ecosystem. The literature review examines the formal research
done to date on the gender funding gap, including (1) the lack of female presence in the financial
capital industry, (2) gender bias, and (3) female- versus male-owned company characteristics and
owner attributes. The research methodology section defines my hypothesis, explains my
quantitative and qualitative data collection, and highlights any limitations to my research
approach. The research analysis and discussion sections provide research findings and
discussions of possible reasons for the gender funding gap based on my results. Lastly, the thesis
provides a conclusion to my study and suggests additional future research which could improve
4
LITERATURE REVIEW
The initial step to my literature review involved reviewing current research to develop the
overarching reasons for the entrepreneurial gender funding gap. From this initial analysis, I
developed generalized categories focused on the possible causes for the gender funding gap. The
primary explanations researched to date fall into three main groups: (1) lack of female presence
in the financial capital industry, (2) implicit bias in entrepreneurial financing, and (3) female-
versus male-owned company characteristics and owner attitudes. Within each category, I
examined research studies which supported these three alternative conclusions. Based upon this
review, I determined further research needs to be conducted on the direct correlations between
gender, industry, and funding amount, specifically with a focus on gender and industry space.
The Gender Funding Gap in the Entrepreneurial Space
A growing body of literature exists that examines discrepancies in funding between
females and males within the entrepreneurial space. Coleman and Robb (2009) used data from
the Kauffman Firm Survey3 to establish an inequality in gender funding. Their results indicated
females start their ventures with significantly lower financial funding than males. Males
incurred twice as much business debt to establish their ventures as compared to females (p. 402).
Further, Coleman and Robb (2009) findings suggested females raise significantly lower amounts
of incremental debt and equity in the first years of startup businesses. These results held true no
matter the type of firm or owner characteristics (p. 403).
3 The Kauffman Firm Survey (KFS) is a panel study of 4,928 businesses founded in 2004 and tracked over their
early years of operation, through 2011. The survey focuses on the nature of new business formation activity; characteristics of the strategy, offerings, and employment patterns of new businesses; the nature of the financial and organizational arrangements of these businesses; and the characteristics of their founders.
5
A more recent study by Poczter and Shapsis (2018) builds on the research of Coleman
and Robb (2009). Using data collected during a televised entrepreneurial pitch competition,
these researchers analyzed funding obtained by entrepreneurs from angel investors. Consistent
with findings from Coleman and Robb (2009), female teams received less capital and provided
more of their own equity relative to their male counterparts (p. 32). Further, the study revealed
females received lower valuations, resulting in smaller investments than male-owned ventures.
Interestingly enough, the study revealed yield rates between males and females did not vary (p.
33).
While a gender funding gap clearly persists, the primary reason for the funding
discrepancy between females and males varies by research. Research to date primarily studies
the following explanations: (1) lack of female presence in the financial capital industry, (2)
implicit bias in entrepreneurial financing, and (3) female- versus male-owned company
characteristics and owner attitudes.
Lack of Female Presence in the Financial Capital Industry
One explanation for the gender funding gap relates to the underrepresentation of females
in the financial capital industry. The authors of the Diana Project4 found between 1953 and 1998,
less than 5% of total venture capital funding went to female-owned firms (Gatewood, Brush,
Carter, Greene, & Hart, 2009). They concluded this low level of funding correlated to the
relatively small number of females employed in the venture capital industry (p. 131). A later
study by Blum (2015) researched why gender disparities exist among directors and partners at
venture capital firms. As of 2015, females comprised approximately 10% of independent venture
4 A multi-university research program aimed at identifying factors that support and enable high growth in female-led
6
capitalists (p. 33). The 2013 Bureau of Labor Statistics5 highlighted from 2001 to 2011, 2.6% of
female workers left the financial industry while males increased by 9.6% during the same
timeframe. Further, the number of females aged 20 to 35 working in finance dropped by 16.5%
while males increased by 7.3% (p. 37). According to Blum (2015), this disparity resulted in part
from limited mentoring opportunities, few female role models, lack of executive management
experience, and female exclusion from primary niche networks (p. 38). Such disparity negatively
affects entrepreneurism and economic activity for females in their quest for capital in a
male-dominated industry (p. 38). With male dominance in the venture capital space, females lack the
networking relationships to connect them with venture capitalists, thereby limiting their
probability of obtaining venture financing.
Implicit Bias in Entrepreneurial Financing
In addition to the lack of female representation in the financial capital industry, gender
bias also affects investors’ financing decisions. Muntean and Özkazanç-Pan (2015) studied the
gender gap in entrepreneurship from a lens of a feminist framework. Liberal feminism assumes
equality for males and females; however, an unspoken bias continues to view males as the norm
in the entrepreneurial space (p. 28). Edelman, Róisín, Tatiana, and Brush (2018) explored the
role of gender bias in the financial decision-making process. They examined the disparity in
funding between male- and female-owned companies using social identity theory6 (p. 135). The
researchers argued in male-dominated angel investment groups, gender stereotypes biased angel
investors’ interpretation of signals sent by entrepreneurs. These signals included male dominance
5 TheBureau of Labor Statistics (BLS) of the U.S. Department of Labor is the principal federal agency responsible
for measuring labor market activity, working conditions, and price changes in the economy. Its mission is to collect, analyze, and disseminate essential economic information to support public and private decision making.
(https://www.bls.gov/bls/infohome.htm)
6 A The study of the interplay between personal and social identities. Social identity theory aims to specify and
7
in business and the perceived difference between entrepreneurship and femininity (p. 141). Their
findings suggested angel investors viewed female-led entrepreneurial ventures as having less
legitimacy, even though no differences in actual legitimacy existed across businesses (p. 136).
The researchers contended within angel groups composed of predominantly males, the
expectation of entrepreneurs as masculine engendered biases against females (p. 140). This
attitude resulted in ventures led by males being more favorably evaluated, thus privileging male
entrepreneurs for funding. This study correlates to the results found by Fiske, Cuddy, Glick, and
Xu (2002), which indicated the United States cultural beliefs system viewed males as being more
competent than females in business transactions and personal interactions (p. 899).
A different study conducted by Kanze, Huang, Conley, and Higgins (2018) pairs well
with this observation. Kanze et al. (2018) proposed the funding gap originates with a gender bias,
as evidenced by the questions posed by investors to entrepreneurs during funding rounds. They
used data collected from question-and-answer sessions at the TechCrunch Disrupt New York
City7 in 2010 and 2016 (p. 587). In analyzing the question-and-answer sessions between
entrepreneurs and venture capitalists, the researchers found the gender funding gap not likely to
narrow with more females entering into venture capital. Both female and male venture capitalists
demonstrated the same biases, especially in regard to the type of questions asked to each gender
during funding sessions (p. 598). The questions posed to females highlighted prevention,8
7 TechCrunch Disrupt is the world’s leading authority in debuting revolutionary startups, introducing
game-changing technologies and discussing what’s top of mind for the tech industry’s key innovators. Disrupt gathers the best and brightest entrepreneurs, investors, hackers, and tech fans for on-stage interviews, the Startup Battlefield competition, a 24-hour Hackathon, Startup Alley, Hardware Alley, and After Parties.
(https://www.techstars.com/event/techcrunch-disrupt-new-york-city/)
8 Prevention focused questions emphasize maintaining non-losses and not losing capital (e.g. What does customer
8
whereas the questions asked to males focused on promotion9 (p. 588). A review of these sessions
revealed discrepancies in questions asked to different genders, highlighting the effect of bias on
financing decisions. Promotion focused questions directly correlated with greater funding
amounts (p. 599).
Brush, Greene, Balachandra, and Davis (2018) substantiated the findings of Kanze et al.
(2018) by examining recent developments in capital accumulation within the venture capital
space. In an effort to update the initial Diana Project2 study, the researchers analyzed funding in
the venture capital space by industry, stage of investment, physical location, and performance
outcomes (p. 118). Brush et al. (2018) concluded females made progress in obtaining funding;
however, “there is still a significant funding gap in that all-male teams are four times more likely
to receive funding from venture capital investors than companies with even one female on the
team” (p. 132). Further, the researchers suggested this result may occur due to gender homophily
theory.10 Based on this theory, Brush et al. (2018) concluded in the venture capital space, with
trust being the central component in financing relationships, the male-dominated venture capital
industry prefers investing in relationships with male CEOs or all-male teams as compared to
female CEOs and teams: a direct reflection of gender bias in funding decisions (p. 131).
Female- Versus Male-Owned Company Characteristics and Owner Attitudes
Females also appear to exhibit different owner attitudes and business characteristics than
their male counterparts, which in turn affects financing decisions. The majority of research to
date focuses on the gender funding gap in the early-stage obtainment of capital. Becker-Blease
9 Promotion focused questions emphasize attaining growth-oriented gains that are facilitated by capital (e.g. How do
you intend to acquire customers? What does your revenue forecast look like?) (Kanze, Huang, Conley, & Higgins, 2018)
10 Gender homophily theory suggests that people have a tendency to associate with people who are demographically
9
and Sohl (2007) observed females sought angel financing at a rate much lower than their male
counterparts, even though the females’ chance in obtaining financing from angel investors
equaled males (p. 517). The researchers surveyed angel investor portals and found 9% of
proposals originated from female entrepreneurs, the remaining 91% male. These findings
indicated female entrepreneurs lack confidence when seeking external funding (p. 517). Cole and
Mehran (2009) analyzed data from the 2003 Survey of Business Finances (SSBF)11 and
discerned the same finding as Becker-Blease and Sohl (2007). While the probability of a female
and male receiving a loan equated, females applied for significantly lower amounts of debt
compared to males (Cole and Mehran, 2009).
This trend continued into later stage funding. In 2005 and 2006, females raised roughly
half the amount of incremental financing than their male counterparts (Coleman and Robb,
2009). Further, Gatewood et al. (2009) examined male and female entrepreneurs’ networks and
how these networks correlated to financing. Consistent with Coleman and Robb (2009), they
determined females received early-stage funding. However, either for lack of aggressively
growing their business or because they dropped out of their business early, later rounds of
funding for female entrepreneurs consistently underperformed in comparison to males (p. 134).
The discrepancy in external funding requests directly correlates to the gender funding gap.
So, why do females consistently underperform males in requesting debt when results in
obtaining financing prove equal? Research confirmed females shy away from external sources
of financing to avoid giving up control and taking on greater risk (Constantinidis, Cornet, &
Asandei, 2006). After conducting interviews with entrepreneurs, Constantinidis et at. (2006)
11 The Survey of Small Business Finances (SSBF) collects information on small businesses (fewer than 500
employees) in the United States. Owner characteristics, firm size, use of financial services, and the income and balance sheets of the firm are just some examples of the types of information collected.
10
also concluded females choose to pursue businesses in industries that do not rely heavily on
external funding sources to maintain business viability (p. 135). Further, Brush, Edelman,
Manolova, and Welter (2018) conducted research on the importance of gender in ecosystems at
the institutional, organizational, and individual levels. This study found females tend to align
themselves with female only networks, thereby, restricting access to economic and social capital
and limiting their credibility as a field player in the entrepreneurial space (p. 402).
In addition to requesting smaller investment amounts at initial and later stage funding
rounds, females also prefer to use different forms of capital accumulation than males. In
analyzing the Kauffman Firm Survey1, Coleman and Robb (2009) observed females preferred
and relied more heavily on obtaining capital through internal rather than external sources to
finance their ventures (p. 400). Personal debt for female entrepreneurs included personal credit
card balances, personal bank loans, business credit card balances in the owner’s name, and
family loans. Only a small percentage of females used outside equity investors or venture capital
financing, 1.5% and 0.2%, respectively (p. 401). Sullivan and Meek (2012) also noted female
engagement in financing networking focused on family and friends (p. 428). A later study by
Kanze et al. (2018) observed the continued trend of females using personal financing rather than
external sources to fund their ventures. The researchers corelated the attraction to personal rather
than external financing with the “lifestyle” and “female friendly” industries pursed by females,
driven by a perceived need to balance work and life (p. 590).
Coleman and Robb (2009) analyze the growth in female-owned firms in the early 2000s
11
United States Census Bureau12 from 1997 to 2002, female-owned firms increased by 19.8%
compared to the growth rate of 10.3% for United States firms overall. However, during this same
timeframe, the revenues, business growth, and payroll of these female-owned firms grew at a
lagging pace compared to overall United States firms. Revenues, business growth, and payroll
grew at 15%, 1%, and 17%, respectively, compared to overall firm growth of 22%, 7.2%, and
30% (p. 398).
These United States Census Bureau10 statistics indicated while the number of
female-owned firms grew faster than those female-owned by males, their relative importance in the marketplace
did not follow the same trend (p. 397). Between 2007 and 2016, the number of United States
female-owned companies continued to trend upward, increasing by 45%: a rate five times faster
than the national average for all businesses (Edelman et al., 2018). However, again, despite the
continued growth of female-owned ventures, the researchers found female entrepreneurs
continued to face challenges in obtaining financial capital and growing at the same rate as their
male counterparts (p. 135).
A key reason male- and female-owned businesses grow at differing rates and receive
different funding amounts links to the different motivations and anticipated rewards of business
ownership, a trend which remains constant over the past decade. Firm growth and profits
motivated males while females sought personal fulfillment, flexibility, and a sense of control
(Morris, Miyasaki, Watters, & Coombes, 2006). Further, the desire for control and risk aversion
led females to keep their businesses small and manageable (p. 236). A more recent evaluation
performed by Sullivan and Meek (2012), related to females and entrepreneurship, also concluded
12 The Census Bureau is the federal government’s largest statistical agency. They are dedicated to providing current
12
differences in motivation, opportunity recognition, acquisition of resources, and entrepreneurial
performance/ business success existed between females and males (p. 453). The authors noted
females pursue different industry lines compared to males (p. 447). Swartz and Amatucci (2018)
also found female confidence to be a cause. The authors concluded females give up greater
ownership percentage when negotiating funding than their male counterparts (p. 13). Further,
Ladge, Eddelston and Sugiyama (2019) focused on female entrepreneurs’ imposter fears13 and its
effect on female entrepreneurial identity. The researchers concluded these fears directly correlate
to the success and growth of female ventures, resulting in a gender performance gap which
directly relates to the gender funding gap (p. 619). Consistent with Ladge et al. (2019), Simmons,
Wiklund, Levie, Bradley and Sunny (2019) further assessed the cultural attributes of
entrepreneurship ecosystems by evaluating how public stigma and personal fear of business
failure affects the likelihood of reentry into the entrepreneurial space by males and females. The
authors found public stigma of business failure deterred females from trying again to a larger
degree than males. Conversely, males feared personal failure more than females (p. 10).
Differing industry focuses by males and females further explains the gender funding
discrepancy. Coleman and Robb (2009) highlighted female-owned firms tend to concentrate in
the service and retail sectors: industries which are highly competitive and lack opportunities for
growth and profitability. As of 2006, 69% of female-owned firms resided in the service sector
and 14.4% in the retail industry space (p. 398). Only a small percentage of female-owned firms
existed in rapid growth or high technology lines of business (Morris et al., 2006). Further,
Manolova, Brush, Edelman, and Shaver (2012) researched the different expectations and growth
13 Imposter Syndrome is the overwhelming feeling that you don’t deserve your success. It convinces you that you’re
13
intentions of United States female and male entrepreneurs. These findings indicated females start
more businesses to achieve a work-family balance, which usually relates to slower growth
industries (p. 8). According to the study, male entrepreneurs’ motivations focused on financial
success much more than female objectives in entrepreneurship (p. 18). Manolova et al. (2012)
research correlates with a study by Neumeyer, Santos, Caetano, and Kalbfleisch (2018) who
investigated the effects of business typology, race, ethnicity, and past business experience on the
social capital distribution of female entrepreneurs in entrepreneurial ecosystems (p. 475).
Through studying two social network data from municipal ecosystems in Florida, USA
(Gainesville and Jacksonville), the researchers determined network connectivity and the
distribution of social capital significantly differ for male and female entrepreneurs (p. 476). This
difference proved contingent on the business type. Male entrepreneurs highlighted higher social
capital in aggressive- and managed-growth business networks, while female entrepreneurs
exhibited higher social capital scores in lifestyle and survival business networks (p. 482).
Guzman and Kacperczyk (2019) examined the gender gap in entrepreneurship funding
with a geographical focus of businesses located in California and Massachusetts between 1995
and 2011. The researchers used administrative business registration records to document six
different startup attributes at founding (p. 1670). Guzman and Kacperczyk (2019) then used
predictive analytics to summarize growth orientation of the different businesses. The results
highlighted female-led ventures lagged by sixty-three percentage points behind male-led
ventures in obtaining external funding (p. 1772). However, they attributed the most significant
factor to the gender funding discrepancy related to initial startup orientation. The researchers
found females start ventures with lower growth potential which does not appeal to investors.
Specifically, females do not start companies with “differentiated technology” – an innovative
14
females start firms associated with local business activities. However, when fe and
male-led ventures focus on high growth, females and males achieved equal exit outcomes through
IPOs or high-value acquisitions (p. 1671).
Conclusion
A review of the literature documents a funding gap between male and female
entrepreneurs and provides much insight into why such gaps exist. Reasons for the funding gap
include the lack of female angel investors and venture capitalists, implicit bias, and business
characteristics and owner attitudes exhibited by female and male entrepreneurs. While some of
the research touched upon the different industries male and female entrepreneurs pursue, a
deeper dive with more current data could provide further explanation and narrow the causation of
the gender funding discrepancy. Based upon this review, I determined further research needs to
be conducted on the direct correlations between gender, industry, and funding amount,
specifically with a focus on gender and industry space. Therefore, my research will focus on the
following question: Does a discrepancy between entrepreneur funding and gender exist within
different industry sectors or does the discrepancy in funding exist as a function of the type of
15
METHODOLOGY
Hypothesis
In response to my research question and review of studies related to the gender funding
gap, I formulated the following hypothesis which I intend to prove or disprove through my
research:
The gender funding gap more closely aligns with the type of industry and business growth
pursued by females versus males with females pursing lower growth business industries.
However, the continued lack of female investors (i.e. venture capitalists and angel investors)
hinders female entrepreneurs’ abilities to obtain outside funding, consistent with gender bias.
*****
In this section of the thesis, I explain the methodology used to address my research
question and prove or disprove my hypothesis. I proposed a mixed-method study, including both
quantitative and qualitative data collection. The goal of this approach to my research focused on
(1) analyzing and determining the funding provided to startup businesses within certain
industries and (2) determining any correlation between the amount of funding and the gender of
the founder within these industries.
I conducted my quantitative analysis as follows: I collected a data sample of startups
based on specific company characteristics using the financial website Crunchbase14. From this
database sample, I performed data analytics to develop and analyze patterns within the
entrepreneurial ecosystem by gender and industry. I also used the sample database to run a
14 Crunchbase is the leading platform for professionals to discover innovative companies, connect with the people
16
regression analysis based on pre-determined independent and dependent variables. The
regression analysis intended to determine if a correlation exists among gender of founder,
industry, and funding amount.
My qualitative data collection consisted of one-on-one interviews with individuals in the
entrepreneurial ecosystem, including angel investors, venture capitalists, and startup founders
based upon an established set of questions.
Quantitative Analysis
Sample Selection and Criteria
To select the sample of startup companies, I used Crunchbase, an online database
consisting of information on innovative ventures. While other databases exist, Crunchbase
proved to be the most user-friendly with the capability to download datasets into Excel. Further,
as an undergraduate Kenan-Flagler business student, Crunchbase was the only accessible
financial database for use in my research study. Crunchbase data includes information about
funding amounts, founding members, year founded, and specific company characteristics,
including industry identification and location. Crunchbase sources its data in four ways: venture
capitalists, machine learning, an in-house data team, and the Crunchbase community. Any
individual can submit information to the Crunchbase database; however, a moderator reviews
these submissions before being accepted for publication (About Crunchbase, n.d.). In order to
validate Crunchbase as a reliable database, I cross-checked a random sample of the data with
Pitchbook, a well-known, highly-respected private capital markets database. The datasets
selected from Crunchbase matched Pitchbook, with a few exceptions. Overall, the Crunchbase
data proved reliable.
In order to appropriately collect the dataset, I established certain criteria. These criteria
17
Founding Dates: The dataset consisted of companies founded between January 1, 2010
and December 31, 2019. This time frame provides history and current relevance for data
analysis.
Geographic Landscape: The geographic landscape focused on startups headquartered in
the United States, exclusively. I selected this landscape in order to better understand the
entrepreneurial ecosystem in the United States.
Data Collection
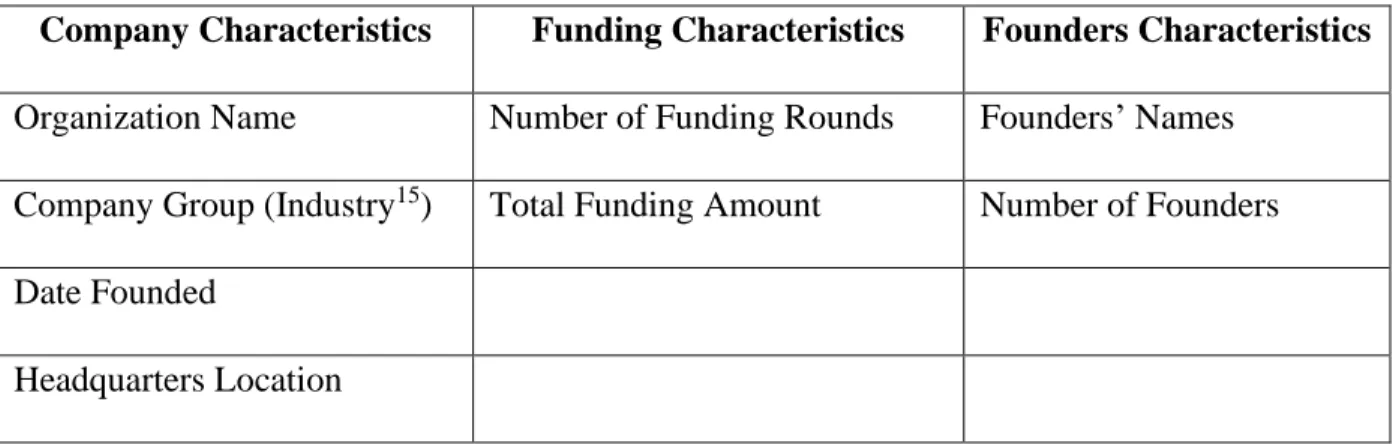
Based on the above variables, the full dataset included the information shown in Table
1.1 for each company:
Table 1. 1: Data Collection Attributes
Company Characteristics Funding Characteristics Founders Characteristics
Organization Name Number of Funding Rounds Founders’ Names
Company Group (Industry15) Total Funding Amount Number of Founders
Date Founded
Headquarters Location
I selected these attributes because they most closely aligned with my research focus.
15 Crunchbase categorizes businesses based on groups, which equate to industry. Within the dataset, forty-one
18
Data Breakdown
In reviewing the initial dataset, I eliminated all companies missing information related to
founders’ names and total funding amount: two variables necessary to complete data analysis.
The next aspect of the dataset breakdown involved identifying the gender of the founders.
Breaking down the dataset by gender proved crucial to identification and analysis of gender
funding trends. To classify gender, I employed a version of Guzman and Kacperczyk’s (2019)
research method. Consistent with their research, I used the Social Security Administration16
(SSA) list of names registered from 1880 to 2019. Through the use of Python,17 an algorithm
correlated each name within the SSA list to the number of times that name was recorded as a
specific gender (See Appendix A). If a name from the SSA list associated with one gender more
than 80%, the name identified with that gender. For a name falling below 80% correlation with
one gender but above 20% with the other gender, the name identified as ‘unknown’ gender.
After identifying the gender of the names on the SSA list, a new Python algorithm
correlated the gender identification from the SSA list with the first name of the founders within
my dataset (See Appendix A). With gender identified, I then classified each company as all-male
founded, all-female founded, or mixed gender founded. Following this procedure allowed for
identification of 96% of companies within the dataset as all-male, all-female, or mixed gender
founded ventures. I eliminated companies for my dataset with no gender identification. Funding
associated with the excluded group accounted for less than 1% of total funding for the dataset.
16The Social Security Administration (SSA) is a U.S. government agency that administers social programs covering disability, retirement, and survivors' benefits. (https://www.investopedia.com/terms/s/ssa.asp)
17 Python is a high-level programming language designed to be easy to read and simple to implement. Python is
19
Data Analytics
With a complete and consistent sample database, I performed quantitative analysis,
including a breakdown of data by founding group, industry, number of ventures started by year,
and funding amounts, to understand the dynamics occurring within each industry sector. With
this analysis, I also compared the founding groups to each other based upon number of all-male,
all-female, and mixed gender founded ventures with a focus on capital accumulation across the
top industries for each gender group. By focusing my dataset on these characteristics, I analyzed
87% of total investment funding from 2010 to 2019.
Regression
To further understand and thoroughly analyze the relationship between funding, industry,
and gender in the entrepreneurial space, I performed a multi-variable regression analysis using
my sample dataset. The dependent variable in the regression equaled the total funding received
by a startup. Gender of founder and industry group comprised the independent variables. The
regression model examined the relationship between gender of founder, industry, and funding
amount to determine relational patterns that potentially predict entrepreneurial funding decisions.
Qualitative Analysis
In addition to the quantitative analysis, I conducted one-on-one semi-structured
interviews of investors, including venture capitalists and angel investors, as well as
entrepreneurs. To identify research participants, I used chain referral sampling18. Further, I
attended the 2020 Frontiers of Entrepreneurship Conference19 in Palm Beach, Florida. During the
18 Chain referral sampling is a non-probability sampling technique that is used by researchers to identify potential
subjects in studies where subjects are hard to locate. (https://explorable.com/snowball-sampling)
19 The Frontiers of Entrepreneurship Conference is focused on exploring emerging issues to advance a new era of
entrepreneurship: thought leaders from academics, industry and government debate the most challenging current issues in the field of entrepreneurship and set the agenda for future research and policy.
20
conference, I connected with leaders throughout the country in the venture capital, angel
investing, and entrepreneurial space and conducted interviews. Lastly, I interviewed members of
an investment team at a local venture capital firm. Through these various networking
opportunities, I built a solid, well-rounded population of research participants to sample.
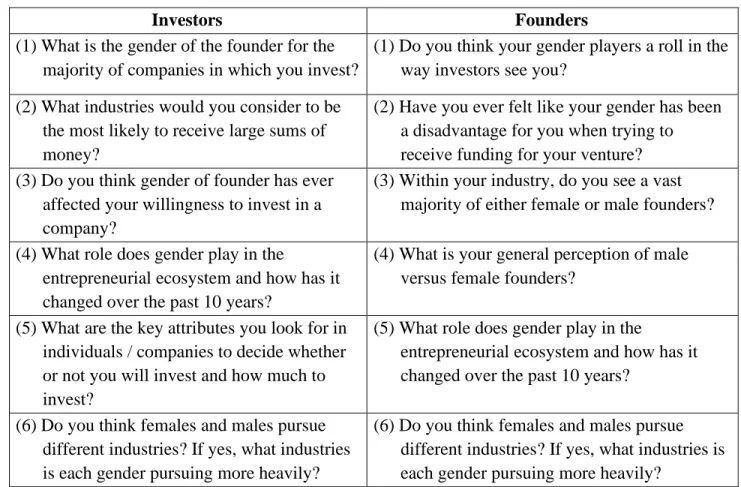
Table 1.2 lists the questions that I asked investors and startup founders:
Table 1. 2: Investors / Founders Questionnaire
Investors Founders
(1) What is the gender of the founder for the majority of companies in which you invest?
(1) Do you think your gender players a roll in the way investors see you?
(2) What industries would you consider to be the most likely to receive large sums of money?
(2) Have you ever felt like your gender has been a disadvantage for you when trying to receive funding for your venture? (3) Do you think gender of founder has ever
affected your willingness to invest in a company?
(3) Within your industry, do you see a vast majority of either female or male founders?
(4) What role does gender play in the
entrepreneurial ecosystem and how has it changed over the past 10 years?
(4) What is your general perception of male versus female founders?
(5) What are the key attributes you look for in individuals / companies to decide whether or not you will invest and how much to invest?
(5) What role does gender play in the
entrepreneurial ecosystem and how has it changed over the past 10 years?
(6) Do you think females and males pursue different industries? If yes, what industries is each gender pursuing more heavily?
(6) Do you think females and males pursue different industries? If yes, what industries is each gender pursuing more heavily?
These questions were specifically developed based upon the research topic and approved
by IRB20 (See Appendix B).
20 Federal regulations require that research projects involving human subjects be reviewed by an IRB. The IRB must
approve or determine the project to be exempt prior to the start of any research activities. The IRB cannot provide approval or determinations for research that has already been concluded.
21
Limitations
The process of collecting and analyzing data for my question presented limitations to my
research as follows:
Quantitative Collection and Analysis: Crunchbase Database
Through using Crunchbase to create my dataset, a number of restrictions existed. As a
relatively new database, created in 2007, Crunchbase’s dataset for the early years of my research,
which starts with 2010, may not be fully inclusive of businesses started during the early time
period of my research. In addition, the data available for 2019 does not appear to be fully
inclusive of all activity occurring in 2019. The numbers demonstrate funding for 2019 equating
to less than 1% of total funding within my sample dataset. Given current published information,
the 2019 funding amount in my dataset does not appear reasonable.
Further, Crunchbase provided limitations to my data based on available information for
each company. The composition and data of companies on Crunchbase evolve from one of four
data sources. While considered reliable by academia, these sources may be limited in scope. For
example, a number of startup companies located in the geographical regions and industries of my
research may not be on Crunchbase.
Additionally, Crunchbase does not allow for mass data accumulation. Therefore, I
performed extensive data collection through hand-pulling the information from Crunchbase
which approximated over one hundred Excel workbooks. These Excel workbooks then needed to
be merged into one Excel worksheet to create a usable database. This combination created an
output of approximately 99,000 companies. I then analyzed the 99,000 companies, realizing
limitations associated with the data available in Crunchbase. For many companies, founders’
names or total funding amount could not be discerned. Therefore, I eliminated these companies
22
which gender could not be identified for at least one founder, eliminating an additional 1,000
companies. I attempted to individually identify gender for common bisexual names, such as
Taylor; however, the presentation of the data did not allow for this analysis. Through removing
these companies, I chose to narrow the scope of my research, resulting in a sample dataset of
approximately 23,000 companies. This narrowed scope may not allow for complete, unbiased
analysis.
Qualitative Collection and Analysis: Interview Subjects
With regard to qualitative data collection, limitations exist by the nature of the interview
process which cannot ensure unbiased answers. The composition of my interview subjects
originated from successful entrepreneurial and investor ventures. Therefore, the predisposition of
the interviewees focused on high-growth startup ventures rather than lower-growth companies
founded by entrepreneurs seeking a work-life balance. By not having respondents that
understand this aspect of the entrepreneurial ecosystem, the overall analysis as to why the gender
funding gap exists could be skewed. Since Crunchbase appears to focus on companies with
high-growth potential, the interviews will provide support to the quantitative analysis and findings.
Other
Limitations also exist outside of the quantitative and qualitative data collection and
analysis. A further limitation involves the individuals who try to start a company, but never get
their businesses off the ground. A pool of companies exists who likely apply for funding, but
never receive investments and end their business ventures. Since I am unable to obtain company
applications for investments, an unaccounted group of individuals may be missing from my
analysis, potentially skewing the data centered around the types of businesses pursued by
23
Conclusion
The combination of the mixed-method approach provides the necessary information
needed to prove or disprove my hypothesis and identify underlying causes in gender funding
differences. Further, the research methodology helps detect whether other factors, such as
24
RESEARCH FINDINGS
In this section, I provide high-level analysis of both my quantitative and qualitative
findings in order to test my hypothesis. This analysis explores the gender funding gap within the
scope of my observations.
Quantitative Analysis Data Analysis
From my dataset sample, which includes the period January 1, 2010 to December 31,
2019, I confirmed the continued existence of a gender funding discrepancy. While not inclusive
of every investment in the entrepreneurial ecosystem during this period, Figure 1.1 depicts males
outpace females as a percentage of total funding amount received by year founded21. This
finding is consistent with current published information. However, some interesting trends
emerged from my analysis of the sample dataset comprising Figure 1.1. The decrease in
percentage funding to all-male ventures from 89% in 2015 to 75% in 2016 indicates an increase
in percent of total funding invested in female and mixed gender founded ventures. While
all-female teams’ percent of total funding received only increased 1% from 2015 to 2016, mixed
gender ventures equated to 20% of all invested capital in companies founded in 2016, increasing
from 8% in 2015. These findings indicate a trend towards improvement in the capital
accumulation space for mixed gender ventures. Mixed gender ventures founded in 2018 equate
to 23% of total funding, while all-male founded teams accumulated 70% of total funding.
Interestingly, while not significant growth, all-female entrepreneurial ventures founded in 2018
received 6% of total funding, increasing from 4% in 2010. From 2015 to 2018, the trends
towards increased capital investment in mixed gender and all-female teams continues, indicating
25
an upward trend, not a one-time anomaly. The increase in mixed gender founded ventures as a
percentage of capital accumulation highlights the increasing role of females in the
entrepreneurial ecosystem.
Figure 1. 1: Percent of Total Funding Received by Year Founded and Gender (2010 to 201822)
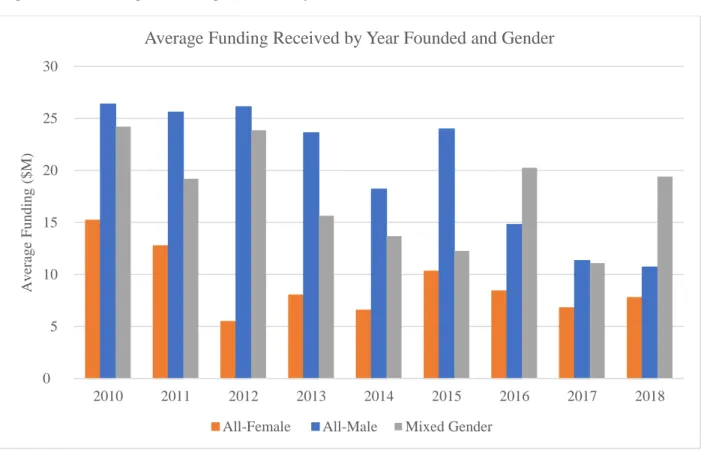
To further supplement the findings provided by Figure 1.1, Figure 1.2 examines the
average funding ( 𝑇𝑜𝑡𝑎𝑙 𝐹𝑢𝑛𝑑𝑖𝑛𝑔 𝑅𝑒𝑐𝑖𝑒𝑣𝑒𝑑 𝑏𝑦 𝑌𝑒𝑎𝑟 𝐹𝑜𝑢𝑛𝑑𝑒𝑑
𝑇𝑜𝑡𝑎𝑙 𝑁𝑢𝑚𝑏𝑒𝑟 𝑜𝑓 𝑉𝑒𝑛𝑡𝑢𝑟𝑒𝑠 𝑏𝑦 𝑌𝑒𝑎𝑟 𝐹𝑜𝑢𝑛𝑑𝑒𝑑) by gender within my sample dataset.
Consistent with Figure 1.1, the graph indicates a decreasing trend for all-male founded ventures
starting in 2016, as related to average funding received. However, when examining the average
funding, Figure 1.2 does not highlight a significant gender funding disparity when accounting for
the number of ventures founded relative to the amount of funding received. In fact, in 2016 and
2018, mixed gender founded ventures outpaced all-male teams by $5 million and $9 million,
22 Given incomplete Crunchbase data for 2019, the graph does not reflect this year. 0% 10% 20% 30% 40% 50% 60% 70% 80% 90% 100%
2010 2011 2012 2013 2014 2015 2016 2017 2018
T o tal Fu n d in g R ec iev ed ( %)
Percent of Total Funding Received by Year Founded and Gender
26
respectively. Females continue to struggle; however, the disparity does not appear as significant
when considering the number of companies founded by all-female teams, which is significantly
smaller than all-male teams. For example, in 2018, all-female founded ventures lagged behind
their all-male counterparts by only an average of $3 million when considering the number of
ventures started. While average funding in 2010 displays the largest average funding over the
sample dataset time period for female teams, the discrepancy in average funding between
all-female and all-male founded ventures approximated $11 million. Thus, the results of 2018
highlight a closing gap between average funding of all-male and all-female teams. The
significant improvement related to mixed gender teams’ average funding further highlights the
narrowing of the gender funding gap.
Figure 1. 2: Average Funding Received by Year Founded and Gender (2010 to 201822)
0 5 10 15 20 25 30
2010 2011 2012 2013 2014 2015 2016 2017 2018
A v er ag e Fu n d in g ( $ M)
Average Funding Received by Year Founded and Gender
27
In addition to the overall analysis completed regarding gender and funding by year
founded, I dissected my sample dataset further by examining funding by industry groups and
gender. Within my sample dataset, forty-one different industry groups existed. Consistent with
Figure 1.1, the dollar amounts invested in all-male ventures far exceeded the capital
accumulation for all-female and mixed gender ventures in all forty-one industry groups.
However, many of these industries comprised a small percentage of overall funding. Therefore, I
analyzed the top-ten funded industries for each gender classification. This breakdown ultimately
resulted in fifteen industry segments, comprising 87% of total funding from 2010 to 2019. Figure
1.3 highlights biotechnology startups received the largest funding for each gender. All-male,
all-female, and mixed gender founded ventures received $47 billion, $3 billion, and $9 billion,
respectively. Commerce and shopping also dominated the funding accumulation, placing in the
top three for each gender category with all-male, all-female, and mixed gender teams receiving
$42 billion, $1.3 billion, and $6.2 billion, respectively. In evaluating the top three industries by
gender, clothing and apparel ranked second in funding for all-female teams, receiving $2.3
billion in funding. Interestingly enough, while all-male teams received $4.9 billion in
investments for clothing and apparel, this industry category ranked nineteenth in overall funding
received by males. Figure 1.3 also indicates the lack of dominance of the clothing and apparel
sector in capital accumulation, but yet this sector places second for industry funding in all-female
teams. Another curious finding relates to technology businesses outside of biotechnology,
especially artificial intelligence (AI) and apps. For each gender category, AI and apps ranked in
the top five for all-male and all-female founded teams for capital accumulation and top seven for
mixed gender teams, indicating a strong presence of females in the technology sector outside of
biotechnology. Financial services also topped the list for funding in all gender categories. A
28
(fintech), banking, and blockchain comprise the majority of this classification. Once again, this
finding indicates females occupy and receive funding in similar industry categories to all-male
teams; however, a significant gender funding gap persists.
Figure 1. 3: Total Funding by Industry and Gender from Founding Years (2010 to 2019)
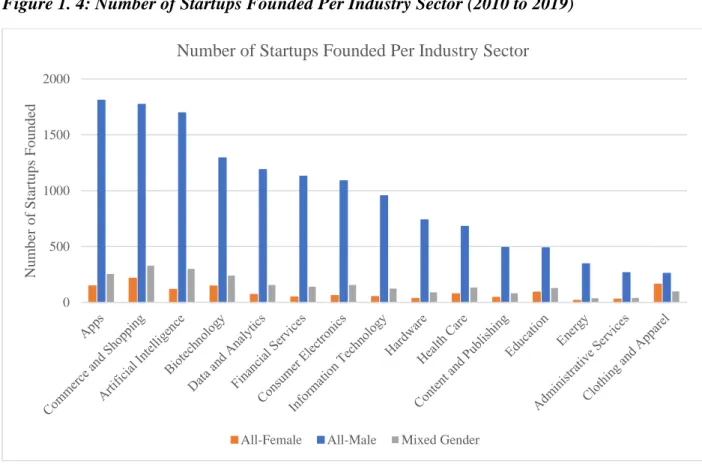
To fully understand the discrepancy between male and female entrepreneurs, Figure 1.4
examines the number of entrants by gender classification within each industry space receiving
the highest capital investments. Consistent with the findings from Figure 1.3, which indicates
funding amounts received by all-male teams dominate across industry space, Figure 1.4
highlights the number of startups founded by all-male teams far exceed the other gender
classifications in all sectors. The discrepancies in funding directly correlate to the disparity in the
number of startups by gender within industry category. 0 10,000 20,000 30,000 40,000 50,000 Fu n d in g A m o u n t (in $ M)
Total Funding by Industry and Gender from Founding Years 2010 to 2019
29
Figure 1. 4: Number of Startups Founded Per Industry Sector (2010 to 2019)
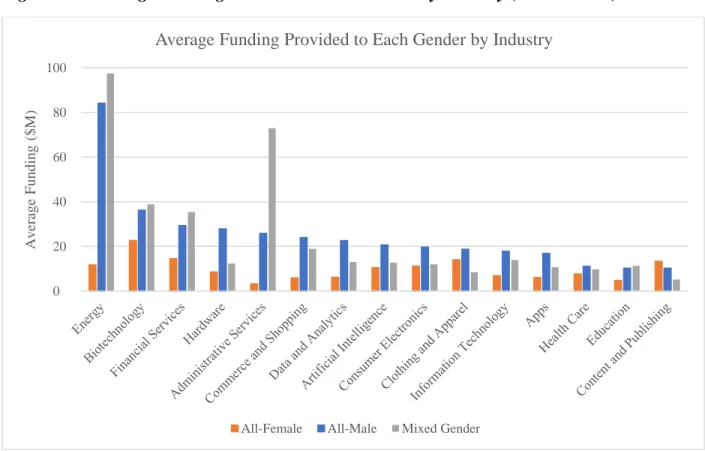
To further the understanding of the gender funding gap, I analyzed the average funding
( 𝑇𝑜𝑡𝑎𝑙 𝐹𝑢𝑛𝑑𝑖𝑛𝑔 𝑅𝑒𝑐𝑖𝑒𝑣𝑒𝑑 𝑏𝑦 𝐼𝑛𝑑𝑢𝑠𝑡𝑟𝑦
𝑇𝑜𝑡𝑎𝑙 𝑁𝑢𝑚𝑏𝑒𝑟 𝑜𝑓 𝑉𝑒𝑛𝑡𝑢𝑟𝑒𝑠 𝑏𝑦 𝐼𝑛𝑑𝑢𝑠𝑡𝑟𝑦) provided to each gender by industry between 2010 and 2019.
As with average overall funding by year (Figure 1.2), different trends emerge when considering
the average funding provided to each gender by industry. Consistent with Figure 1.2, Figure 1.5
indicates average funding provided to each gender classification appears significantly different
when assessing average funding provided to each industry. The energy sector immediately stands
out in this analysis. In reviewing Figure 1.3, the overall funding provided to all-male teams in the
energy space approximated $29 billion, with mixed gender teams receiving approximately $4
billion. However, with 334 all-male startup ventures in this industry space and only 37 mixed
gender teams, the average investment provided to mixed gender teams surpassed all-male teams
by $13 million. While not as large, this trend also exists in biotechnology, financial services,
administrative services, and education. Further, while all-female teams lagged behind their 0 500 1000 1500 2000 Nu m b er o f Star tu p s Fo u n d ed
Number of Startups Founded Per Industry Sector
30
counterparts in average funding, all-female founded ventures exceeded all-male and mixed
gender teams in the content and publishing sector. With the exception of energy and
administrative services, which reflect average funding between $60-100 million and demonstrate
a large gap for female ventures and their counterparts, the average funding provided to
all-female teams does not appear as ominous as the discrepancies reflected in Figure 1.3. For
example, all-female startups in the biotechnology sector receive on average $22.7 million or
23%, whereas all-male teams receive $36.2 million or 37%. In comparison, when evaluating
total actual funding amount by industry (Figure 1.3), all-male startups received 80% of funding
as compared to all-females teams which received 6%. The smaller discrepancy related to average
funding by gender classifications within industry as compared to actual investment dollars seems
to indicate a narrower gender funding gap.
Figure 1. 5: Average Funding Provided to Each Gender by Industry (2010 to 2019)
0 20 40 60 80 100 A v er ag e Fu n d in g ( $ M)
Average Funding Provided to Each Gender by Industry
31
Regression Analysis
In order to determine whether or not a predictive relationship exists among industry,
gender, and funding amount, I ran a multi-variable regression in which industry and gender acted
as independent variables to determine potential investment amounts. Due to regression
limitations, I selected eleven industries to analyze. These eleven industries comprised 80% of
total capital accumulation in my sample dataset between the years 2010 and 2019. In order to
analyze the effect of all-female and mixed gender teams by industry on investment amounts, I
calculated an intercept which represented an all-male founded team in industries not included
within the independent variables. Based upon this regression (See Appendix C), all-male teams
will consistently outperform all-female and mixed gender ventures in capital accumulation. The
predicted funding amount for an all-male founded venture exceeds all-female and mixed gender
teams by $11.80 million and $3.75 million, respectively. At a significance level of 0.1%, the
independent variables affecting the predictive funding amount include all-female founded
ventures and the following industry sectors: administrative services, artificial intelligence,
biotechnology, commerce and shopping, data and analytics, energy, and financial services. Due
to mixed gender ventures being immaterial at a 0.1% significance level, this value indicates
mixed gender teams do not meaningfully differ from their all-male counterparts in predictive
investment funding amounts. This finding correlates with average investment funding amounts
during the period of 2010 to 2019 which indicated mixed gendered team received greater
amounts of average capital accumulation in certain industries than their all-male venture founded
counterparts (Figure 1.5). While mixed gender teams appear to be immaterial in predicting future
investment funding, the results differ for females. The regression analysis indicates all-female
ventures to be disadvantaged in capital accumulation for startup ventures. The small number of
32
be fully predictive of investment funding patterns. However, given the overall data analysis
performed as part of my study, the prediction that females are disadvantaged in the
entrepreneurial ecosystem related to funding appears valid.
Qualitative Analysis
To collect my qualitative data, I conducted seven interviews with entrepreneurs and
investors, including angel investors and venture capitalists. The composition of this sample
included six females and one male. Three of the females encompassed both the roles of angel
investor and entrepreneur. One female represented only the entrepreneurial space. The other two
females work within the venture capital industry. The sole male interviewed for my qualitative
analysis founded a number of startups and currently pursues angel investing opportunities. While
the sample size appears small, the interviewees encompassed a vast geographic area and various
industry expertise. In discussions with my advisor, expanding the scope of this sample proved
unnecessary due to the consistency of my findings.
The summary of findings for each question posed to interviewees as set forth in Table 1.2
follows:
Investors
What is the gender of the founder for the majority of companies in which you invest?
Two of the respondents focus on investing in underrepresented entrepreneurs which
include females, the LGBTQ community, and minority ethnic groups. The remaining
respondents confirmed male entrepreneurs receive the majority of funding from their companies.
What industries would you consider to be the most likely to receive large sums of money?
Each respondent agreed the technology industry comprised the majority of investment
funds. Specifically, more than one respondent highlighted software, primarily related to business
33
tremendous investment funding. One respondent did include artificial intelligence and
blockchain, as well as healthcare to be likely industries to receive large investments. These
findings correlate with the quantitative analysis performed by industry category (Figure 1.3).
Further, an interviewee highlighted the massive funding needed to create a successful
biotechnology company directly correlates to the biotechnology industry’s dominance in
investment funding for the period 2010 to 2019.
Do you think gender of founder has ever affected your willingness to invest in a company?
Two of the females make sole investments in minority entrepreneurs; therefore, this
question did not apply. However, one of the female venture capitalists acknowledged the
#MeToo movement23 as a deterrent to males investing in female ventures. The interviewee
believed the tension created between genders by this movement creates an unfavorable
environment for females and males to transact business outside the confines of a business office:
an area where much business occurs, such as coffee meetings or dinners. While the #MeToo
movement correctly highlights needed reforms in the workplace for females, the pressure created
by the movement limits the willingness of males to interact with females in the entrepreneurial
ecosystem for fear of misinterpretation. This sentiment presented itself during my interview with
the sole male interviewee who confirmed his comfortableness with females due to his personal
circumstances. However, he acknowledged his male counterparts may not possess a similar
attitude given existing biases in the workplace. For examples, males prefer to work with males
because of familiarity.
23 The #MeToo movement was founded in 2006 to help survivors of sexual violence, particularly Black women and
34
What are the key attributes you look for in individuals / companies to decide whether or not you
will invest and how much to invest?
All interviewees agreed the key attribute to decide where to invest lie with the potential
growth of the company, no matter the gender of the founder. The scalability of the business
highlighted the decision-making process of investors as well as the coachability of the founding
team.
Founders
Do you believe your gender players a roll in the way investors see you? Have you ever felt like
your gender has been a disadvantage for you when trying to receive funding for your venture?
Of the four female entrepreneurs interviewed, three believed their gender deterred
investors. One female entrepreneur stated, “I had to be twice as good [compared to my male
counterpart] to get anywhere.” She further elaborated by stating that if investors did well with
male founded companies, they will likely continue to invest in males over females, creating a
pattern in the investment cycle. Interestingly enough, one of the female founders said she never
experienced discrimination because she “was so used to being the only female that she thought it
was normal.” As we continued our conversation and discussed the increased awareness of gender
bias, she reaffirmed her belief that her gender did not cause discrimination in investor funding
decisions.
Within your industry, do you see a vast majority of either female or male founders?
Consistent with the interviewee responses as investors, the number of males in the
entrepreneurial ecosystem, no matter the industry, far outweighs the number of females starting
ventures. Specifically, each interviewee created a company within the various technology
sectors. However, they believed a disproportionate number of males dominate the space. While
35
increasing, the discrepancy remains in the number of females starting ventures compared to their
male counterparts.
What is your general perception of male versus female founders?
A general observation made by both investors and entrepreneurs highlights that females
when entering an investment pitch appear more prepared than their male counterparts. Females
tend to request capital accumulation later in the business development model. For example,
females request money once they conduct in-depth market research and/or obtain revenue
whereas males tend to request investments before the product/service proves viable.
Investors and Founders
What role does gender play in the entrepreneurial ecosystem and how has it changed over the
past 10 years?
From both an investor and entrepreneur perspective, more than one respondent believes
females incur a diminished role in the entrepreneurial ecosystem due to bias. For example, one
female investor highlighted when an entrepreneur seeks funding, the potential investors ask more
preventative questions to females while their male counterparts receive promotion questions. As
my literature review indicated, promotion questions garnish more capital accumulation. Thus,
females incur bias at the initial stage of investment. One of the female interviewees believes the
expectation for female founders far exceeds their male counterparts. A female must “knock it out
of the park” in order to obtain funding while the male benchmark during a pitch does not require
the same expectation. One of the most interesting perspectives related to this question focused on
how things transformed over the past ten years. Almost all respondents agreed that not much
‘actually’ changed over the time period, but the attention to the underrepresentation of females in
36
Do you think females and males pursue different industries? If yes, what industries is each
gender pursuing more heavily?
All interviewees believe little differences exist in the industries pursued by females and
males. In the respondents’ objective opinion, males just outnumber females in the entrepreneurial
ecosystem, both as investors and entrepreneurs. However, three respondents, who invest at the
seed stage, found females to pursue more social ventures24 than their male counterparts. These
social ventures focus more on community good than high-growth, financial outcomes, resulting
in less investment dollars flowing to female founders who start social ventures.
Overall, the qualitative analysis consistently confirmed the lack of females in the
entrepreneurial ecosystem creates some of the gender funding discrepancy. However, the reasons
for this gap vary based upon the respondents’ personal experiences.