MICROBIAL COMMUNITY DYNAMICS OF THE DEEPWATER HORIZON OIL SPILL
Tingting Yang
A dissertation submitted to the faculty of the University of North Carolina at Chapel Hill in partial fulfillment of the requirements for the degree of Doctor of Philosophy
in the Department of Marine Sciences.
Chapel Hill 2014
Approved by: Andreas Teske
Carol Arnosti Samantha Joye Barbara MacGregor Christopher Martens
ABSTRACT
Tingting Yang: Microbial Community Dynamics of the Deepwater Horizon Oil spill (Under the direction of Andreas P. Teske)
The Deepwater horizon (DWH) oil spill released ~4.9 million (780,000 m3) barrels of crude oil into the Gulf of Mexico, causing the worst environmental disaster in U.S. history. Over 50% of the released oil could not be recovered. The task of biodegradation, to recycle the huge amount of hydrocarbon back to inorganic carbon and into microbial biomass, fell to the bacterial communities of the water column and the seafloor– which consequently changed in response to the oil fallout. These compositional and functional changes of the bacterial community in different stages of the spill provide the main focus of my study.
eventually made their way to the seafloor, as sediments with oily surface layer has been recovered since September 2010. Bacterial dynamics within the oil contaminated sediment included the appearance of Roseobacter and Verrucomicrobiaceae in September 2010, increase of anaerobic sulfate-reducing bacteria and organic matter degrading Cytophaga in October 2010. The Planctomycetes increased from low clone library proportions in October 2010 towards higher representation in November 2010 and July 2011, one year after the oil spill. Notably,
ACKNOWLEDGEMENTS
I would like to express my tremendous gratitude to my advisor Andreas Teske for his great guidance, support, patient, tolerance throughout the five years. Thank you for giving me the chance and having faith on me! Thanks to my husband Weigang Zhong for helping me think through my life, and for his love and support from cooking to computing. This project cannot go this far without contributions by Luke McKay, Tony Gutierrez, Lisa Nigro, Kai Ziervogel, Zena Cardman, Lindsay D’Ambrosio and Kelly Speare. I would like to thank my committee members Samantha Joye, Carol Arnosti, Barbara MacGregor, Christopher Martens, and Michael Piehler, for making me productive and helping me on the project. Thanks to those who create an
awesome Teske lab (Luke McKay, Zena Cardman, Lisa Nigro, JP Balmonte, Lindsay
D’Ambrosio, Frederick Dowell, Sarah Underwood, Vincent Klokman, Charlie Martin, Andrew Hyde, Kelly Speare, Srishti Dasarathy, Cassandre Lazar, and Verena Salman); to everyone who gave me instant help every time I knock their doors (Andreas Teske, Luke McKay, Kai
Ziervogel, Lisa Nigro, Zena Cardman, Anna Jalowska, especially Barbara MacGregor of those nights talking about auto-samplers and wild ideas!), to everyone I have been cruised together (special thank you to Mandy and her lab for the generous of sharing data and samples, and lots of sampling nights on ships!), to the folks of MASC department for the wonderful graduate student experience, and to my family who inspired and encouraged me all the time! This work has been supported by the Gulf of Mexico Research Initiative consortium research support entitled
TABLE OF CONTENTS
LIST OF TABLES ... xi
LIST OF FIGURES ... xii
LIST OF ABBREVIATIONS ... xiv
INTRODUCTION ... 1
CHAPTER 1: PULSED BLOOMS AND PERSISTENT OIL-DEGRADING BACTERIAL POPULATIONS IN THE WATER COLUMN DURING AND AFTER THE DEEPWATER HORIZON BLOWOUT... 22
1.1 Abstract ... 22
1.2 Introduction ... 23
1.3 Material and Methods ... 25
1.3.1 Samples and the molecular process. ... 25
1.3.2. Phylogenetic Analysis. ... 28
1.3.3. Pyrosequencing of partial 16S rRNA gene sequences. ... 30
1.4 Results and discussion ... 33
1.4.1 Bacterial community time lines. ... 33
1.4.2. Pyrosequencing results for surface oil slick and plume-impacted water column... 44
1.4.3. Pyrosequencing results for post-plume water column. ... 46
1.4.4. Contrasting interpretations of the post-plume bacterial community. ... 47
1.4.5. Natural Reservoirs of DWH Oceanospirillales. ... 49
1.5 Conclusions ... 50
2.1 Abstract ... 52
2.2 Introduction ... 53
2.3 Materials and Methods ... 54
2.3.1 Field samples and pure cultures ... 54
2.3.2 Oil-aggregate generation by roller bottles ... 56
2.3.3 Molecular analysis on oil-aggregates and pure cultured bacteria strains .... 56
2.4 Results ... 59
2.4.1 Hydrocarbon degradation by Halomonas sp. strain TG39 and amphiphilic properties of its EPS... 59
2.4.2 Formation of oil aggregates in roller bottles ... 63
2.4.3 Bacterial community composition within the oil aggregates ... 64
2.5 Discussion ... 66
2.6 Conclusion ... 71
CHAPTER 3: SUCCESSIONAL SEDIMENT BACTERIAL COMMUNITY DYNAMICS IN THE AFTERMATH OF THE DEEPWATER HORIZON OIL SPILL ... 73
3.1 Abstract ... 73
3.2 Introduction ... 74
3.3 Materials and Methods ... 76
3.4 Results and Discussion ... 81
3.4.1 Bacterial community change through timeline at phylum/sub-phylum resolution... 81
3.4.2 Bacterial community change through timeline at order/family/genus resolution... 88
3.5 Conclusion ... 99
CHAPTER 4: HYDROCARBON-DEGRADING BACTERIA ISOLATION AND ENRICHMENT ... 101
4.2 Materials and Methods ... 102
4.3 Results ... 106
4.3.1 Water column isolation experiment ... 106
4.3.2 21ºC sediment enrichment ... 109
4.3.3 4ºC sediment enrichment ... 113
4.4 Discussion ... 114
4.4.1 Water sample enrichment ... 114
4.4.2 Sediment samples enrichment... 118
4.5 Conclusion ... 122
APPENEX... 124
LIST OF TABLES
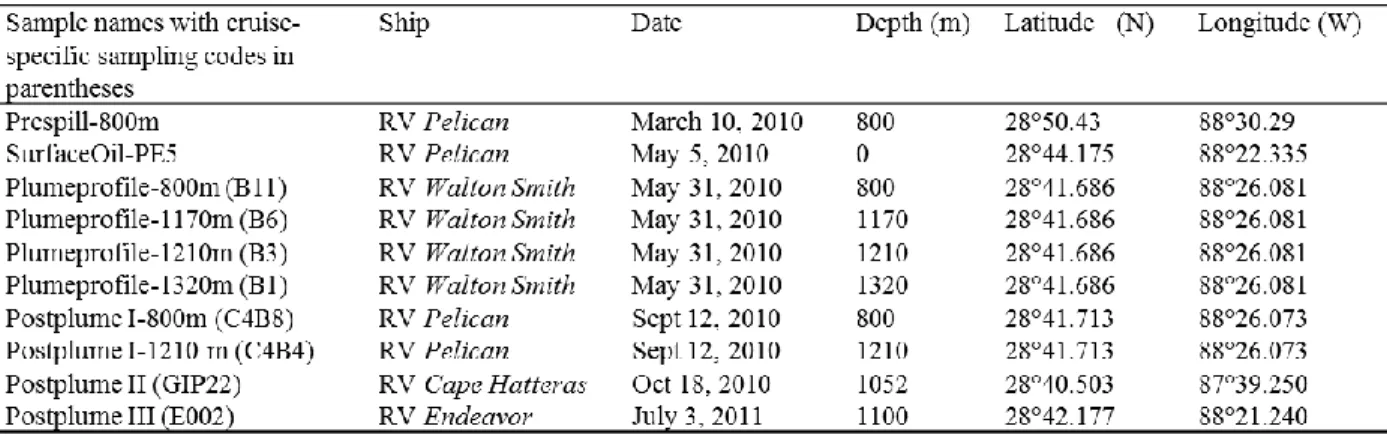
Table 1. Samples collected near the Macondo wellhead ... 27
Table 2. Genbank numbers for 16S rRNA gene clones. ... 30
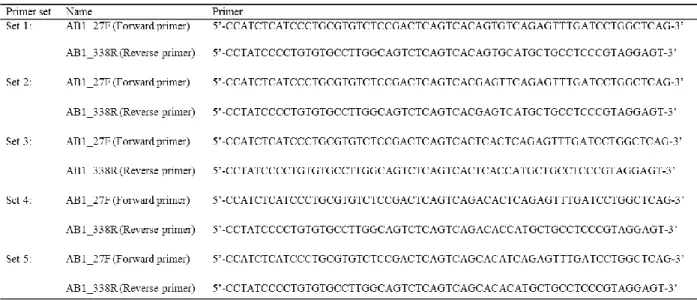
Table 3: Barcoded PCR Primer sets for 16S rRNA pyrosequencing. ... 31
Table 4. Composition of pyrosequenced 16S rRNA gene fragments ... 32
Table 5. Samples collected from the Deepwater Horizon site. ... 55
Table 6. Relative abundance of Halomonas in 16S rRNA gene pyrosequence libraries ... 62
Table 7. Samples collected near the Macondo wellhead ... 79
Table 8. Percentage of main phyla in sediment bacterial 16S rRNA and rRNA clone libraries .. 83
Table 9. Water samples collected from the Deepwater Horizon sites ... 103
Table 10. Sediment samples collected near the Macondo wellhead ... 106
Table 11. Relative abundance of the isolated strains in pyrosequencing libraries ... 109
LIST OF FIGURES
Figure 1. Location of the Deepwater Horizon spill wellhead.. ... 1
Figure 2. Graphic depiction of Deepwater Horizon spill. ... 3
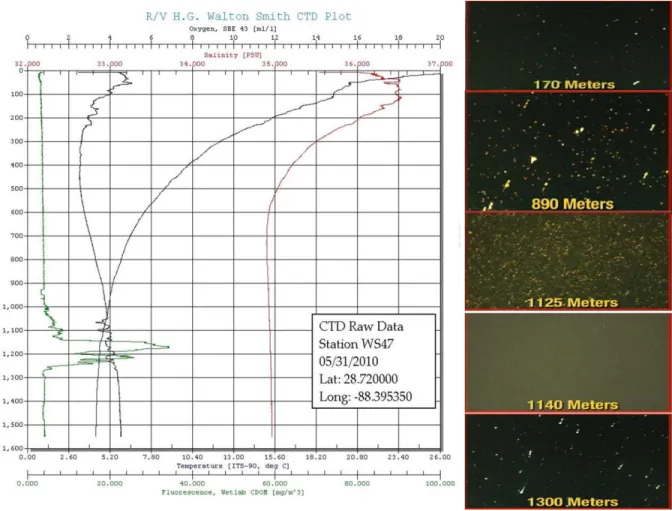
Figure 3. CTD profile and pictures of a deep sea plume ... 4
Figure 4. Dissolved oxygen anomalies southwest to the wellhead in September ... 6
Figure 5. Surface oil slicks from May 2010 ... 12
Figure 6. Hydrocarbon composition ... 13
Figure 7. oil-polluted surficial sediment layer in September 2010 ... 17
Figure 8. phylum- and subphylum composition of water column bacterial community. ... 36
Figure 9. Phylogeny of Gammaproteobacteria (group I) ... 39
Figure 10. Phylogeny of Gammaproteobacteria (group II). ... 42
Figure 11. Phylogeny of SAR11 Alphaproteobacteria in the Gulf of Mexico water column ... 44
Figure 12. Phylogeny of DWH Oceanospirillales ... 45
Figure 13. Mucus-rich marine snow observed in situ ... 54
Figure 14. Neighbor-joining phylogenetic tree of isolates ... 61
Figure 15. Enrichment of various exopolysaccharide (EPS)-producing bacteria ... 62
Figure 16. Photo of an oil aggregate formed in one of the roller bottles ... 63
Figure 17. Phylogeny of bacterial 16S rRNA genes from the bottle-enriched oil aggregates ... 65
Figure 18. Site map of sediment samples collected from May 2010 to July 2011 ... 77
Figure 19. Oil contaminated sediment cores ... 78
Figure 20. Bacterial 16S rRNA gene clone libraries of sediments ... 82
Figure 23. Deltaproteobacterial community change throughout the study time ... 91
Figure 24. Gammaproteobacterial community change throughout the study time ... 92
Figure 25. Bacteroidetes community change throughout the study time ... 94
Figure 26. Planctomycetes community change throughout the study time ... 96
Figure 27. Verrucomicrobial community change throughout the study time ... 97
Figure 28. Phylogenetic tree of deltaproteobacteria from sediment ... 98
Figure 29. 16S rRNA gene phylogenetic tree of Cycloclasticus. ... 99
Figure 30. Phylogenetic tree of SIP clones and isolated strains ... 107
Figure 31. Enrichment at 21 ºC ... 111
Figure 32. Phylogenetic tree of clones from 4 ºC and 21ºC sediment enrichments ... 113
Figure 33. Phylogenetic tree of genus Cycloclasticus ... 116
Figure 34. Phylogenetic tree of genus Alcanivorax. ... 117
LIST OF ABBREVIATIONS
DWH – Deepwater Horizon EPS – Exopolysaccharide GOM – Gulf of Mexico
INTRODUCTION
The Gulf of Mexico is a major oil reservoir in the United States, with its offshore oil production accounts for 17% of total US crude oil production (www. eia.gov). In total, the Gulf of Mexico has at least 22,000 detected natural seeps (http://1.usa.gov/1aKybyq), with estimated 1500 and 3800 barrels of oil naturally released to the Gulf daily, or up to 604,150 liters every year (MacDonald, 1998). Advanced technology allowed deep sea drilling which bring bloom of economy at the risk of the ocean and coastal ecosystems. The nearest example is the Deepwater Horizon oil spill, the worst environmental disaster in US history. On April 20, 2010, high-pressure gas escaped and was released on the drilling rig where it ignited and exploded. 11 workers tragically lost their lives; the Deepwater Horizon drilling rig, located in the northern Gulf of Mexico (28º44. 12 N, 88º23.14 W) about 50 miles south east of the Mississippi Delta (Figure 1), burned and ultimately sank 2 days after the explosion.
geological and biological characteristics lead to different weathering processes and diversified residues. The complexity of oil components together with the Gulf currents matrix made it extremely hard to continuously track the transportation of the released oil and monitor its component change.
Figure 2. Graphic depiction of Deepwater Horizon spill. Modified from Jack Cook, WHOI.
Oil and gas in the deep ocean water column
1000 m to 1300 m (Camilli et al., 2010, Diercks et al., 2010, Hazen et al., 2010, Joye et al., 2011). The first time that the deepwater plume was observed was during the May 2010 R/V Pelican cruise (May 9-16, 2010) (Diercks et al., 2010), where the equipped CDOM (color dissolved organic matter) sensor detected extremely high concentration of dissolved organic matter in the deep ocean, coincident with the dissolved oxygen (DO) anomaly at the same depth (Figure 3). After then, the plume had been reported in many other cruises from May to late June, 2010. Pictures took by underwater camera clearly showed the specific plume layer was
dramatically different by its milky color, presumably caused by the tiny crystals formed by light hydrocarbons at the in situ temperature and pressure.
morphology change of oil in the water column at various depths (Pics from Vernon Asper, RV Walton Smith, May 2010)
The deep plume was comprised of dissolved hydrocarbons and small droplets of oil (less than a micron) (Ryerson et al., 2012). Although readily soluble hydrocarbons made up ~25% of the leaking mixture by mass, it made up ~69% of the deep plume mass (Ryerson et al., 2012). Most of the C1-C3 hydrocarbons and a significant fraction of the water-soluble aromatic
compounds were retained in the plume layer, and methane (0.15 gg-1 of reconstituted fluid) was the largest portion of the gaseous phase retained in water (82.5% of the released gas phase) (Reddy et al., 2012). In contrast to other surface oil spills, only 0.01% of the methane injected into the water was released into the atmosphere (Ryerson et al., 2011), which indicated that most of the methane was retained in the water column. In May 2010, the average methane
concentration was 1.7 µM southwest of the wellhead (Crespo-Medina et al., 2014). Besides methane, components of the deep hydrocarbon plume also included ethane, propane and light aromatic hydrocarbons, like benzene, toluene, ethylbenzene and total xylenes (referred to collectively as BTEX) (Reddy et al., 2012). Dissolved hydrocarbons were relatively depleted after a while, and then the initially less abundant soluble species accumulated in a relatively high ratio in the plume. The small oil droplets within the plume accounted for 13-43% of the whole plume mass initially transported in the deep ocean (Ryerson et al., 2012).
concentration from three cruises from late August to early September was 1.4 ± 2.0 nM, with the maximum concentration (20.4 nM) not exceeding ambient levels for the Gulf of Mexico (Kessler
et al., 2011). In contrast, another study showed the August/September methane concentrations remained elevated throughout the water column at sites north of the Macondo wellhead (for
Figure 4. Dissolved oxygen anomalies southwest to the wellhead in September. (Mission Guidance, NOAA 2010, unpublished)
example, a 100nM methane anomaly was observed at MC118 at 650min September 2010) but not to the south/southwest, where low concentrations and low turnover rates of methane at plume depths (900 ~ 1,300 m) were observed, consistent with previously reported observations
(Crespo-Medina et al., 2014). According, the minimum dissolved oxygen concentration observed was 3.7 mg/L in late July; depressions ranged from 0.14 mg/L to3.7 mg/L below background (Zukunft, 2010). These DO depressions coincided with relative maxima in
fluorescence profiles that were interpreted as proxies for hydrocarbons, and extended as far as 80 km from the wellhead. The DO-removing potential in the deep plume was calculated as 0.041 ± 0.008 moles of O2 per gram of hydrocarbon. About (3.5 ± 0.5) × 1010 moles O2 were consumed
during the duration of the spill (Ryerson et al., 2012). However, as dissolved oxygen concentrations were not approaching hypoxic levels (<2.0 mg/L) and did not appear to be decreasing over time, their analysis indicated that hypoxic conditions would not occur in association with the deep dispersed plume (Zukunft, 2010).
Beside the released oil, ~771,000 gallons of dispersant (Corexit 9527 and Corexit 9500) was directly applied at the broken riser pipe. It was the first time in history to inject dispersant in the deep ocean. The concentration of the anionic surfactant DOSS (dioctyl sodium
sulfosuccinate, major component of Corexit complex) in subsurface samples did not exceed 40 µg L-1 (Gray et al., 2014). By tracing DOSS throughout spill and post-spill time, Kujiawinski et al. showed that DOSS was restrained at the plume depth, transported and diluted conservatively as indicated by its concentration distribution, and it persisted more than 300 km from the wellhead, 64 days after deepwater dispersant applications ceased (Kujawinski et al., 2011).
involved in cycloalkane degradation (Mason et al., 2012), presumably be the major group for degrading light alkanes in the plume. Other oil degraders, such as Colwellia, Marinobacter, and
Cycloclasticus were found as well, but at much lower abundance. While the bacteria community structure changed in late June, Colwellia and Cycloclasticus became the dominant groups (Valentine et al., 2010). Interestingly, the primary drivers of microbial respiration (as measured in the deep plume in June 11-21, 2010) were propane (C3H8) and ethane (C2H6), instead of
methane, which had extremely high concentration compared to other gases according to Valentine’s group (Valentine et al., 2010). Oxygen consumed by microbial consumption of propane and ethane accounted for 70% of the observed oxygen anomalies in the plume according to Valentine et al. (Valentine et al., 2010). Surprisingly, the peak of Methanotrophs was not detected in Valentine’s study even though the plume methane disappeared in a short time after the wellhead was capped. In contrast, another study showed in early May 2010 the measured methane-oxidation rates ranged from 0.014 to 502 nM d-1 and were highest in the deepwater plumes (Crespo-Medina et al., 2014). Methane-oxidation rates increased to maximal of 5,900 nM d-1 in late May/early June, but dropped to tens to hundreds of nM d-1 in late June, although methane concentrations were still above background (tens of µM on average), and continued to drop to 3-5 nM d-1 when measured in December (Crespo-Medina et al., 2014). Putatively the plume methane was predominately consumed by a novel phylotype of Methanotrophs, together with canonical methanotrophs; since the peak in abundance of the pmoA (particulate methane monooxygenase) genes in May and early June corresponded to the maximum methane-oxidation rate (Crespo-Medina et al., 2014). These results were supported by the abundance of transcripts with homology to the novel pmoA sequence in the transcriptome of samples collected
phylotype of Methanotrophs is not known; the affinity for methane of the novel phylotype was assumed low, since methanotropic activity and pmoA gene abundance sharply declined during June/July together with the sudden decrease in methane concentration (Crespo-Medina et al., 2014). In the results of another functional gene survey, pmoA and mmoX (soluble methane monooxygenase genes) were both found within plume and non-plume samples (Lu et al., 2012).
For the fate of methane in the plume, Kessler et al. claimed that methanotrophic and methylotrophic gammaproteobacteria had consumed all dissolved methane from the Deepwater Horizon incident, as these two groups of bacteria were found in 16S rRNA clone libraries in their August to September water samples. Yet, the presence of these two bacterial groups can also be interpreted as evidence of bacterial consumption of high molecular weight dissolved organic matter (McCarren et al., 2010). Although naturally enriched inside plume, the conspicuous
Oceanospirillales escaped from all tempt of pure culturing; novel species of traditional oil and gas consuming bacteria Colwellia, Marinobacter and Cycloclasticus were isolated from plume water under cool temperature (Baelum et al., 2012, Gutierrez et al., 2013, Gutierrez et al., 2013). For all the potential oil degraders, the question of which bacterial group was the most active degrader had remained open. Various metabolic genes involved both in aerobic and anaerobic oil degradation were found to be more abundant within the plume than outside the plume, indicating a whole microbial community response that was not limited to the novel Oceanospirillales (Lu et al., 2012).
resource to the growth of bacteria (Yakimov et al., 2007). Those bacteria can utilize maximum amount of nitrogen using various strategies (storage, low threshold of nitrogen facilitation concentration, fast nitrogen turnover time) would survive and bloom (Yakimov et al., 2007). However, the NH4 concentration in the Gulf of Mexico water column slightly increased from ~ 1
µM background level to dozens of µM on average during the spill period; no obvious change was observed in NOx and PO4 throughout the spill time (Crespo-Medina et al., 2014). Instead,
nitrite reductase transcripts suggested that nitrite was a major source of N other than ammonium or nitrate in the plume microbial population (Rivers et al., 2013). Since the main nutrients (nitrogen and phosphorus) were present in sufficiently high concentration in the plume, it is more likely that the trace elements (Fe, Cu etc.), virus lysis and the protest predators contribute to the decrease of the methanotrophs (Joung & Shiller, 2013, Crespo-Medina et al., 2014).
Oil and gas in surface of ocean and air, and the oily marine snow
where they evaporate from the slick within 1-2 d of surfacing (Ryerson et al., 2011, Ryerson et al., 2012); ~458000 kg/day hydrocarbons were evaporating from the ocean surface (Ryerson et al., 2011). n-C17, n-C16, n-C18, and n-C15 were the four most abundant hydrocarbons by mass in the initial surface slick; the four most abundant hydrocarbons by mass in the evaporating mixture were n-heptane, n-octane, n-nonane and methylcyclohexane (Ryerson et al., 2012). However, methane, ethane, and benzene, which were abundant in the deep plume, were not released into the atmosphere, indicating complete dissolution in the water column (McNutt et al., 2011, Ryerson et al., 2011, Ryerson et al., 2012). Based on data from 10 June, 2010, the
hydrocarbons released as surface slick and evaporating into overlying air were estimated as 1.0 ± 0.5 and 0.46 ± 0.1 million kg/day, respectively, as shown in Figure 6. These surface slicks collected up to 240 km from the wellhead showed losses of compounds eluting earlier than n-C13, consistent with evaporative loss (Aeppli et al., 2012). In addition, dissolution affected these
early weathering-stage slicks as indicated by the depletion of naphthalene relative to C1-naphthalene as compared to the oil directly from the wellhead; however, longer chain alkane degradation was not observed at that time as reflected by constant n-C18/phytane ratio (Aeppli et al., 2012). The total concentration of 30 PAHs decreased from 18 mg g-1 oil for the wellhead to
Figure 6. Evaporated hydrocarbon composition after 2 d (A; blue bars), surface oil slick
composition after 2 d (B; black bars), and dissolved hydrocarbon composition (C; red bars). The leaking hydrocarbon composition from CH4 through n-C39 (black line) is shown in each panel for comparison. (D) Schematic (not to scale) of hydrocarbon mass flows in the marine
environment; values are calculated for June 10, 2010, in millions of kilograms per day. From (Ryerson et al. 2012)
Enhancing microbial petroleum degradation with dispersants is a major strategy for bioremediation. During the Deepwater Horizon oil spill, approximately 1.4 million gallons of dispersant were used at the surface, between May 15 and July 12 (from
enzymatic biodegradation (Pavitran et al., 2006). However, in a lab microscopy experiment, researchers have found that the alkane degrader Alcanivorax tended to attach on the big oil droplets instead of smaller ones (Roman, 2014). Another study indicated that the dispersant increases the toxicity of crude oil to marine zooplankton (Almeda et al., 2014). Other than by dispersed, the surface slick can be weathered by wind, waves and solar irradiation (Council, 2003). Burning was also a way to remove surface slick during the oil spill, with its obvious side effect of air pollution, and contribution to the extra particle organic matter input to the seafloor (Brooks et al., 2014).
Previous study showed that the biodegradation of the Deepwater Horizon oil in the offshore oligtrophic surface water was largely enhanced by the oil input, although both chemical data and enzymatic evidence indicated that phosphate was scarce at the sampling region. No concomitant increase of microbial abundance or biomass was observed in the slick (Edwards et al., 2011). Studies of previous oil spill or lab experiments showed that bacteria belong to
Cycloclasticus and Alcanivorax were dominant groups in oil contaminated sea water (Kasai et al., 2002a, Kasai et al., 2002b, Maruyama et al., 2003, Harayama et al., 2004). These groups most likely contributed to biodegradation in the surface oil slick. In the surface oil slick sampled in May 2010, Cycloclasticus dominated (> 90%) the slick bacterial community (Yang et al., 2014); in comparison, the oil slick from June 2010 contained mostly Pseudoalteromonas in one sample, but Pseudomonas, Vibrio, Acinetobacter, and Alteromonas in another sample (Redmond & Valentine, 2012). The oil sheen samples collected in June 2010 contained Cyanobacteria and
Alphaproteobacteria (SAR11 clade, Rhodobacterales, and Rhodospirillales), with just 15% of sequences affiliated with possible hydrocarbon degraders from the Alteromonadales and
groups (< 5%) in the June oil slick samples (Redmond & Valentine, 2012). In another study, although Alphaproteobacteria and Gammaproteobacteria were still the dominant groups in the oil slick derived from May 2010, the community composition differed from the results obtained by Redmond and Valentine (Liu & Liu, 2013), indicating the slick samples were not
homogeneous and their composition changed over time.
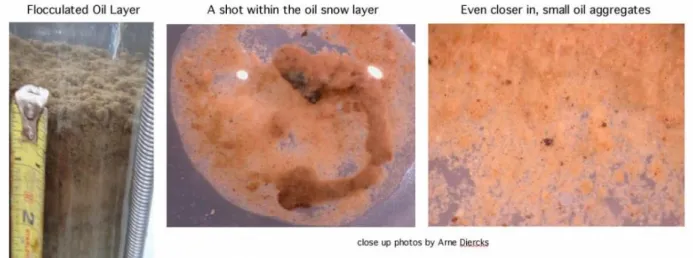
Large, mucous rich marine snow was observed floating at the surface in the immediate vicinity of oil layers near the wellhead area in May 2010; after one month, in late June, all GoM- snow had vanished from view (Passow et al., 2012). Therefore, the rapid sedimentation of the oil marine snow was hypothesized since an in situ underwater camera caught videos of the sinking particles (Arne R. Diercks & Vernon Asper, ROV video, May 2010 R/V Pelican cruise,
unpublished data). Scientists believed that as much as one third of the oil may have been
entrained with deep currents at depths of more than 1000 meters, contaminated sediment as deep currents moved it around and dragged it to the bottom of the Gulf of Mexico, as so called “dirty blizzard” (Schrope, 2013). The estimated velocity of those sinking snow particles varies from 68 to 543 m/day (Passow et al., 2012). Mixed together with the high nutrients, clay, minerals and low salinity river run-off from the Mississippi River and associated diversionary channels, the formation of oily marine snow was enhanced because of the stimulated phytoplankton growth by the nutrients and the increased snow aggregates by the mineral clays (MOSSFA-committee, 2013). Pyrogenic PAHs and soot particles derived from oil burning contributed to the formation of marine snow as well; however the contribution of these particles to the snow particles are still under investigation (MOSSFA-committee, 2013). Sediment trap data showed very high
inputs of carbonates and organic carbon and terrestrially organic matter composed the other significant portions (MOSSFA-committee, 2013). The degraded or partially degraded oil and the left-over heavy oil after weathering and biodegradation sink into the deep ocean is essential to transit oil from surface to the seafloor as organic carbon source (DOC or POC) (Ziervogel et al., 2012).
Influence of the oil spill to the benthic environment
concentration of the total petroleum hydrocarbon (TPH) than EPA standard (Mason et al., 2014). These high TPH samples spread unevenly, without obvious geographical feature. The nitrogen concentration may explain their patchy distribution (Mason et al., 2014). One of the factors contributed to the complexity of the oily snow precipitation could be the re-suspension of the surficial sediment caused by the deep current of the Gulf of Mexico, However, the hypothesis cannot be proved since there is no model to mimic the deep current yet.
Figure 7. An obvious fluffy, red-brownish surface layer was found in September 2010 sediment cores collected close to the wellhead. A closer look of this layer revealed large amount of oil aggregates. (From Mandy Joye and Arne Diercks)
More support of the “Dirty Blizzard” theory was from isotopic data. Fast sedimentation rate was indicated by high activity of Th234 detected in the surficial sediment derived from 2010 (Brooks et al., 2014). Th234 is an isotope of thorium, with its half-time as short as 24.5 days. The normal sedimentation rate is a long-term process which leads to depletion of Th234 in sediment.
In another word, only fast sedimentation process could preserve high activity of Th234.
Th234 profiles reflect deposition of the 0.4-1.2 cm surface layer in a 4-5 month period in the late
summer/fall of 2010, with higher mass accumulation rates (MARs) compared to average rates (past ~100 yrs). Using the same 234Th methodology, MARs have decreased over the two years following the event(Brooks et al., 2014). The red-brown color was considered derived from two sediment layers enriched manganese oxide. Between the Mn maxima, a layer with a modest enrichment of Re, consistent with reducing sediments was sandwiched (Hastings et al., 2014).
The reducing condition in the surficial sediment is generally considered driven by microorganisms, which maybe correspondently been affect as well. A study showed several
Alphaproteobacteria and Gammaproteobacteria group (especially a Colwellia taxon), previously been found in the plume water during the spill appeared again in the polluted sediment (Mason et al., 2014). Their metagenomic analysis indicated that nitrogen and hydrocarbons are the two main drivers to the community change in the polluted and non-polluted samples; the anaerobic process denitrification was very active as indicated by the annotated genes (Mason et al., 2014). Analyzing the 3 representative sediment samples from Mason et al.’s collection by metagenomic sequencing, Kimes et al. found that two samples close to the wellhead contained high abundance of Deltaproteobacteria, especially the aromatic hydrocarbon degradation related anaerobic sulfate-reducing bacteria Desulfobacterales, Desulfovibrionales and Desulfuromonadales
Vibrio, Flavobacteria and Acidobacteria were dominant in the 0–2-cm surface sediments. The differences between studies indicate that the oil impact to the seafloor was patchy and locally divergent; sediment bacterial community response to the oil input needs more detailed work.
The oil fallout seriously impacted the benthic macro-organisms as well. The redox condition change was the presumable reason for a community-wide decrease in benthic
foraminifera (Hastings et al., 2014). Reductions in abundance and diversity of the benthic macro-fauna was observed in a distance of 3 km to the wellhead, with moderate impacts detected to as far as 17 km to the southwest and 8.5 km to the northeast of the wellhead (MOSSFA-committee, 2013). These impacts correlated to the observed elevated TPH, PAH, and barium concentrations and the distance to wellhead (MOSSFA-committee, 2013). Deep sea coral suffered the oil fallout as well: at one site 13 km southwest of the wellhead, coral community covered by brown flocs presented wide spread signs of stress, including tissue loss, sclerite enlargement, excess mucous production and bleached commensal ophiuroids (White et al., 2012). A more recent study found two other coral communities which were further away also been impacted by the spill (Fisher et al., 2014). Other potential impact of the settled oil to deep sea fish and other organisms were also detected, as reported in the 2014 GOMRI meeting.
Oil transported to beach, salt marshes
Gulf of Mexico coastal habitats generates more than $10 billion per year in revenues by fisheries and tourism (Silliman et al., 2012). However, approximately 9 ± 4 × 10⁷ kg of the
and tourism. Partially weathered tar balls and oil aggregates were found on the beaches starting in June, and were buried to depth by newly arrived sands in a short time. For example, the tarballs and tar mats began washing ashore around June 23 in Pensacola beach; in early July, oil patties and tarballs were discovered as deep as 0.6 m (National Geographic report, July 2, 2010). The sand patty and rock scrapping collected from oiled beaches between July 2010 and
November 2011 showed extensive biodegradation, as indicated by much less resolvable alkanes, and lower n-C18/phytane values than the sea surface oil slick from June 2010 (2.1 vs. 2.5) (Aeppli et al., 2012). The total concentration of 30 PAHs decreased further from 7.7-13 mg g-1 oil for surface slicks, to 0.6-2.8 mg g-1 extractable material for sand patties and rock scrapings
(Aeppli et al., 2012). PAH losses calculated by normalization to hopane were 83-98% for sand patties and 93% for the rock scraping (Aeppli et al., 2012). In the meanwhile, the operationally defined oxygenated fractions increased significantly in sand patties and rock scrapings, another evidence for intensive biodegradation (Aeppli et al., 2012). Microbial community survey showed bloom of bacterial abundance (predominately by Gamm- and Alphaproteobacteria) in oiled sands, especially the alkane and aliphatic compounds degrader Alcanivorax and Marinobacter
(Kostka et al., 2011). Thanks to the vegetation from the marsh edge, only the outer marsh regions were impacted by oil (within 15 m from the marsh edge), where levels of total PAHs in the polluted sediment was >100 times higher than intact sediment. However, high portion of plant in this region were dead (36%-95%) (Silliman et al., 2012). Heavier fractions were resistant in marsh sediments, contrast to the lighter hydrocarbons that were rapidly degraded by known hydrocarbon degrading bacteria such as Rhodobacterales and Sphingomonadales, as well as high abundance of sulfate reducing bacteria coincident with the high level sulfite
food web as carbon, however, more careful studies are required before connect the oil to the spill oil from the Macondo wellhead (Chanton, 2013).
As demonstrated above, study the Gulf of Mexico oil spill and its effect to the ecosystem is a hard task, since the residue oil interacts with various environments not only tightly influence each other but also has complex features individually. Because microbial mediated
biodegradation is the only way to transform oil-derived hydrocarbons into biomass or
remineralize them to CO2, an essential part to understand the fate of the released oil is to study
CHAPTER 1: PULSED BLOOMS AND PERSISTENT OIL-DEGRADING BACTERIAL POPULATIONS IN THE WATER COLUMN DURING AND AFTER THE
DEEPWATER HORIZON BLOWOUT1
1.1 Abstract
One of the defining features of the Deepwater Horizon oil spill was the rapid formation and persistence of a hydrocarbon plume in deep water. Here we use 16S rRNA gene clone libraries and pyrosequencing of 16S rRNA gene fragments to outline the temporal dynamics of the bacterial community in the water column near the Macondo wellhead. Our timeline starts with the pre-spill (March 2010) status of the water column bacterial community, continues through the bacterial enrichments dominating the hydrocarbon plume after the blowout (DWH
Oceanospirillales, Cycloclasticus, Colwellia) in late May 2010), and leads towards post-spill bacterial communities with molecular signatures related to degradation of phytoplankton pulses (September and October 2010; July 2011) in the water column near the Macondo wellhead. We document a dramatic transition as the complex bacterial community before the oil spill was temporarily overwhelmed by a few specialized bacterial groups responding to the massive influx of hydrocarbons in May 2010. In September and October 2010, this bacterial bloom had been replaced by a diversified bacterial community which resembled its predecessor prior to the spill.
1 This chapter was previously published as an article in Deep Sea Research Part II: Topical Studies in
Oceanography. The original citation is as follow: Tingting Yang, Lisa M. Nigro, Tony Gutierrez, Lindsay D׳Ambrosio, Samantha B. Joye, Raymond Highsmith, Andreas Teske, Pulsed blooms and persistent oil-degrading bacterial populations in the water column during and after the Deepwater Horizon blowout, Deep Sea Research Part II: Topical Studies in Oceanography, Available online 23 January 2014, ISSN 0967-0645,
Notably, the post-plume 16S rRNA gene clone libraries and pyrosequencing datasets illustrated the continued presence of oil-degrading bacteria in the water column near the Macondo wellhead which we posit to represent an inherent signature of hydrocarbon catabolic potential to the Gulf of Mexico. The pyroseqencing results detected and tracked minority bacterial populations that were not visible in the conventional 16S rRNA gene clone libraries and allowed us to identify natural reservoirs of the Deepwater Horizon Oceanospirillales within and outside of the Gulf of Mexico.
1.2 Introduction
The explosion and sinking of the Deepwater Horizon platform discharged oil and gas into the Gulf of Mexico and generated massive and long-lasting perturbations in its ecosystem
(Schrope 2011). One of the defining features of the Deepwater Horizon oil spill was the
formation of a deepwater hydrocarbon-enriched plume during the multiphase ejection of gas and oil from the wellhead. The plume was positioned between approx. 1000 and 1300 m depth due to preferential entrainment of the soluble complex hydrocarbons within the deep, cold (5°C) water, and consisted mostly of light alkanes (C1 to C3), BTEX, submicrometer-size oil droplets
(Ryerson et al. 2012, Reddy et al. 2012); it also entrained the dispersant compound dioctyl sodium sulfosuccinate (DOSS) (Kujawinski et al. 2011). The deep plume was detected initially in early May 2010 (Diercks et al. 2010b), and its gradual spread was monitored throughout the summer of 2010 (Hazen et al. 2010, Camilli et al. 2010, Kessler et al. 2011, Joye et al. 2011b) by tracking local oxygen depletion and C-DOM fluorescence maxima as proxies for the presence of hydrocarbons and microbial activity (Diercks et al. 2010b, Wade et al. 2011). However, tracking the evolving composition of the bacterial community in the oil-impacted water column,
Initially, changes of the microbial community in the water column were inferred from Phylochip® analyses of oil degrading communities (Hazen et al. 2010), or from models of
methane, ethane and propane dynamics (Valentine et al. 2010, Kessler et al. 2011). These studies did not provide exact information on sampling times, water depths and geographical positions for their molecular data. Additional 16S rRNA gene clone library datasets were recently synthesized and published with precise sampling locations and times, in order to coherently survey the changing bacterial community composition over the lifetime of the deep hydrocarbon plume (Redmond and Valentine 2012). In late May 2010, the plume-associated bacterial community was dominated by a specific cluster within the Oceanospirillales, subsequently termed Deep Water Horizon (DWH) Oceanospirillales, before changing in mid-June to a community where most clones grouped with the genera Cycloclasticus, obligate degraders of aromatic
hydrocarbons, and Colwellia, known as a genus of psychrophilic marine heterotrophic generalists. By early September, the bacterial community had diversified considerably and included different Alphaproteobacteria, multiple lineages within the Gammaproteobacteria,
Flavobacteria, and several other phylum-level lineages such as the Actinobacteria,
2010; July 3, 2011) near the Macondo wellhead with 16S rRNA gene clone libraries. 2) A water column profile near the Macondo wellhead with samples above, within and below the deep hydrocarbon plume during its Oceanospirillales-dominated phase (May 31, 2010) is analyzed with conventional 16S rRNA gene clone libraries and by 16S rRNA gene fragment
pyrosequencing. 3) The water column profile is compared to surface water samples contaminated with weathered oil from early May 2010 (May 5, 2010), and post-plume water samples
(September 12 and October 18, 2010) from near the wellhead and east of the wellhead, using pyrosequencing.
1.3 Material and Methods
1.3.1 Samples and the molecular process.
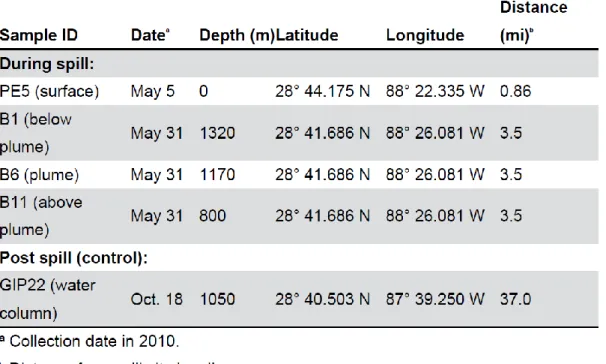
Sampling. Surface and water column samples were obtained during six research cruises (Table 1). The pre-spill sample (March 10, 2010) was obtained on RV Pelican by CTD cast at 800 m depth, ca. 10 nautical miles northwest of the Macondo wellhead (28°50.43 N, 88°30.29 W). The water column did not show any of oxygen or CDOM anomalies. From May 5 to 9, Oil spill surface water samples were collected via bucket sampling from the R/V Pelican, and kept at ca. 4°C during and after immediate transport to Chapel Hill. Surface water sampled ca. 0.5 nautical miles from the wellhead (28°44.175 N, 88°22.335 W, May 5, 2010) showed the
the wellhead (R/V Walton Smith, May 31, 2010; 28°41.686 N, 88°26.081 W). Water samples of approx. 500 ml were collected at 800, 1170, 1210, and 1320 m depth. Immediately after
shipboard recovery, they were filtered through 47 mm diameter and 0.22 µm poresize Anodisc filters; the filters were placed on dry ice until DNA extraction in Chapel Hill. The 1170 m and the 1210 m samples of this profile represent the deepwater hydrocarbon plume, as indicated by localized oxygen depletion and increased water column fluorescence measured during the CTD cast. On September 12, almost two months after the Macondo wellhead had been capped on July 15, 2010, water column filter samples were collected again at the same location (R/V Pelican; 28°41.713 N, 88°26.073 W) to evaluate the water column bacterial community at 800 and 1210 m depth (Postplume I). CTD profiles no longer detected the in-situ indicators (localized oxygen depletion coinciding with fluorescence maximum) of the deep hydrocarbon plume, consistent with the deepwater circulation of the Gulf of Mexico that moved the deep hydrocarbon plume in a southwesterly direction already at the onset of the spill (Diercks et al. 2010b). A negative control sample (Postplume II) was obtained 37 nautical miles east of the wellhead (28°40.503 N, 87°39.250 W) at a depth of 1052 m (R/V Cape Hatteras, October 18, 2010). Due to the
Table 1. Samples collected on multiple research cruises near the Macondo wellhead with dates, water depths, and geographical coordinates.
DNA Extraction. DNA from sediment was extracted and purified from water sample filters as described previously (Teske et al. 2011). Using sterile forceps, one quarter of each frozen filter was placed and crushed into a 2 ml microcentrifuge tube containing sterile 200 µL of TE buffer (10 mM Tris and 1 mM EDTA, pH 7.5), with 0.5 % (wt/vol) sodium dodecyl sulfate and proteinase K (50 µg mL-1). Reactions were incubated at room temperature for 30
PCR Amplification and Cloning. The bacterial 16S rRNA gene was amplified with Speedstar DNA polymerase (TaKaRa, Shiga, Japan) using the bacterial primers 8f and 1492r (Teske et al. 2002) and the manufacturer’s recommended concentration for buffer, dNTPs and DNA polymerase. Each PCR reaction consisted of 2 l DNA extract, 2.5 l 10X FBI buffer (TaKaRa, Shiga, Japan), 2.0 l dNTP mix, 2.0 l 10 M solution of primers 8F and 1492R, respectively (both primers from Invitrogen, Carlsbad, CA), and 0.25 l SpeedStar polymerase (TaKaRa), and was brought to 25 l with sterile H2O. Amplification was performed in a BioRad
iCycler Thermal Cycler (Hercules, CA) as follows: initial denaturation at 95ºC for 4 minutes, 25 cycles of 95ºC (10 seconds), 55ºC (15 seconds) and 72ºC (20 seconds), and a final 10 minute extension of 72ºC. PCR product aliquots, including positive and negative controls, were SYBR green stained and visualized using a 1.5% agarose gel. The PCR products were purified using the MinElute® PCR Purification Kit according to the manufacturer’s instructions (Qiagen, Valencia, CA), and cloned into OneShot® TOP10 competent Cells (Invitrogen, Carlsbad, CA) using the TOPO TA Cloning® Kit for Sequencing (Invitrogen) according to the manufacturer’s
instructions. Transformed cells were grown on LB/Xgal/Kanamycin plates. Individual white colonies were arbitrarily picked, re-plated and sanger-sequenced at Genewiz Corporation (South Plainfield, NJ) using vector primers M13 F and M13 R.
1.3.2. Phylogenetic Analysis.
Near-complete 16S rRNA gene sequences were analyzed using Sequencher (Gene Codes, Ann Arbor, MI) and compared to other sequences via the Basic Local Alignment Search Tool (BLAST) of the National Center for Biotechnology Information (http://blast.ncbi.nlm.nih.gov/) (Altschul
separate alignments for the Gamma- and Alphaproteobacteria were prepared with sequences for related Gammaproteobacteria and Alphaproteobacteria. Sequences of well-characterized pure cultures and described species were used for phylogenies whenever possible; otherwise, molecular phylotypes with an informative literature history were selected to anchor major phylogenetic branches of uncultured bacteria. Phylogenetic trees were constructed and bootstrap checks (1000 reruns) of the tree topology were performed using ARB’s neighbor-joining
Table 2. Genbank numbers for 16S rRNA gene clones.
1.3.3. Pyrosequencing of partial 16S rRNA gene sequences.
products. The PCR products were purified using MiniElute PCR Purification kit (QIAGEN)
Table 3: Barcoded PCR Primer sets for 16S rRNA pyrosequencing.
and stored in 1×TE buffer for pyrosequencing analysis using the Roche 454 GS LFX Titanium Sequencer in the Microbiome Core Facility at the University of North Carolina at Chapel Hill (www.med.unc.edu/microbiome). Raw data were trimmed and filtered using LUCY to remove poor quality
reads (minimum PHRED score of 27.5) and those of less than 200 nt (Kunin et al., 2010). The 8 nt barcode was used to de-multiplex and assign reads to samples using QIIME (Caporaso et al., 2010). The reads were binned into operational taxonomic units (OTUs) at 97% sequence identity with UCLUST (Edgar, 2010) followed by selection of a representative sequence based on the most abundant unique read within each cluster. After initial phylum- and family-level
to genus- or family-level phylogenetic branches defined by 16S rRNA gene clone library sequences (Table 4).
Arctic96BD19, ZD0417, SAR156) or cultured gammaproteobacterial genera of oil degrading heterotrophs (Oleispira, Oleiphilus, Marinobacter, Alkanivorax).
1.4 Results and discussion
1.4.1 Bacterial community time lines.
The timeline of bacterial community composition in the aftermath of the Deepwater Horizon blowout reveals a complex pattern of microbial community succession within the oil and gas-impacted water column of the Gulf of Mexico. The baseline for bacterial community composition in the Gulf of Mexico water column on the eve of the Deepwater Horizon blowout is accessible thanks to a serendipitous water sample, collected on March 10, 2010 at 800 m depth at the Mississippi Canyon 118 Microbial Observatory, ca. 9 nautical miles northwest of the Macondo wellhead (Table 1). The 16S rRNA clone library results indicated a water column bacterial community where SAR11 and other Alphaproteobacteria, the SAR 406 lineage, the deltaproteobacterial SAR324 lineage, and a complex gammaproteobacterial assemblage of cultured and uncultured lineages, often within the families Oceanospirillales and
Alteromonadales, constituted the dominant proportion (76%) of all clones. Other phyla, such as
Chloroflexi, Bacteroidetes, Acidobacteria, Planctomycetes, Verrucomicrobia,
Gemmatimonadetes and Cyanobacteria were also present (Figure 8). This bacterial community matches, in phylum-level composition and in relative abundance of the major community members, the open-ocean Atlantic and Pacific bacterial communities from the same depth (800 m), as determined by single-cell genome amplification and sequencing (Swan et al., 2011). Thus, the pre-spill deepwater column near the Macondo wellhead shared the microbial community of the ultimate source reservoir of the Gulf of Mexico, the Atlantic Ocean.
hydrocarbons. The pre-plume bacterial 16S rRNA gene clone library contrasted sharply with the bacterial community composition of the oil-contaminated surface water sample (May 5, 2010) and the hydrocarbon-enriched deepwater plume samples (May 31, 2010). The 16S rRNA gene and pyrosequencing analyses of oil slick-contaminated surface water samples collected shortly after the beginning of the discharge (May 5-9 2010; RV Pelican) demonstrated rapid
colonization of the surficial oil slick-seawater mixture by PAH-degrading bacteria of the genus
Cycloclasticus, by oil-degrading members of the genera Pseudoalteromonas, Alteromonas and
Colwellia, and by other heterotrophic bacterial groups (Figure 8). This microbial community formed extensive flocs of microbial exopolymeric substances (EPS), observed in the field as microbial flocs developed ubiquitously in the oil-contaminated surface waters in early May 2010 (Passow et al. 2012), and in the laboratory in roller table bottle incubations using fresh oil slick samples and Gulf of Mexico surface water (Ziervogel et al. 2012). Sinking flux of these oil slick-derived microbial EPS flocs exported the associated microbial communities into the deep Gulf of Mexico (Passow et al. 2012).
The clone libraries and pyrosequencing datasets from deep hydrocarbon plume samples (1170 and 1210 m depth) collected on May 31, 2010, were strongly dominated by members of the DWH Oceanospirillales cluster; Cycloclasticus and Colwellia were detected as the most substantial minority population in the pyrosequencing datasets (Figure 8; Table 4). The
pyrosequencing datasets detected many bacterial groups in the plume layer that were not visible in the clone libraries, such as Deltaproteobacteria and the SAR406 lineage. The
May 31, 2010. B) Pre-plume March 2010 sample from 800 m depth near MC118; water column samples from 800 and 1210 m depth near Macondo wellhead, collected September 12, 2010; water column samples from October 18, 2010, and July 3, 2011.
Based on sampling time and location, these water column samples are congruent with previous sampling surveys and bacterial community analyses of the well-documented deep hydrocarbon plume near the Macondo wellhead. Hazen et al. (2010) reported that uncultured members of the gammaproteobacterial order Oceanospirillales dominated 16S rRNA gene clone libraries in the deepwater plume between 1100 and 1220 m depth at the end of May 2010 (May 25 to June 2). Subsequent single-cell genome sequencing of two Oceanospirillales single cells revealed that they possessed genes involved in the degradation of n-alkanes and cycloalkanes (Mason et al. 2012). This genomic potential of the DWH Oceanospirillales is also consistent with the physiological capabilities of their close cultured relatives, Thalassolituus oleivorans
(Yakimov et al., 2004) and Oleispira antarctica (Yakimov et al., 2003), which oxidize long-chain n-alkanes aerobically (Figure 9). Alkane oxidation remains to be checked in the cultured relatives Bermanella marisrubri (Pinhassi et al., 2009) and Oceanoserpentilla haliotis (Schlosser
et al., 2008). Previous analyses show that the hydrocarbon plume had a strong enrichment effect on many heterotrophic genera of marine Gammaproteobacteria, whose 16S rRNA gene
frequency had increased by 100 to 300% within the plume (Hazen et al. 2010); subsequent microarray-based phylochip analysis of DNA from hydrocarbon plume samples showed
found in our 16S rRNA gene surveys either in plume or post-plume samples, such as
Figure 9. Phylogeny of Gammaproteobacteria (Oceanospirillales and Alteromonadales
including DWH Oceanospirillales) in the Gulf of Mexico water column near the Macondo wellhead, based on near-full length 16S rRNA genes. Clones from the pre-spill water column sample (March 10, 2010) are labeled “Prespill”; clones from surface oil slicks (May 5, 2010) are labeled “Surfaceoil”; clones from plume water column samples (May 31, 2010) are labeled “Plumeprofile”. Clones from September 12 and October 18, 2010, and from July 3, 2011, are labeled Postplume I, II and III, respectively. The clone designations are followed by sampling depth in meters, and a 3-digit clone ID (Table 2).
The detection of Cycloclasticus and Colwellia spp. in our pyrosequencing surveys of the plume samples (May 31, 2010) is consistent with the previously published clone library detection of these genera in plume samples from May 26 to June 5 (Redmond and Valentine 2012), and shows that these two oil-degrading genera co-occurred with DWH Oceanospirillales in the deep plume (Figure 8). In plume samples collected two weeks later (June 13 to 16, 2010), 16S rRNA gene phylotypes of the genera Cycloclasticus and Colwellia predominated (Redmond and Valentine 2012); these genera were discussed as bacterial catalysts of the dominant oxygen-consuming process, ethane and propane oxidation, in the deep-water plume (Valentine et al. 2010). This interpretation contrasts with the known substrate spectrum of Cycloclasticus, a genus described originally as aerobic degraders of polycyclic aromatic hydrocarbons (Dyksterhouse et al. 1995). Cycloclasticus remains recognized as an obligate degrader of these compounds (Yakimov et al. 2005); several Cycloclasticus strains were previously isolated from Gulf of Mexico sediments by enrichment with PAH substrates (Geiselbrecht et al. 1998). Thus, a likely role for Cycloclasticus is the degradation of BTEX compounds in the plume. The moderately psychrophilic genus Colwellia, consistently present in plume- and post-plume samples (Figure 9), was selectively enriched on crude oil at 4ºC (Redmond and Valentine 2012) and was capable of oil degradation at in-situ temperatures of 5ºC (Bælum et al. 2012), consistent with the in-situ temperature of the deep Gulf of Mexico water column. Viewed in context, the bacterial
DWH Oceanospirillales in late May to becoming dominated by Colwellia and Cycloclasticus in mid-June (Valentine et al. 2010, Redmond and Valentine 2012).
By mid-September 2010, oxygen depletion signals, CDOM fluorescence and DOSS concentrations showed that the slowly decaying deep hydrocarbon plume drifted in a generally west-southwesterly direction away from the Macondo wellhead area (Kessler et al. 2011; Kujawinski et al. 2011); this is consistent with our CTD profile of the water column near the Macondo wellhead, recorded on Sept 12 2010, that lacks hydrocarbon plume signatures. The post-plume 16S rRNA gene clone libraries and pyrosequencing surveys of September and October 2010, and the 16S rRNA gene clone library of July 2011 shared dominant bacterial groups with the clone library of March 2010, indicating a partial recovery towards the pre-spill bacterial community. The SAR11 Alphaproteobacteria, the SAR406 lineage, the
deltaproteobacterial lineage SAR324, and a complex assemblage of Gammaproteobacteria
dominated the clone libraries and accounted together for 81 to 88% of all post-plume clones. The
Planctomycetes, Bacteroidetes, Verrucomicrobia, Actinobacteria, Chloroflexi and
Gemmatimonadetes accounted for smaller proportions or remained undetected in some samples (Figure 8).
Not only dominant phylum-level lineages but also specific pelagic alpha- and
gammaproteobacterial lineages reappeared in post-spill clone libraries: the Arctic96BD-19 group of sulfur-oxidizing heterotrophs (Marshall & Morris, 2013) that is prevalent in stratified, oxygen-depleted conditions (Walsh et al. 2009); the SAR11 subclusters (Field et al., 1997); (Figure 11); the uncultured AGG47 cluster associated with marine snow (DeLong et al. 1993); the uncultured North Sea ZD0417 cluster (Stevens & Ulloa, 2008), and the uncultured SAR156 lineage
Figure 11. Distance phylogeny of SAR11 Alphaproteobacteria in the Gulf of Mexico water column, based on near-full length 16S rRNA genes. The subclusters SAR193, SAR203, SAE220, SAR241, SAR407, SAR464 were based on their published phylogenies (Field et al. 1997); the Ingenious Newfangled Group (ING) was defined here. 16S rRNA genes from the pre-spill water column sample (March 10, 2010) are labeled “prepre-spill”; plume water column samples (May 31, 2010) are labeled “Plumeprofile” followed by depth in meters. Post-spill samples (Sept 12, 2010; October 18, 2010, July 3, 2011) are labeled Postplume I, II and III, respectively. Each clone is identified by a 3-digit ID number; see Table 2 for corresponding Genbank numbers.
1.4.2. Pyrosequencing results for surface oil slick and plume-impacted water column. The pyrosequencing results for the weathered oil mixture at the surface from May 5, 2010, and the water column samples of May 31, 2010 were broadly consistent with the 16S rRNA gene clone libraries for the same samples (Figure 8), but in addition revealed bacterial populations that had remained undetected in the clone libraries (Table 4). In the surface sample, pyrosequencing representation for Cycloclasticus (>93%), Alteromonas (1.45%) and
Pseudoalteromonas (1.2%) resembled the clone library results, whereas Colwellia and
Halomonas were detected in smaller proportions. In contrast, the alkane-degrading DWH
Oceanospirillales accounted for near 90 and 70% of the pyrosequencing reads in the two deep plume samples of late May 2010 (Table 4).
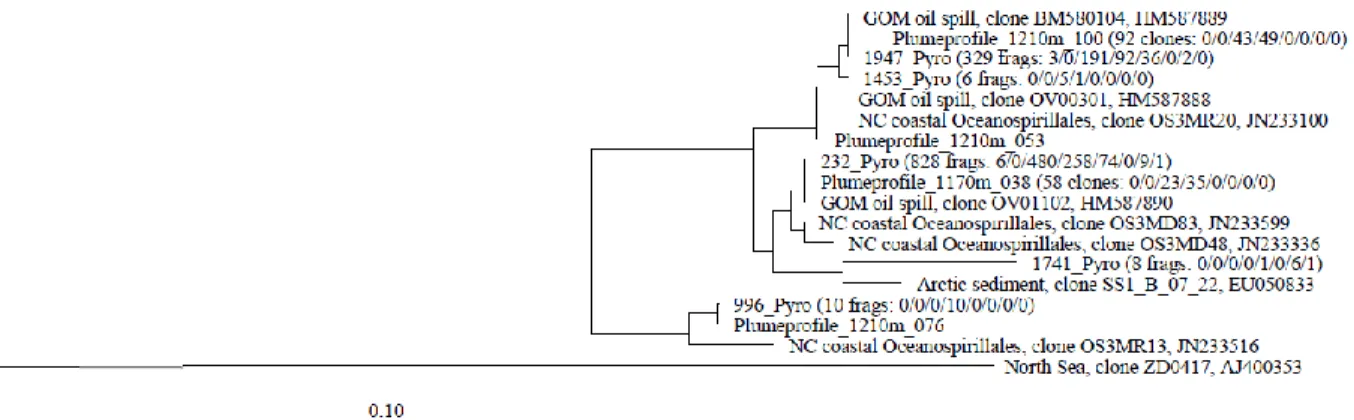
The DWH Oceanospirillales pyrosequencing reads were congruent with full-length 16S rRNA gene clones of DWH Oceanospirillales from the Gulf of Mexico (Redmond and Valentine 2012) and from the Atlantic Ocean offshore North Carolina (D’Ambrosio 2011), and formed at least three distinct phylogenetic clusters (Figure 12). The pyrosequencing survey also validated a diverse community of hydrocarbon-degrading bacteria in the plume profile that went largely undetected in the clone libraries (Table 4): The PAH-degrading genus Cycloclasticus remained variably detectable throughout the water column. Psychrophilic heterotrophs of the genus
plume. The alkane-degrading genera Oleiphilus and Oleispira were found in low abundances below and within the plume. The pyrosequencing representation of the uncultured
gammaproteobacterial groups (AGG47, Arctic96BD19, SUP05, ZD0417, SAR156) above and below the plume was strongly reduced within the plume (Table 4). A similar trend was observed for Alphaproteobacteria. While SAR11 bacteria accounted for a tenth of the pyrosequencing fragments above and below the plume, their representation decreased within the plume (Figure 8). In general, pyrosequencing analysis indicated a functionally and phylogenetically diversified alpha- and gammaproteobacterial community in the hydrocarbon plume; pre-spill populations of uncultured bacteria and oil-degrading bacteria remained detectable against the dominant plume populations of DWH Oceanospirillales. This result is compatible with a complex functional gene repertoire of plume microbial communities sampled at the same time (Lu et al. 2012).
Figure 12. Phylogeny of DWH Oceanospirillales based on 300 bp pyrosequencing fragments and corresponding sections of 16S rRNA gene clones, showing the phylogenetic fine structure of this cluster. The phylogeny was obtained with a mask excluded all sequence regions except
E.coli 16S rRNA gene positions 28-337, equivalent to the pyrosequencing fragment. The number of occurrence for each type of pyrosequencing fragment and 16S rRNA gene clone in the
1.4.3. Pyrosequencing results for post-plume water column.
The pyrosequencing results for the post-plume water column samples of September 12, 2010, and October 18, 2010, were broadly consistent with the corresponding 16S rRNA gene clone libraries (Figure 8), but revealed additional bacterial populations that had not been
observed in the clone libraries (Table 4). The DWH Oceanospirillales that had disappeared from the clone libraries remained detectable at low levels in the pyrosequencing dataset (up to 0.2% at 1200 m, Sept. 12 sample). Interestingly, the post-plume pyrosequencing datasets showed that oil-degrading bacteria persisted in the water column near the Macondo wellhead, although the deep hydrocarbon plume had been drifting in a southwesterly direction, and was no longer detectable in the wellhead region as indicated by CTD profiling in September 2010. Bacterial alkane degraders (Alcanivorax, Oleiphilus, Marinobacter) remained detectable in low proportions (<1%), and the PAH oxidizer Cycloclasticus and relatives of gammaproteobacterial
methylotrophs accounted for near 5 % of pyrosequencing reads in the 1210 m sample (Table 4). These results suggest local sources that re-inject reservoir populations of these bacteria into the water column, either from small-scale accidental leakage or natural hydrocarbon seepage (Joye et al. 2011b).
Most pyrosequencing fragments from the post-plume water column do not represent specialized oil degraders; these pyrosequencing results resemble (and extend) the diversified 16S rRNA gene clone library results for the same samples. Within the Gammaproteobacteria, the cultured genera Oceanobacterium, Oceanobacter, Oceanospirillum, Alteromonas,
Pseudoalteromonas, Halomonas, Idiomarina, Marinimicrobium, Congregibacter, were
ZD0417-related group, Stevens and Ulloa 2008). Within the Alphaproteobacteria, relatives of the genera
Oceanibaculum and Roseobacter, of the Rhizobiales, Rhodoplanes, Rhodospirillales,
Sphingomonadales, several uncultured clusters, and the SAR11 lineage (the latter in the 10 to 25% range) were found in all post-plume samples (Table 4). The Deltaproteobacteria
(dominated by SAR324) and the SAR406 lineage accounted for ca. 10 to 25% of the
pyrosequencing dataset, similar to their representation in the 16S rRNA clone libraries (Figure 8). A wide range of phylum-level lineages, the Acidobacteria, Actinobacteria, Bacteroidetes,
Chloroflexi, Cyanobacteria, Gemmatimonadetes, Planctomycetes, and Verrucomicrobia
accounted for approx. 0.5% to 5% of the pyrosequencing reads (Table 4), and appeared to a limited extent in the corresponding clone libraries (Figure 8). Other phylum-level lineages (Candidate Division OD1, Epsilonproteobacteria, Lentisphaerae) were barely detected in the pyrosequencing dataset, and were not observed in the clone libraries (Table 4).
1.4.4. Contrasting interpretations of the post-plume bacterial community.
The interpretation of bacterial communities in the water column of late summer 2010 remains contested. Bacterial 16S rRNA gene clone libraries from post-plume water column samples (Sept. 7 to 17, 2010) detected diverse Alpha- and Gammaproteobacteria, Flavobacteria,
Chloroflexi, and Planctomycetales (Kessler et al. 2011); the Gammaproteobacteria included
Cycloclasticus, members of the Oceanospirillales (not the DWH group), and members of the
Methylophilaceae, Methylococcaceae and the genus Methylophaga. The latter three lineages constitute a phylogenetic assemblage of C1-oxidizing marine bacteria; this assemblage was
-oxidizing bacteria suggested that methylotrophy was at least as likely (Joye et al., 2011b). The phylogenetic analysis of these clones and their closest matches reported here shows that they are not representatives of cultured methylotrophic and methanotrophic genera. Instead, they form two separate sister lineages to the methylo- and methanotrophic genera Methylobacterium,
Methylosarcina, Methylobacter, Methylomonas, and Methylosphaera, and to the separately branching, obligately methylotrophic genus Methylophaga (Figure 10). If these uncultured bacteria represent methylotrophs or methanotrophs, they would constitute new genera with potentially novel physiological properties.Assuming that these uncultured lineages represent C1
-oxidizing bacteria, the sampling campaign appears to have caught the last stages of a
methanotrophic bacterial bloom that pushed the methane concentrations to below typical Gulf of Mexico ambient levels at the time of sampling in September 2010 (Kessler et al. 2011).
However, alternative interpretations are possible. Transcriptomics studies that explored the impact of high molecular weight dissolved organic matter on microbial community structure and activity showed a selective enrichment of marine heterotrophs within the Gamma- and
Alphaproteobacteria (Alteromonas, Thalassobius) and gammaproteobacterial methylotrophs (Methylophaga) after a short incubation time (27h) under DOM-amendment (McCarren et al. 2010). These strains could be enriched in consequence of a DOM-degrading heterotrophic cascade that releases naturally abundant methylated sugars from DOM, and leads to the frequently observed high abundance of methylotrophic bacteria in clone libraries from DOM-rich coastal waters (McCarren et al. 2010). In this interpretation, the combined presence of DOM-degrading methylotrophic and heterotrophic Gammaproteobacteria and
at the sampling stations that yielded this bacterial signature (Kessler et al. 2011). The
methylotroph-related clones disappeared from the October 2010 clone library, but reappeared in July 2011 (Figures 1, 3). Methylotroph-related sequences remained detectable among the pyrosequencing reads in September and October 2010 (Table 4). Their continued occurrence near the Macondo wellhead and in other widely dispersed marine habitats (for a high-arctic example see Teske et al. 2011) may not be specifically linked to methanotrophy or
methylotrophy sustained by fossil hydrocarbons; seasonal phytoplankton blooms provide an alternative explanation that requires systematic investigation.
1.4.5. Natural Reservoirs of DWH Oceanospirillales.
The rapid enrichment of specific bacterial types associated with the deep hydrocarbon plume indicates the existence of easily accessible natural reservoirs or seed populations of these bacteria in the Gulf of Mexico. Identifying their natural reservoir is of particular interest toward a more complete understanding of their ecology and adaptability to a massive and prolonged input of oil. The DWH Oceanospirillales, for example, lacked closely related representatives in Genbank when first reported (Hazen et al., 2010). The closest relatives in GenBank (EU050833) were a clone from Arctic marine sediments (Tian et al., 2009) and cultured sister groups within the Gammaproteobacteria, including the hydrocarbon degraders Oleispira and Thalassolituus, and the genera Bermanella, Spongispira and Oceanoserpentilla (Hazen et al. 2010). While our pre- and post-plume 16S rRNA gene clone libraries did not contain any full-length DWH
Oceanospirillales clones, the DWH Oceanospirillales were detected by pyrosequencing in the post-plume samples (September and October 2010), indicating a low-level background
Unexpectedly, members of the DWH Oceanospirillales were found in bacterial 16S rRNA gene and rRNA transcript libraries from the Atlantic shelf break offshore North Carolina, sampled on December 4th, 2009 (D’Ambrosio, 2011), at a depth of 146 m in a distinct water mass known as the Subtropical Underwater (SUW) layer and distinguished by high salinity and warm temperature (Cleroux et al., 2009). They constituted a substantial proportion (around 20% to 25%) of all clone libraries from the SUW sample, regardless of whether these were derived from 16S rRNA genes or 16S rRNA transcripts of the particle-associated or free-living fraction (D'Ambrosio, 2011). The North Carolina Oceanospirillales 16S rRNA genes fell into the same phylogenetic clusters as the Oceanospirillales 16S rRNA genes and pyrosequencing fragments from the DWH oil spill (Figure 12). Since the North Carolina Oceanospirillales were sampled in December 2009, they do not originate from the DWH oil spill; yet they are members of the DHW Oceanospirillales cluster by phylogenetic affiliation. The conspicuous enrichment of DWH Oceanospirillales in the Subtropical Underwater layer might be the consequence of natural hydrocarbon seepage and hydrocarbon enrichment in this water layer in the southwest North Atlantic (Harvey et al., 1979, Requejo & Boehm, 1985). This North Atlantic population of DWH Oceanospirillales could be in constant exchange with the Gulf of Mexico, and might represent a seed population. More generally, the North Atlantic and the Gulf of Mexico
occurrences of this microbial group could be the result of local enrichments from a common and widely distributed low-abundance seed population.
1.5 Conclusions