1
ITS Help Desk Annual Report 2011
Contents
Executive Summary ... 1
Status of ITS Help Desk Priorities ... 1
Scope of the ITS Help Desk ... 2
Metrics ... 2
Service Levels ... 3
Number of Incidents Tracked... 3
First Call Resolution (FCR) Rate ... 4
Calls Received... 5
Average Speed to Answer (ASA) ... 6
Abandon Rate ... 7
60 Second SLA Compliance ... 8
Customer Service Index Score ... 9
Customer Kudos ... 9
ITS Help Desk Priorities for 2012... 10
Key Performance Indicators ... 10
Infrastructural Changes ... 10
Executive Summary
This report provides a summary of metrics describing the performance of the ITS Help Desk in 2011. Included are volume metrics, key performance indicators, customer feedback, and related commentary.
Status of ITS Help Desk Priorities
In April 2011 the ITS Help Desk began a realignment to rethink the organizational structure and support models at the ITS Help Desk from the ground up. This realignment consisted of:
• Improving the supervisor-to-employee ratio from 1:70 to 1:7.
• Reassigning the Help Desk Representative position to focus on faculty and staff customers, spending 50% of the time answering phone calls and 50% of the time working tickets and other projects.
2
• Reducing high-turnover student positions by 33% and refocusing student positions on providing core support for student customer issues.
• Assigning supervisory roles to Help Desk Specialists by making them responsible for a team of 6-7 student employees; this gives them the opportunity to gain supervisory experience.
• Dividing Help Desk management responsibilities into a core operations role and a quality control/assurance role.
• Improving Help Desk accountability by creating and enforcing an attendance policy and measuring employee metrics on a weekly basis.
• Creating a new training program based on established customer service models and shifting from a narrow, technology-based focus to a broad, customer service focus.
The immediate benefits of the realignment were realized during the Help Desk’s Fall Rush 2011. This is the period when new students and employees join the university. It is traditionally the busiest time of year for the Help Desk and generates the highest volume of contacts of the year. Compared with the traditionally slower Spring Rush 2011:
• The First Call Resolution (FCR) rate improved by 28.19%, from 49.57% to 77.76%.
• The Average Speed to Answer (ASA) improved by 132.8 seconds, from 186.2 to 53.4.
• The call abandon rate improved by 18.19%, from 27.31% to 9.12%.
• The compliance rate with our Service Level Agreement (SLA) to answer 75% of calls within 60 seconds improved by 26.03%, from 51.01% to 77.04%.
• Our Customer Service Index (CSI) score improved 5.87% from 4.49 (out of 5) to 4.77.
Scope of the ITS Help Desk
The University of Texas at Austin has an enrollment of approximately 51,000 students, a continuing education enrollment of 300,000 students, as well as 24,000 faculty and staff and approximately 450,000 alumni. In addition, over 5 million UT EIDs are in circulation and being used by university affiliates, contractors, job applicants, prospective students, library patrons, retirees, and various other populations who conduct business with the university. With the ITS Help Desk providing central support for the University of Texas Electronic Identifier (UT EID) and the UTmail electronic mail service, every one of those 5 million+ EIDs is a potential customer who may contact us for help.
Support for these customers is provided by 40 part-time student employees, 15 full-time employees, and 2 managers.
Metrics
In 2011, the ITS Help Desk answered:
• 59,638 trouble tickets
• 48,637 phone calls
3
Viewed another way, this accounts for 189 days, 17 hours, 15 minutes, and 27 seconds of continuous talk time with an average call lasting 5 minutes and 37 seconds.
Service Levels
In seeking to improve the ITS Help Desk, Key Performance Indicators (KPIs) were identified and measured to track the success of the Help Desk Realignment.
Number of Incidents Tracked
Figure 1: Number of Incidents
Figure 1: Number of Incidents shows the number of incidents recorded in the ITS Help Desk tracking system in 2011. When compared with the number of calls received in Figure 3: Total Calls, it is clear that there has been substantial improvement in employees tracking incidents since the April realignment.
0 1000 2000 3000 4000 5000 6000 7000 8000 9000
N
u
m
b
e
r
o
f
In
ci
d
e
n
ts
Month
4
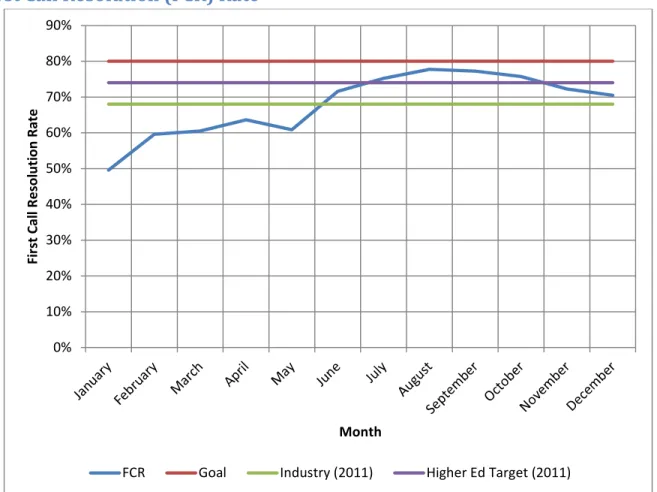
First Call Resolution (FCR) Rate
Figure 2: First Call Resolution (FCR) Rate
Figure 2: First Call Resolution (FCR) Rate captures the percentage of customer contacts that are resolved at without the customer needing to call or write back to the ITS Help Desk. This KPI is considered one of the most important customer satisfiers.
After the realignment in April, the FCR (which has historically held around 58%) improved to such an extent that the Help Desk beat the 2011 industry average as reported by the Help Desk Institute (HDI). During some of the busiest times of the academic year, the Help Desk also managed to surpass the HDI goal for higher education help desks.
The ITS Help Desk has an FCR goal of 80%.
0% 10% 20% 30% 40% 50% 60% 70% 80% 90%
F
ir
st
C
a
ll
R
e
so
lu
ti
o
n
R
a
te
Month
5
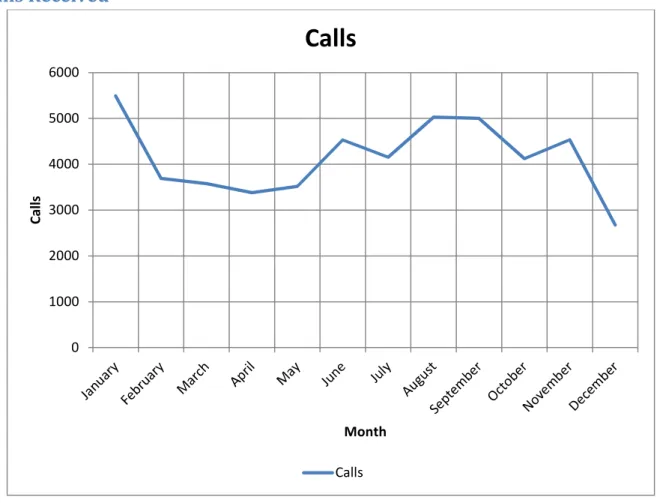
Calls Received
Figure 3: Total Calls
Figure 3: Total Calls illustrates the number of calls received on our Automated Call Distributer (ACD). The most telling metric is that call volume during fall rush (August – September 2011) is less than call volume during spring rush (January 2011). This unexpected drop can be attributed to increased and improved collaboration between the ITS Help Desk, the Division of Housing and Food Services, the Division of Student Affairs, and ITS Networking.
0 1000 2000 3000 4000 5000 6000
C
a
ll
s
Month
Calls
6
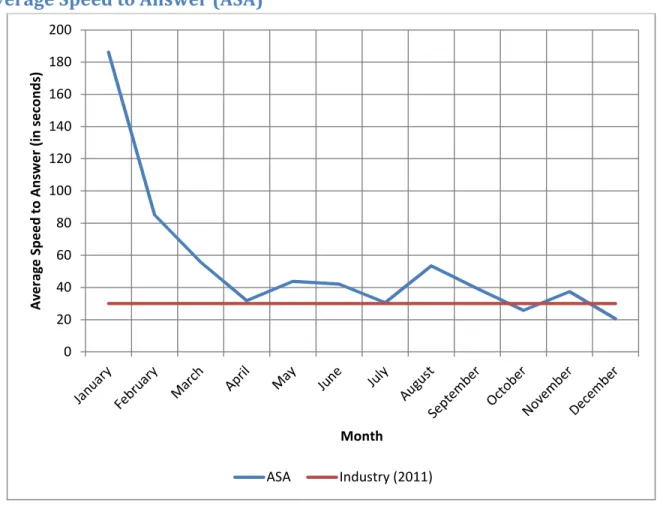
Average Speed to Answer (ASA)
Figure 4: Average Speed to Answer (ASA)
Figure 4: Average Speed to Answer (ASA) reflects, in seconds, the average time a customer must wait on hold in order to speak to a Help Desk consultant. During fall rush (August – September 2011), the busiest time of year for the Help Desk, the average wait time did not exceed 60 seconds.
Our target is to have an ASA of no greater than 30 seconds.
0 20 40 60 80 100 120 140 160 180 200
A
v
e
ra
g
e
S
p
e
e
d
t
o
A
n
sw
e
r
(i
n
s
e
co
n
d
s)
Month
7
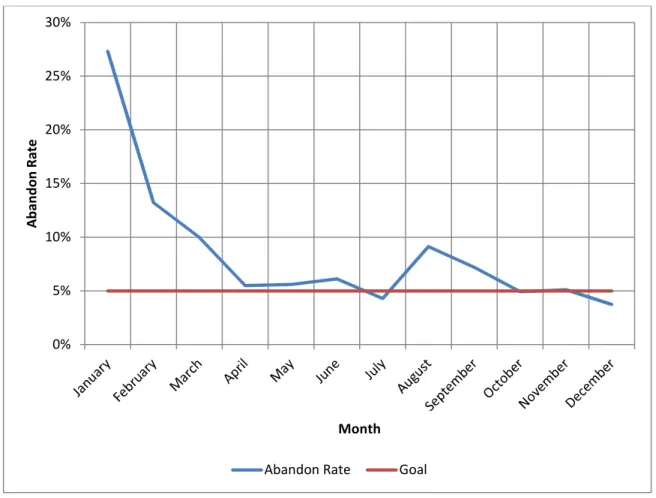
Abandon Rate
Figure 5: Abandon Rate
Figure 5: Abandon Rate shows the number of customers who decided they no longer wished to wait on hold and hung up before speaking to a Help Desk consultant.
Our target is to have no more than 5% of callers abandon their attempts to speak with us.
0% 5% 10% 15% 20% 25% 30%
A
b
a
n
d
o
n
R
a
te
Month
8
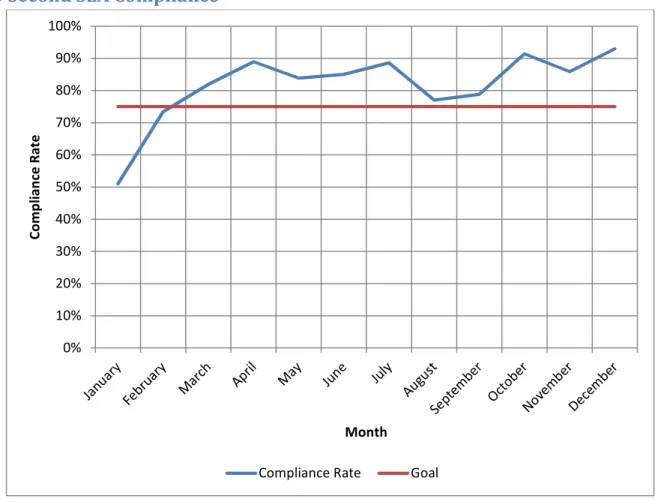
60 Second SLA Compliance
Figure 6: 60 Second SLA Compliance
The ITS Help Desk’s Service Level Agreement (SLA) states that we will answer 75% of our calls within 60 seconds. As Figure 6: 60 Second SLA Compliance illustrates, after the Help Desk realignment we were able to meet our SLA even during our busy fall rush.
0% 10% 20% 30% 40% 50% 60% 70% 80% 90% 100%
C
o
m
p
li
a
n
ce
R
a
te
Month
9
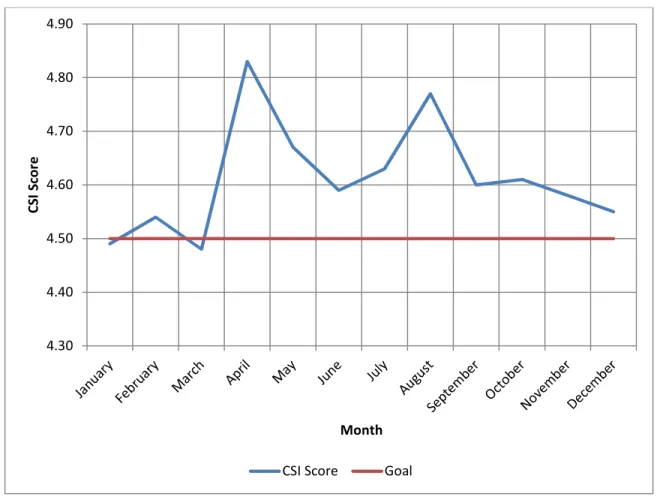
Customer Service Index Score
Figure 7: Customer Service Index (CSI) Score
After contacting the ITS Help Desk, customers receive a survey and are asked to rate their experience on a five-point scale. Our goal is to have an average CSI of 4.5 out of 5. As Figure 7: Customer Service Index (CSI) Score shows, prior to the realignment we were not consistently able to meet our goals. After the realignment, we have consistently exceeded our customer satisfaction goals.
Customer Kudos
Here are some highlights from customers regarding their experiences with the ITS Help Desk.
“I would highly doubt other than a Very Satisfied from clients regarding such an exemplary team as those who work for UT-ITS. They have never given anything other than accurate
professional polite answers thus leaving all of us out here comfortable with the knowledge they are there to help us.”
“Having worked in the corporate world I know the common IT experience of users and this was not common at all. Excellent service great description of what was needed handled respectfully professionally and expeditiously. Thank you”
4.30 4.40 4.50 4.60 4.70 4.80 4.90
C
S
I
S
co
re
Month
10
“He could not have been more helpful short of somehow being able to reach thru the phone with his hands to give me a scalp and shoulder massage a mani/pedi treatment and give both my Yorkies belly scratchies.”
“I have used this service as long as I have been a faculty member at UT (20 years). I can tell you that for someone who suffers from an acute case of ‘computer idiocy’ it has been a life-saver many times over. Thank you!”
ITS Help Desk Priorities for 2012
Much of 2011 consisted of taking a baseline measurement of key performance indicators, implementing foundational changes, and measuring the success of those changes against the performance indicators. Based on our progress in 2011, we have established goals for 2012 which we feel are aggressive yet attainable.
Key Performance Indicators
Metric 2011 Goal
Incidents 59,638 N/A
First Contact Resolution (FCR) Rate 69.93% 80%
Total Calls 48,637 N/A
Average Speed to Answer (ASA) 58.57 seconds 30 seconds
Abandon Rate 9.12% 5%
60 Second SLA Compliance Rate 80.27% 75%
Customer Service Index (CSI) Score 4.63 / 5 4.5 / 5
Our most aggressive goal for 2012 is reach a First Contact Resolution (FCR) Rate of 80%. According to the Help Desk Institute (HDI), in 2011 the average industry FCR was 68% and the target set by help desks in higher education was 74%. Research available online shows that the FCR is one of the most important customer-facing metrics because it represents a customer getting an issue resolved with a minimum amount of effort on their part. Anecdotally, FCR also benefits Information Technology Services (ITS) since resolving issues at the Help Desk frees up time for developers and system administrators to perform their core functions.
Our other major aggressive goal is an Average Speed to Answer (ASA) of 30 seconds. For us, it is telling that during fall rush 2011 our approximate ASA was 46 seconds, which was a dramatic drop from an ASA of 186 seconds during spring rush 2011. From a customer perspective, a lower ASA represents less time they have to wait on hold before speaking to a human being. A low ASA would also represent quicker call resolution times and would result in a lower abandon rate.
Infrastructural Changes
The Help Desk runs a Walk-In Service (WIS) where customers can speak with a consultant in person regarding their technical support needs. This service grew organically out of a need which came about in
11
the early 2000’s with a number of viruses with wide campus impact such as I Love You, Conflicker, and Netsky and the Microsoft RPC vulnerability. In 2012, the Help Desk is creating an opportunity to take a deliberate look at WIS reconceive it based on an evaluation of customer needs, available solutions, and similar services offered at peer institutions.
The Help Desk is also focusing on expanding a support model where full-time Help Desk staff act as internal service or product liaisons. Our goal is to expand this role to cover all full-time Help Desk staff and all ITS products and services. By creating and maintaining these relationships with our support partners, we hope to improve communications loops which will allow system and service managers to improve their products and allow the Help Desk to provide better customer service.
The Help Desk is also spearheading an effort to review, update, and maintain all of the Help and Support documentation on the ITS Web site. The goal is to transform the documentation in a way which better meet our customers’ needs and wants, while also working with our internal support partners to ensure the technical accuracy and timeliness of the available documentation.