*Correspondence to Author: Boying Lv
College of Hydraulic & Environmen-tal Engineering, China Three Gorg-es University, Yichang, 443002, China.
How to cite this article:
Boying Lv, Yishuai Tian, Botao Liu. Airport Taxi Dispatching Based on VISSIM and Multi-objective Programming Model. American Journal of Computer Sciences and Applications, 2020; 3:23
eSciPub LLC, Houston, TX USA. Website: https://escipub.com/
Boying Lv et al., AJCSA, 2020; 3:23
American Journal of Computer Sciences and Applications
(ISSN:2575-775X)
Research Article AJCSA (2020) 3:23
Airport Taxi Dispatching Based on VISSIM and Multi-objective
Programming Model
This paper solved the problem of how to manage the distribution of airport taxis and balance the revenue of long- and short-haul passenger taxis. In this research, we established a multi-objective programming model, which was solved using genetic algorithms to obtain a reasonable distribution scheme in airport
with the highest riding efficiency: set up a pick-up location in the middle of the pick-up area, requiring all cars to leave uniformly
when fully loaded, and release an average of 78 taxis per batch
in every single boarding location. In addition, with the queuing theory we set the basic parameters of the road. Taking the income balance difference as the objective function, we used the VISSIM software to simulate the simulation. Then the short-term “priority” arrangement plan was: Calculate the ratio of the travel time of the short-distance taxi to the distance from the airport to the city center. If the ratio is less than 0.0659, the taxis that meet the conditions are allowed to be given priority after return. The results have some guidance and strong
practical significance.
Keywords: VISSIM; Airport taxi; Genetic algorithm; Short-distance “priority”
Boying Lv1*, Yishuai Tian1, Botao Liu1
1College of Hydraulic & Environmental Engineering, China Three Gorges University, Yichang, 443002, China.
ABSTRACT
1. Introduction
The queuing of airport taxis has become one of the reasons that seriously affect airport conges-tion. How to manage airport taxis and balance the revenue of long- and short-haul passenger taxis is an important issue to improve the degree
of airport distribution [1,2]. The management
scheme of airport taxis must not only consider the efficiency of passenger collection and distri-bution, but also ensure that the waiting time of taxis cannot be too long. For taxis with long wait-ing times in the car pool and receivwait-ing short-dis-tance orders, compared to long-disshort-dis-tance order drivers, it will bring poor economic benefits, re-sulting in imbalances in long-distance and short-distance driver income [3].Therefore, it is very
important to design a ride plan in the passenger area and how to give a certain “priority” to short-haul passengers to and from the taxi to balance the revenue [4].
Predecessors have made many contributions to taxi scheduling issues and route optimization.
For example: Wei Zhang [5] and others used
ge-netic algorithms to obtain the maximum pay-ment ratio and cruising distance to ensure the interests of taxi passengers and drivers, thereby making bypass carpooling a reality. Zhaowei Qu
[6] and others based on the taxi GPS data and
combined the TSLM model to study the impact of the passenger's maximum acceptable
dis-tance on the TSLP. Babaei et al. [7] studied the
case of Zanjan city in Iran and established a lin-ear scale to obtain a function to reduce total travel time, total waiting time and taxi route op-timization. Kim [8] et al. studied the airport gates
and used algorithms such as tabu search to solve the problem of taxi congestion on the air-port ramp, resulting in delayed boarding, and made the circulation on the passenger terminal and ramp effective. Ma [9] et al. based on the
traditional taxi operation mode, applied genetic algorithms to solve the multi-objective optimized route model of taxi carpooling, and conducted a case study based on a 24-node network. Jiang
[10] used the IPSO and CPSO algorithms to
solve the problem of taxi dispatch at the airport, thereby reducing the waiting time of taxis during peak periods.
However, most of the existing literature only
solved the problem of airport route planning [11,
12] or the forecast of taxi numbers [13], and few
studies have been conducted on the number of taxis released in each batch and the specific lo-cations of the boarding lolo-cations. Therefore, this paper first established a multi-objective pro-gramming model based on reducing the conflict between people and vehicles, and maximizing efficiency and comfort. Then, we used genetic algorithm to solve the vehicle scheduling scheme. To provide a certain feasible solution for the airport taxi management department, we used the queuing theory model based on the definition of income balance, having taken the income balance difference as the objective function, and having used VISSIM software to simulate the simulation, formulate the priority rules for short-haul passenger taxis.
2. Model assumptions
(1) After the taxis carry passengers, they are re-leased in batches. Only when the last car leaves, the next batch of taxis and passengers can be introduced.
(2) Passengers travelling by taxi can board at most one person, and each car can only take one order at a time.
(3) Passengers arrive first in line and choose the vehicle closest to them
(4) Assuming that the taxi follows the traffic rules and order, no accidents occur while driving
patching Model
3.1How to ensure the safety of passengers
First of all, we considered how to ensure the safety of passengers and vehicles. There may be safety hazards such as pedestrian conges-tion and rear-end collisions when riding in the
airport waiting area. According to relevant
liter-ature[15], it can be known that the hidden safety
hazards of passengers getting on the bus were mainly the conflict between people and vehicles, that was, the situation where people and cars compete for roads, as shown in Fig.1.
Car Pool
Fig. 1 The Schematic diagram of traffic hazards in the airport waiting area
Combining the traffic safety formula[15], we can
know that in order to ensure the safety of vehi-cles and passengers, on the one hand, the num-ber of boarding positions needed to be limited, and the number of boarding positions was pro-portional to the number of collisions; on the other hand, passengers can be set to board the car from the end of the fleet, but it was neces-sary to comprehensively consider the riding ef-ficiency to determine the boarding position; it was also necessary to provide for departures in batches. After receiving guests, you cannot
leave immediately. You must wait for all passen-gers to board and leave together.
3.2 How to choose a pick-up location
In the case of ensuring the safety of passengers and vehicles, taking a boarding position as an example, comparing the boarding time of the boarding positions at different positions in order to obtain the boarding position with the shortest time and the highest efficiency. Set the number of taxis for each release to 2N. The three posi-tions of the boarding position were shown in Fig-ure 2, 3, and 4.
Airport taxi
Boarding place
Fig. 2 Boarding position is located in front of the boarding area
With reference to Fig.2, passengers board the vehicle from front to back. According to Hypoth-esis 3 of the model, passengers line up to take
the vehicle closest to them, then the time re-quired for all passengers to board the vehicle is
1
T
:(
)
1
2
N m n l
b
T
v
+ + +
=
Where: the interval between passengers is
l
,generally
l
=
1
m
, the length between the centersof two lanes is
b
, the interval between taxis isn
, and the average length of taxis ism
.Airport taxi
Boarding place
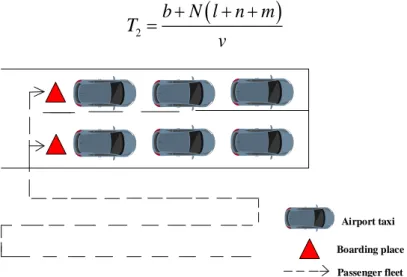
Passenger fleet Fig. 3 Boarding position is located in the middle of the boarding area
Combined with Fig.3, when passengers line up from the middle of the fleet to both sides, the time required for all passengers to get on the
train is
T
2.Its symbolic meaning is the same asthe above formula.
(
)
2
b N l n m
T
v
+
+ +
=
Airport taxi
Boarding place
Passenger fleet
Fig. 4 Boarding position is located in the middle of the boarding area
Combined with Fig.4, passengers queue up to get on the bus from the end of the queue, so the
time required for all passengers to get on the bus is
T
3, as follows:(
)
3
2
N m n l
b
T
v
By calculating the three bus times under the open position of the above three bus positions, and comparing the respective bus times, it can be concluded that the bus position with the shortest time and the highest efficiency is lo-cated in the middle section of the bus area.
3.3 Determination of objective function
Based on the opening of a best place to get on the bus, we continued to discuss how to arrange taxis to carry passengers to maximize efficiency. The management department hopes to arrange the maximum number of passengers to board the bus in the shortest time for each release. Therefore, two objective functions were set as
follows: maximization of boarding efficiency and minimization of travel distance.
Maximize the efficiency of taxi driver depar-ture
The time a taxi enters the area and waits for passengers to board is called boarding time. When all passengers are on board, the control-ler allows the taxi to leave the area. Only when the last car leaves can the next cabs and sengers be brought in. When the airport pas-sengers arrive at the peak, efficient departure can speed up the passenger transportation and improve the airport service quality. Therefore, the objective function is the shortest service time, and the formula is as follows:
(
1 2) (
)
min max t t, ,L ti,L ,tn i=1, 2,L ,N
Where:
i
represents thei
-th passenger whoneeds to take a taxi driver;
i
t
refers to the time from the boardingpo-sition of the
i
-th passenger to the boardingpo-sition.
Maximize passenger comfort
According to the assumption that the three
passengers take the nearest bus in line, and the last passenger walks the longest distance, in or-der to improve the service level of the "last sta-tion", the average travel path of each passenger at the bus station is reduced, and the comfort level of passengers is defined, taking the short-est average travel path as the objective function, as follows:
1
min
Ni l
l
N
=
Where:
i
l
represents the distance frompassen-ger
i
to taxi;N
is the total number of passengers.3.4 Determination of decision variables
The passenger serial number is
i i
(
=
1, 2,
L
,
N
)
,and the taxi number is
j j
(
=
1, 2,
L
,
N
)
. In combination with Fig.3, the taxi serial number increases from left to right from top to bottom. The relationship of variables belonging to 0-1 is as follows:1 Passenger chooses taxi
0,
ij
i j
S
else
=
,
Taxis will wait in the area until passengers get on the bus. The vehicle remained stationary while the passengers chose the taxi they wanted to take. Think of the passenger and the
(
)
(
)
2(
)
2 2
Near lane
1, 2, , ; 1, 2, ,
Far lane
ij
il j n m
v
t i N j N
il j n m b
v + + = = = + + + L L Where: ij
t represents the time taken by the
i
-thpassenger to board the
j
-th taxi longitudinalto the boarding position.
Generally,
m
=
4
,n
=
5
,b
=
0.3
,l
=
1
, inmeters.
According to hypothesis 2, each passenger tak-ing a taxi can get on one car at most, and each car can only take one order at a time. In other words, the constraint conditions between peo-ple and cars are as follows:
(
)
1
1
1, 2,
,
N
ij i
S
j
N
=
=
=
L
(
)
1
1 1, 2, ,
N
ij j
S i N
=
= =
LTherefore, multiple objective functions, corre-sponding constraint conditions and decision variables were determined, and a
human-vehicle arrangement model based on objective programming was established, which is as fol-lows:
(
1 2) (
)
1
min max , , , , 1, 2, ,
Objective function min i N N i l
t t t t i N
l N = =
L L L
(
)
(
)
(
)
(
)
1 1 2 2 21 1, 2, ,
1 1, 2, ,
near lane . .
far lane
1 Passenger chooses taxi
0, N ij i N ij i ij ij
S i N
S j N
il j n m
s t
v t
il j n m b
v i j S else = = = = = = + + = + + + =
, L L4.Priority scheduling scheme based on VISSIM simulation
4.1 Income equilibrium
Take the taxi queue in the airport storage pool as the timing moment, and define the taxi's profit
rate
as the ratio of the taxi revenue to theurban area from this moment
q
m to the urbanarrival time
t
m ratio. The income equilibriumdegree was the difference between the two de-parture rates of short-distance taxi and long-dis-tance taxi. It was required that the income of the two taxis be as balanced as possible, that was, there must be a minimum of the income balance.
1 2 1 2
min {
m m}
m m
q
q
Therefore, the question turned into how to
de-fine the short return time
t
, that was, the timerequired for a taxi to return to the airport. Con-sidering the diversity of the situation in airports across the country, if you collect existing actual data or only consider the impact of short-haul definition time, you cannot get general rules, so VISSIM simulation was used.
4.2 VISSIM Simulation Based on Queuing Theory
Because the distance
l
m from the airport to thecity center was different, the management de-partment should also considered the distance from the airport to the city center in a short
distance, so these two factors were used as nu-merical simulation variables. We used VISSM to simulate a large number of different values of short-distance time and the distance of taxis to the urban area. After outputting time parameters, we calculated the balance of different situations. Taxi queuing can be regarded as a single-point
queuing method [15]. Taxi is used as the
re-search object. Only when one car leaves the queuing system can the next taxi be accepted for service. The applicable model for this layout is the M/M/1 queuing model with a negative ex-ponential distribution of taxi arrival mode [16], and the probability density of the time interval
T
for the arrival is given by:0 ( ) 0 0 t T e t f t t − = Observe the service status of the queuing sys-tem, which can be divided into busy periods, idle
periods and off periods. Define the busy rate
to describe the busyness of the system, the ex-pression is as follows:
C
=
Among them,
C
is the number of serviceplat-form settings,
is the average taxi arrival rate,
is the number of taxis leaving the system perunit time and is defined as the average service rate.
4.3Queuing model
Establish an airport taxi queuing model based on the relevant theories of queuing theory. [16]
When the system is in a busy period and the in-put-output rate reaches a relatively stable state,
the average queue length
L
s and average staytime
W
s of the taxis in the system are used asthe main output parameters of the queuing sys-tem. The corresponding expressions are as fol-lows:
( )
1
sE L
=
−
(
)
(
)
sE W
=
−
In summary, the final model was expressed as follows:
1 2 1 2
min {
m m}
m m
q
q
t
−
t
. .
a b
m s s
m m m
a m b
t t t
t W t
s t
q t v
l l l
= + =
search interval that the airport is away from the
city center,
is the average revenue perkilo-meter of the local taxi,
v
m is the average speedof the taxi, and
t
sis the time to return to the city center after finishing the line.5. Model solving and result analysis 5.1 Airport Taxi Ride Dispatching Model
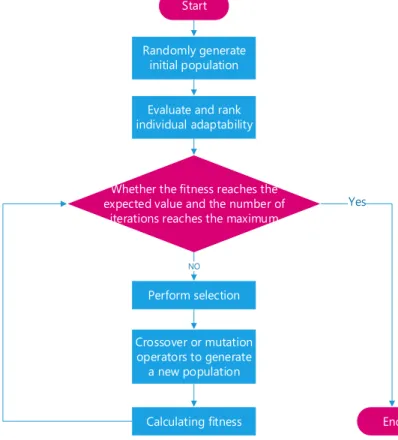
The solution was solved by genetic algorithm [14],
and the algorithm flow chart was shown in Fig.5.
Set population size
N
=
50
, mutation probability0.1
n
P
=
, iteration times 1000.Taking 1 car asthe step length, the time and the shortest aver-age path needed for 50~100 cars to enter the bus group were calculated respectively. The variation results of the shortest walking distance, total ride efficiency and number of released taxis are plotted in figure 6 and 7. We can get the total efficiency of different taxis under different re-lease conditions. Therefore, the dispatching of airport taxis can meet the requirement of releas-ing 78 taxis at a time, which can achieve the maximum efficiency of 0.59 and the shortest dis-tance on foot for passengers was 117.9 meters.
Start
End Randomly generate
initial population
Evaluate and rank individual adaptability
Whether the fitness reaches the expected value and the number of
iterations reaches the maximum
Perform selection
Crossover or mutation operators to generate
a new population
Calculating fitness
NO
Yes
Fig. 6 Number of vehicles released and walking distance per
Fig. 7 Number of vehicles released and ride efficiency capita
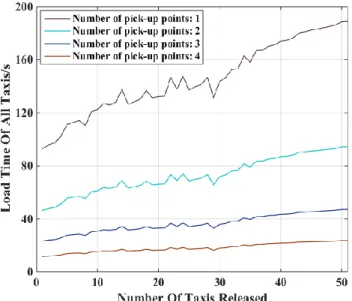
To promote a single boarding location to more than one boarding location. The boarding posi-tion was open in the middle of the road in the bus area to maximize the efficiency of the bus, so the location of the boarding position has been determined. By changing the number of bus places, the bus time under the condition of different number of bus places was obtained, and was drawn in Fig.8.The analysis shows that the number of different boarding positions changed, making the number of taxi release
doubled, but the total efficiency would not change.
Based on the comprehensive analysis, although the more the number of boarding positions, the shorter the load time was, the more the number of boarding positions will make the manage-ment cost too high. The specific number of boarding positions should be determined by tak-ing the airport management cost into consider-ation.
Fig. 8 Time-consuming taxis with different numbers of pick-up points
5.2 Priority scheduling scheme based on VISSIM simulation
Simulation parameter design
[17], input parameters required by the airport taxi
queuing theory model were obtained. Basic pa-rameters of the road surface, such as road width,
were set according to the actual situation, as shown in table 1.
Table 1 Parameter setting of simulation system
types of the parameter size types of the parameter size
Vehicle speed/m s −1 8 Passenger entry clearance time /s 35
Parking space/m 1.5 Average clearance time at taxi entrance /s 90
Pedestrian walking speed 1
/m s − 1.2 The road width /m 3.5
Average flow rate at taxi entrance/car 15 Average yield per kilometer
/ yuan 3 The average taxi departure timein the pickup area/s 30 Number of main and parallel lanes 3
Simulation scheme design
Based on the necessary parameters of road ve-hicles obtained from the above model, VISSIM simulation was used to analyze the basic situa-tion of road traffic and made reasonable
adjustments [18], so as to obtain the schematic
diagram of road design from the airport to the urban area and the simulation of taxi waiting for passengers in the airport bus area, as shown in figure 9 and 10 respectively.
Fig.1 Traffic simulation from airport to urban area
Fig.3 Simulation of overall effect
The short-distance definition time and distance from the urban area were changed with steps of 0.01 and 0.1 respectively, and VISSIM simula-tion solusimula-tion method [19] was used to calculate
the parameter values in the model under each data, and then the equilibrium degree of the
objective function was calculated. The relation-ship between the equilibrium degree and the short-distance definition time and the distance from the airport to the urban area was drawn as Fig.12.
Fig.4 3D map of simulation short distance defining time, distance from urban area and balance
If we want to make the revenue of long-distance taxi and short-distance taxi as far as possible, we can analyze the specific situation of the re-gion. Therefore, the general rule can be drawn as follows: when the ratio between the short-dis-tance defined time allowed by the management department and the distance from the local
airport to the city center is less than 0.0659, short-distance taxis meeting the above condi-tions can be allowed to be released in priority.
6. Advantages of the model
1) The safety of passengers and vehicles
scheduling scheme, and the location of the boarding position was discussed, which was seldom discussed in the pre-vious literature.
2) The multi-objective programming mod-
el further extended and applied the quantity change of vehicle position to make the result more profound.
3) VISSIM was used to simulate the roads
around the airport, effectively solving the problem of lack of data, and the method was innovative.
7. Shortcomings of the model
1) Genetic algorithm was used to solve
model 1, and the approximate solution of the global optimal solution was taken as the optimal solution of the model
2) In this paper, when constructing
VIS-SIM software for simulation, many pa-rameters were calibrated under ideal conditions, so there were certain sub-jective factors, and the conclusion would be deviated from the actual situ-ation.
8. Promotion of the model
The model established in this paper was con-sistent with the actual situation, which had cer-tain guidance and strong practical significance. The airport taxi ride scheduling problem in-volved the efficiency of road traffic, congestion, human-vehicle conflict and other issues, which can be used to improve the ride efficiency. In ad-dition, the vissim-based simulated taxi traffic and priority scheme can be applied by relevant management departments, which helps to en-courage short-distance passenger drivers to commute to and from the airport and the city, and promotes the airport to collect and disperse passengers.
9. Conclusion
This paper used a linear programming model and genetic algorithm to solve the problem of airport setting "boarding position", taxi and pas-senger arrangement. Through VISSIM simula-tion, a method for balancing the benefits of some short-distance taxis and long-distance taxis was obtained. We can know that each time 78 taxis were released and they all left when the bus was fully loaded. The shortest time was 131s, the average shortest path was 117m, and the best scheduling scheme under the condition of multiple boarding points was promoted. If the ratio of the distance from the city center to the distance from the local airport is less than 0.0659, the taxi will meet Condition given priority.
References
1. Xin Li. Perspective of government and
socie-ty's positioning in China's social management
from taxi management [D]. East China
univer-sity of political science and law,2013.
2. Xu Wang. Research on the design of vehicle
parking facilities at large airports in China [D]. Xi
'an university of architecture and technology,20
15.
3. Chao Yan, research on land side public
trans-portation management of Shanghai hub
air-port,2015, east China normal university.
4. Zhihong Hu et al., construction and
implemen-tation of intelligent matching management
sys-tem for large transportation hub taxis.
Innova-tion world weekly,2019(07): 90-95.
5. Zhang, W., et al., Research on Taxi Pricing
Model and Optimization for Carpooling Detour
Problem. JOURNAL OF ADVANCED
TRANS-PORTATION, 2019(3867874).
6. Qu, Z., et al., Location Optimization for Urban
Taxi Stands Based on Taxi GPS Trajectory Big
Data. IEEE ACCESS, 2019. 7: p. 62273-62283.
7. Babaei, M., et al., Fixed-route taxi system: route
problems. JOURNAL OF ADVANCED
TRANS-PORTATION, 2016. 50(6): p. 1252-1271.
8. Kim, S.H., E. Feron and J. Clarke, Gate
Assign-ment to Minimize Passenger Transit Time and
Aircraft Taxi Time. JOURNAL OF GUIDANCE
CONTROL AND DYNAMICS, 2013. 36(2): p.
467-475.
9. Ma, C., R. He and W. Zhang, Path optimization
of taxi carpooling. PLOS ONE, 2018.13(e02032
218).
10. Jiang, Z., C. Zhang and Y. Xia, Travel Time
Pre-diction Model for Urban Road Network based on
Multi-source Data. Procedia - Social and
Behav-ioral Sciences, 2014. 138.
11. Babaei, M., et al., Fixed-route taxi system: route
network design and fleet size minimization
prob-lems. JOURNAL OF ADVANCED
TRANSPOR-TATION, 2016. 50(6): p. 1252-1271.
12. Air Transport Management; New Air Transport
Management Data Have Been Reported by
In-vestigators at Polytechnic University
(Forecast-ing of taxi times: The case of Barcelona-El Prat
airport). Journal of Transportation, 2016.
13. Ibanez, L.C. and A.G. Marin, Taxi planning:
Branch and price decomposition.
PROCEED-INGS OF THE INSTITUTION OF
MECHANI-CAL ENGINEERS PART G-JOURNAL OF AE-
ROSPACE ENGINEERING, 2019. 233(9): p.
3395-3407.
14. Jiang, Y., Z. Liao and H. Zhang, A Collaborative
Optimization Model for Ground Taxi Based on
Aircraft Priority. MATHEMATICAL PROBLEMS
IN ENGINEERING, 2013(854364).
15. Zhonghua Wei, wang Lin, qiu shi. Service desk
optimization of taxi pick-up area in hub based
on queuing theory [J]. Highway traffic science
and technology: applied technology edition, 201
7,13(10):298-300
16. Jian Sun. Modeling and simulation of passenger
service resources on land side of aviation hub
based on queuing theory [D]. China university of
mining and technology (Beijing),2017.
17. Zhongbo Geng, song guo-hua, zhao qi, gao
yong, wan tao, xin ran. A comparative study on
the pickup scheme of Beijing capital airport taxi
based on VISSIM [J]. Journal of civil aviation
university of China,2013,31(06):55-59.
18. Chenyu Hao. Analysis and research on the
run-ning state of urban road traffic based on VISSIM
simulation technology [D]. Xinjiang agricultural
university,2014.
19. Zhengquan Xie. Application research of
real-time data traffic simulation technology based on