Hungarian Association of Agricultural Informatics European Federation for Information Technology in Agriculture, Food and the Environment
Journal of Agricultural Informatics. Vol. 7, No. 2 journal.magisz.org
Sustainable system design for gridded, spatio-temporal, agroecosystem
forecasting models
Paul Roehsner1, Kathleen M. Baker2
I N F O
Received 21 Jan. 2016 Accepted 13 Jun. 2016 Available on-line 15 Aug. 2016 Responsible Editor: M. Herdon Keywords:
decision support, database management, GIS, plant pathology, microclimate.
A B S T R A C T
Decision support systems able to capitalize on publicly available high resolution datasets have become increasingly valuable to agroecosystem, hydrologic and urban system stakeholders. In this paper we address the common agroecosystem modeling problem of weather-based risk forecasting. We compare storage system designs for an expandable crop disease forecasting system that relies on multiple gridded weather forecast inputs to artificial neural network disease risk models. A traditional relational database management system (PostgreSQL), a NoSQL database system (MongoDB) and a scientific file format version (netCDF) of a single crop disease risk modeling system in one region of the country, for potato late blight in the US Great Lakes region, were designed and compared for speed. To test expandability, another crop disease risk modeling system, for modeling the risk of economically significant deoxynivalenol (eDON) accumulation due to Fusarium head blight of barley in the northern US Great Plains, was also created in the three formats. Speeds for the three types of systems were fairly similar. Expandability, which is becoming highly desirable in agroecosystem model design, differed based on designer’s priorities.
1. Introduction
Gridded datasets offered by the US National Weather Service (NWS) have increased in accuracy through time (Myrick & Horel, 2006). In many cases new National Digital Forecast Database (NDFD) grids are higher quality than previous forecast model output statistics available for the same point locations (Ruth et al., 2009). Decision support systems able to incorporate these and future publicly available high resolution datasets have the potential to increase the accuracy of risk prediction for a variety of agroecosystem, hydrologic and urban system applications. However, the task of designing a system that is efficient, expandable and sustainable is not trivial. Along with increases in accuracy, advances in resolution and format of public data sources in recent years have necessitated nearly constant updates of modeling efforts originally designed to produce fairly stable end-user products. Especially in the realm of weather-based models, stakeholder awareness of uncertainty in the system and scientific advances is high. Modelers and stakeholders struggle to balance the benefits of advancing decision support systems with the costs associated with retooling systems whose funding cycles are complete. Research on management systems for spatially referenced data in general have found that no single solution addresses the many issues presented by big data that is geospatial (Amirian et al., 2014). We address this issue by focusing on one particular type of geospatial problem. We consider system designs that will be sustainable long term in relation to the speed of processing data and updating model parameters and offering expandability to a suite of similar application models
1 Paul Roehsner
Western Michigan University [email protected]
2 Kathleen M. Baker
in multiple regions of various sizes. In this paper we address the common agroecosystem modeling problem of weather-based risk forecasting.
During the last few years NDFD has democratized access to high resolution weather forecast for the US and revolutionized decision support systems in a number of fields. With regard to plant pathology, the NDFD datasets have being used in models that track soybean rust in Minnesota (Tao et al., 2009) and strawberry fruit rot in Florida (Pavan et al., 2011). Prior to 2014, NDFD operational forecasts were available at 5.0 km resolution for the continental United States (CONUS domain). In 2014 issuing of gridded NDFD data at 2.5km moved from experimental to operational status. Examples of decision support systems using this data newly available at a higher spatial resolution include BlightPro for potato and tomato late blight management in New York (Small et al., 2015).
While single crop forecasting systems are the norm and have a widespread stakeholder use, many agroecosystem models rely on similar weather-based inputs. Expandable systems that incorporate multiple commodity groups and regions have the potential to optimize development cost for high numbers of stakeholders. Similar expandable systems would have widespread applicability to many of today’s global, interdisciplinary problems. As higher spatial resolution data becomes available a crop disease forecasting system should be able to quickly assess application of that data, with a goal of possibly improving accuracy at a local level. We compared sustainable storage system designs for an expandable crop disease forecasting system that relies on multiple gridded weather forecast inputs to artificial neural network disease risk models. Three versions, including a traditional relational database management system, a NoSQL database system and a scientific file format version (netCDF), of a single crop disease risk modeling system were designed. The model was trained on four growing seasons of hourly inputs from the NDFD as a speed test. Each system was then expanded to include a second crop disease risk model which required different spatio-temporal hourly input ranges in a different region of the country. Both speed and expandability of each system as tested by the two risk forecasting models are compared. PostgreSQL, MongoDB, and netCDF storage technologies were chosen as representative of RDBMS, NoSQL and scientific data format respectively.
2. Methods
2.1. Specifications for System Comparison
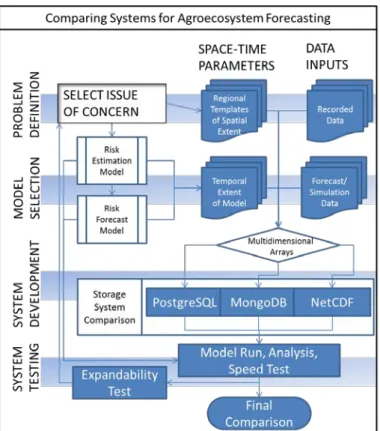
Both speed and expandability are important when comparing agroecosystem forecasting systems (Figure 1). During problem definition, spatial and temporal parameters, as well as risk estimation and forecasting models developed for a particular problem, determine the size of the multidimensional array of pertinent data inputs. In the specific crop disease risk forecasting example detailed in this paper, the storage system is emphasized for comparison of speed and expandability. PostgreSQL, MongoDB, and netCDF storage technologies were compared during system development and testing for two different artificial neural network based crop disease forecasting models with different regional spatial scales. Gridded forecasts were accessed from the NWS NDFD dataset in 5km spatial resolution. The logical data structure, optimizations, and a general access pattern for each of the technologies varied.
pre-compiled. Despite this shortcoming, significant gains in speed can be made in a scientific computing environment through the use of high performance linear algebra routines available through the use of the Numpy package in Python (Oliphant 2006). The Numpy package is able to process multidimensional array data quickly.
2.2. Storage Systems
Relational database management systems (RDBMS) have long been used to store geographic information. In this format, spatial and scientific data are usually retrofitted for table schemas originally designed to hold financial, commercial and organizational types of non-spatial data. Even with necessary retrofitting RDBMS storage and querying speeds have increased in recent decades. Underlying data models in GIS often make use of RDBMS systems (Goodchild 1992). Microsoft SQL Server running as the background RDBMS along with ArcSDE can provide access to data from within ArcGIS, as evidenced by ArcHydro applications (Chesnaux et. al., 2011; Strassberg et al., 2011). Although most end-user applications incorporate NDFD data in dimensionally large spatio-temporal formats, the data are distributed in gridded binary (GRIB) format which is not directly portable to most common commercial geographic information systems. This can increase development overhead, but also frees system design from GIS RDBMS standard. Recently, there has also been a push in the big data computing environment against standard relational tables applied uniformly to all data storage problems (Stonebraker & Cetintemel, 2005). The large volumes of data stored and served to the Internet have made apparent certain weaknesses in RDBMS, including limits to horizontal expansion and a distinct per transaction slowdown involved with the overhead of quality assurance.
The data structure as designed in PostgreSQL includes tables holding forecasting, validation, and derived gridded data along with various metadata. Forecasting and validation are stored in two-dimensional arrays in the size of the national grid within the records of appropriate tables. PostgreSQL tables are dynamically linked to ArcSDE (ESRI, 2013) to support the management of the spatial properties of individual cells making up the grids. This relationship also enables display of spatial records in ArcGIS 10.1 (ESRI, 2013a) without the need to design specific programming tools to facilitate GIS capabilities. PostgreSQL optimizations include record indexing for each table by fields that would reduce lookup times. B+-tree indexes which speed up range queries, such as those necessary for querying forecasting time ranges, are also used.
Figure 1.Storage system choice is an integral part of the agroecosystem forecasting process. Speed and expandability tests use multidimensional arrays in each system as
dictated by the problem definition.
All documents related to a single growing season are stored within a single collection and that
collection’s sub-collections, stemming in a hierarchy from the root collection, store national forecasting and validation grids or regional derived model output grids. The advantage of documents stored is the flexibility in overall design. To test this advantage, two versions of the system using MongoDB were created. In both versions validation documents contain a multidimensional array of values for twenty-four hours of one variable with a UTC date stamp. The versions differ in the way forecasting values are grouped together. In version A, all forecasting data made available at the same reference time for a variable are stacked and stored together. Typically, each document in this version contains approximately 157 hours of forecast grids, including missing data hours within the stack to be filled in later using interpolation. In version B, single two-dimensional grid slices are stored in individual documents, as opposed to the three dimensional stacks stored in version A. Forecasts were stacked in version A because crop disease risk forecasting models typically use weather forecasting variables with identical reference times. To chunk data by reference times means that all the forecasting data relating to a single variable can be retrieved in a single data lookup. A reduction in lookups and chunk accesses should greatly reduce retrieval times during model runs.
In our implementation of a netCDF based system, each growing season is contained within one file. National grids are separated from regional model outputs which are further subdivided by crop disease model. Forecasting and validation data are logically separated throughout, although this introduces very small amounts of redundancy in stored index values. Any branch in the netCDF file containing gridded data also contains x/y grid dimension indexes that can be used to create shapefile and raster versions of the data, as well as feed spatially auto-correlated regression tools or kernel-based transformation functions. Chunking and data compression were both optimized in the netCDF system. The chunking parameter sets minimum multidimensional blocks of values physically stored sequentially together in the storage medium.
2.3. Agroecosystem Forecasting Models
Three sets of speed tests varied by disk technology were performed for two different crop disease forecasting models generating daily predictions for four growing seasons, May-September from 2009 to 2012. Initial state of the hardware were the same with the computer booted and, in the case of PostgreSQL and MongoDB servers, were started an hour prior to the trial so that any indexes to be loaded. Qualitatively the amount of time resources needed and general ease of expanding the systems to include forecasting for a second model after the first crop model was complete were also considered. Adding the second model involved adding an additional spatial region to the system, coding to integrate the new disease risk model with the system, and creating links to the libraries used to access stored data.
Potato late blight risk in Michigan and risk of economically significant deoxynivalenol (eDON) accumulation due to Fusarium head blight of barley in the Northern Great Plains were chosen as crop disease test models so that comparisons could be made between the configuration requirements of
different microclimate-based models (Figure 2). Potato late blight (Phytophthora infestans) affects
foliage and tubers and is the most limiting factor to profitable potato production in the US (Guenthner et al., 2001). Michigan State University (MSU) has been using a modified Wallin-type model for making management recommendations to growers in Michigan since 1999 (Baker et al., 2000). For this study, an artificial neural network modified Wallin model was adapted for use with hourly temperature and relative humidity data during the May-to-September growing seasons. Binning of hourly relative humidity is partitioned by three hourly temperature ranges with hourly accumulation in that bin if the relative humidity at a location is over eighty percent. Based on the amount of accumulated hours in a bin a total risk is assigned per location (Baker and Kirk 2007; Baker, Lake, Roehsner, et al. 2012). Fusarium head blight (FHB), caused by the fungus Gibberella zeae (anamorph: Fusarium graminearum), is a major disease of wheat and barley, especially in the Northern Great Plains (DeWolf & Lipps, 2003). FHB is known to produce mycotoxins, in particular deoxynivalenol (DON), which is harmful to animals and humans if consumed in high concentrations (Aakre, 2005). Bondalapati et al. (2012) published a model to estimate the probability of economically-significant deoxynivalenol (eDON) accumulation in spring malting barley cultivars based on temperature and wetness duration. For this analysis, the time considered is not restricted to the barley heading window, in order to allow for comparability with Michigan results.
3. Results
The PostgreSQL system, using the oldest and most mature technology, was comparable in speed to the other systems. Partly because of PostgreSQL’s age, the Python libraries created to access server data are efficient and backed by fast C++ libraries with accessible Python code calling those C++ libraries. In the first speed test, PostgreSQL was nearly as fast as the two top performing systems on the spindle drive. In the second speed test, using a model with larger space and time boundaries, and requiring more data retrieval, PostgreSQL was the fastest method when using a spindle drive. Despite database management overhead, the PostgreSQL system also resulted in the fastest overall time for this second test, albeit nearly identical to the netCDF system, when two SSDs were used. This is likely because of the storage of single slices prevents the need for retrieving hours with missing data. Missing hour data is loaded in the case of the netCDF and the MongoDB version A system, but not the MongoDB version B system. PostgreSQL also does not require the conversion into Python objects the MongoDB system does. In neither test did PostgreSQL benefit significantly from the use of SSD drives.
Two MongoDB systems were constructed to illustrate access speed differences with respect to model runs with different spatio-temporal data needs. The worst performing storage solution in processing the potato late blight model was version A of a system using MongoDB. Relatively fast access of data through the MongoDB server and the fast decompression library could not overcome the large data load required for each modeling day. Loading the 157 hours stacks of forecasting data, when only a 28-hour subset was required, proved unwieldy in this first speed test. Low performance may also have been due to the PyMongo driver’s requirement to turn MongoDB documents into Python dictionaries internally upon data access. Conversion of the decompressed text to an array also took time. Neither of these steps was necessary in the netCDF or PostgreSQL systems. Despite being the slowest for the potato head blight model version A of MongoDB system was more successful in running the head blight of barley model which required a much larger data set as inputs. In speed it was second to only the PostgreSQL system on the spindle drive.
Version B of the system using MongoDB was fastest for the potato late blight model when using a traditional spindle hard drive. In this version, slices of forecast data are stored as hourly slices instead of as stacked arrays and only nine hours are loaded at a time. The time recorded for this version on the single SSD drive was unusual, as SSD drives should be faster than spindle drives in most cases. However, it is possible that the PyMongo driver connection is overwhelmed with the amount of data throughput. On further examination, slowdown would occur after roughly the fortieth day of a growing season after multiple successive accesses through a single Python GridFS object. To fix this issue, successive access was set up to use random GridFS objects from a created pool, giving other GridFS objects time to clear their buffers, but this did not entirely fix the problem. When running the head blight of barley model the MongoDB version B systems suffered from slowdown because of the large number of single hours of forecasting data that were loaded.
Figure 2. Modeling regions for the Fusarium head blight of barley DON risk forecast accumulation model and late blight of potato risk forecast model. Production values from the 2007 U.S. Census of Agriculture for the crop of interest are shown in the respective region.
Table 1. Time required to run models forecasting daily risk to crops over
two US cropping regions.Times are in decimal minutes.
Storage Type Spindle Drive Single SSD Two SSD
Michigan N. Plains Michigan N. Plains Michigan N. Plains
PostgreSQL 43.68 156.98 41.64 155.67 41.38 153.85
MongoDB(vA) 82.14 165.75 75.64 160.70 74.67 159.88
MongoDB(vB) 42.08 169.40 42.32 174.40 40.09 170.46
NetCDF 43.06 193.97 31.78 154.43 30.38 153.87
and non-sequential data is accessed as fast as sequential data. Gains are reduced when a second SSD drive is added as the traditional read head factor had been eliminated on use of the single SSD drive.
4. Discussion
Inherent capabilities of scientific data files, including internal descriptive attributes, tagging of data and speed of retrieval of data subsets, make these formats popular for data storage and processing methodologies. However, in examining models with varying spatio-temporal data requirements in an expandable agroecosystem forecasting system, netCDF scientific data format was not always the easiest or fastest solution. When using default chunk sizes, netCDF systems consistently outperformed other technologies only when using an SSD drive. The PostgreSQL system was most successful when using the large spatio-temporal data chunks involved in the head blight of barley forecasting model on the SSD drive.
Speeds for PostgreSQL, MongoDB and netCDF based systems were fairly similar throughout the analysis. Each storage technology had strengths and weaknesses. The time needed for array conversions in the case of the MongoDB systems offset the benefits of lower database management overhead. Non-optimized chunk sizes impacted the performance of netCDF files when using a mechanical hard drive in the case of forecasting risk due to head blight of barley. PostgreSQL was generally fast overall but still reached a limit of database management overhead.
Because of the similarity in performance of many systems and modeling combinations, qualitative factors become important when choosing a storage technology for agroecosystem forecasting or, in fact, any complex system modeling. Despite the overall speed with use of SSD drives, netCDF systems were found to be the most cumbersome to use. Data variables had to be defined in code or with a command line utility before a forecasting model for an additional crop or region could be added to a system that will eventually process multiple models. This is a clear disadvantage when developing large, complex systems over time. The MongoDB and PostgreSQL systems, by contrast, incorporate single repositories for forecasting, validation, and derived data. For this reason no additional code is needed to store derived regional data. Only region definitions and the code of new models need to be added to expand the system. The MongoDB systems offer additional flexibility that the PostgreSQL system cannot. A single MongoDB document can potentially store references to multiple derived outputs of a model, including derived output sets used in this situation as inputs to a neural network model. If a neural network model requires more than a few inputs, storing these inputs as separate references within the same document is quite useful. As shown by the differences in speed between MongoDB versions A and B during the two modeling trials, MongoDB also offers the additional flexibility of varying storage and access format for different spatio-temporal region sizes.
Updated weather forecasting datasets and ever increasing demand for decision support systems that incorporate forecasting data make expandability highly desirable in agroecosystem model design. If overall system speed is paramount, scientific data formats like netCDF remain a preferred storage solution, with options to improve access time by optimizing size of dimensional data chunks. If research personnel resources are small, PostgreSQL libraries use simple, swift code that interfaces with ArcSDE. If creative model development and spatio-temporal flexibility of modeling inputs are a priority, NoSQL options such as MongoDB allow for the most flexibility in stored data contents.
Acknowledgements
References
Aakre, D 2005 ‘DON (Vomitoxin) in wheat/barley. Retrieved 2009, from NDSU Extension Service: http://www.ag.ndsu.edu/pubs/plantsci/pests/pp1302.pdf
Abdella, Y & Alfredsen, K 2010 ‘A GIS toolset for automated processing and analysis of radar precipitation data. Computers and Geosciences, 36(4), pp. 422-429. doi: 10.1016/j.cageo.2009.08.008
Amirian, P, Basiri, A, & Winstanley, A 2014 ‘Evaluation of Data Management Systems for Geospatial Big Data. In Computational Science and Its Applications – ICCSA 2014, pp. 678-690.
doi: 10.1007/978-3-319-09156-3_47
Bachoo , A, Van Den Bergh, F, & Gazendam, AD 2008 ‘Efficient temporal access of satellite image data. PositionIT, pp. 34-39.
Baker, KM, & Kirk, WW 2007 ‘Comparative analysis of models integrating synoptic forecast data into potato late blight risk estimate systems. Computers and Electronics in Agriculture, 57, pp. 23-32.
doi: 10.1016/j.compag.2007.01.011
Baker, KM, Kirk, WW, Stein, JM, & Andresen, JA 2000 ‘Crop disease mitigation: daily risk modeling for Michigan potato growers. Proceedings of the 4th International Conference on Integrating Geographic Information Systems and Environmental Modeling (GIS/EM4), 2-8 September, Banff, Alberta, Canada.
Baker, KM, Lake, T, Roehsner, P & Schrantz, K 2012 ‘Forecasting Disease with 10-Year Optimized Models: Moving Toward New Digital Datasets. In The First International Conference on Agro-Geoinformatics, pp. 400-409. IEEE.
Bondalapati, KD, Stein, JM, Osborne, LE, Neate, SM, & Hollingsworth, CR 2012 ‘Development of weather-based predictive models for Fusarium head blight and deoxynivalenol accumulation for spring malting barley. Plant Dis. 96, pp. 673-680. doi: 10.1094/PDIS-05-11-0389
Chesnaux, R, Lambert, M, Walter, J, Fillastre, U, Hay, M, Rouleau, A, Daigneault, R, Moisan, A & Germaneau, D 2011 ‘Building a geodatabase for mapping hydrogeological features and 3D modeling of groundwater systems: Application to the Saguenay-Lac-St.-Jea region, Canada. Computers & Geosciences, 37(11), pp. 1870-1882.
DeWolf, E & Lipps, P 2003 ‘Fusarium Head Blight. Retrieved 2009, from Penn State Small Grains Management: http://smallgrains.psu.edu/
ESRI 2013 ‘Storage in a Relational Database Management System. Retrieved July 25, 2013, from www.esri.com/software/arcgis/geodatabase/storage-in-an-rdbms
ESRI 2013a ‘What's new for geodatabases in ArcGIS 10.1. Retrieved July 25, 2013, from resources.arcgis.com/en/help/main/10.1/index.html#//016w00000031000000
Goodchild, MF 1992 ‘Geographic information science. International Journal Geographical Information Systems, 6(1), pp. 31–45. doi: 10.1080/02693799208901893
Guenthner, JF, Michael, KC & Nolte, P 2001 ‘The economic impact of potato late blight on US growers. Potato Research 44, pp. 121-125. doi: 10.1007/BF02410098
Myrick, DT & Horel, JD 2006 ‘Verification of Surface Temperature Forecasts from the National Digital Forecast Database over the Western United States. Weather and Forecasting, 21(5), 869-892.
doi: 10.1175/WAF946.1
Oliphant, TE 2006 ‘Guide to NumPy. Retrieved from http://www.tramy.us/
Pavan, W, Fraisse, CW & Peres, NA 2011 ‘Development of a Web-based Disease Forecasting System for Strawberries. Computers and Electronics in Agriculture, 75(1), pp. 169-175.
doi: 10.1016/j.compag.2010.10.013
Ruth, DP, Glahn, B, Dagostaro, V & Gilbert, K 2009 ‘The Performance of MOS in the Digital Age. Weather and Forecasting, 24(2), pp. 504-519. doi: 10.1175/2008WAF2222158.1
Strassberg, G, Jones, NL & Maidment, DR 2011 ‘Arc hydro groundwater: GIS for hydrogeology. Redlands, Calif: ESRI Press.
Stonebraker, M & Cetintemel, U 2005 ‘One size fits all: An idea whose time has come and gone. In Proc. of the 21th International Conference on Data Engineering, pp. 2-11. doi: 10.1109/icde.2005.1
Tao, Z, Malvick, D, Claybrooke, R, Floyd, C, Bernacchi, CJ, Spoden, G, Kurle, J, Gay, D, Browersox, V & Krupa, S 2009 ‘Predicting the Risk of Soybean Rust in Minnesota Based on an Integrated Atmospheric Model. International Journal of Biometeorology, 53(6), pp. 509-521. doi: 10.1007/s00484-009-0239-y
Zhang, X, Song, W & Liu L 2014 ‘An implementation approach to store GIS spatial data in NoSQL database. International Conference on Geoinformatics, pp. 1-5. doi: 10.1007/978-3-319-03005-0