http://www.sciencepublishinggroup.com/j/ajist doi: 10.11648/j.ajist.20180203.11
ISSN: 2640-057X (Print); ISSN: 2640-0588 (Online)
Development of New Indicators for the Launch of Japan
Agency for Medical Research and Development
(AMED)-Trend Analysis for US NIH Funding
Mari Jibu
1, Yoshiyuki Osabe
2, *1
Policy-Oriented Research Group, National Institute of Science and Technology Policy (NISTEP), Tokyo, Japan
2
Patent Information Policy Planning Office, Japan Patent Office (JPO), Tokyo, Japan
Email address:
[email protected] (M. Jibu), [email protected] (Y. Osabe)
*
Corresponding author
To cite this article:
Mari Jibu, Yoshiyuki Osabe. Development of New Indicators for the Launch of Japan Agency for Medical Research and Development (AMED)-Trend Analysis for US NIH Funding. American Journal of Information Science and Technology. Vol. 2, No. 3, 2018, pp. 64-73. doi: 10.11648/j.ajist.20180203.11
Received: September 10, 2018; Accepted: October 6, 2018; Published: October 27, 2018
Abstract:
For the sake of providing evidences that contribute to policy making or strategy planning in AMED (a Japanese version of the NIH) and pharmaceutical companies, this study tried to analyze a current state of the pharmaceutical industry based on new indicators and forecast the future thorough a series of papers. In this article, this study tried to give an overview of the funding trends for the drug development o this study analyzed 18,845 contracts between licensors and partners whose headquarters are located in the U.S. As a result, Major companies, SMEs are dealing not only with other SMEs but also dealing actively with government agencies and foundations in U.S. Government involvement is one of the most important aspects, because it provides innovation system structure to link each entity. The foundation also plays the important role as a funding partner in U.S. Focusing the role of SMEs in U.S., there are some transactions that SMEs buy the candidates of major companies on the discovery phase. On the other hands, investment from venture capital firms in Japan is one tenth of that in US. In AMED, introductory service of venture capital, commercialization, and government procurement will become useful systems.Keywords:
AMED, NIH, Pharmaceuticals, R&D, EBPM, Funding, SBIR, Venture Capital1. Introduction
Diverse studies have been conducted to study the origin, trajectory, and destination of knowledge flows and the delays in the science and technology system. Patents and citations between patents and to non-patent literature (NPL) are analysed to understand knowledge spillovers [1] or to measure patent quality [2]. The OECD Science, Technology and Industry Scoreboard 2013 [3] uses comprehensive and up-to-date data to report on knowledge flows via collaboration networks (e.g., derived from co-authored publications and co-inventors on patents), international migration of researchers (e.g., estimated from changes in author’s addresses on publications), but also flows of royalty and license fees for technologies. Pharmaceutical innovation is particularly important for drug discovery, as research and development (R&D) costs are huge
and major challenges exist for arriving at cost-effective new drugs. In fact, there is a steady decrease in R&D productivity over the last number of years [4].
The main purpose of this study is to provide evidence in order to contribute to evidence-based-policy-making (EBPM) and strategic planning. Especially for the sake of providing evidence for AMED (see Note below) and pharmaceutical companies, the authors tried to analyze a current state of the pharmaceutical industry based on new indicators and forecast the future, thorough a series of papers below. This is the English translation of seventh paper of the authors’ consequence papers on scientometric analysis in the pharmaceutical field.
measure the R&D capacity of each country in the current stage and in future [5, 6]. In order to facilitate open innovation in a multi-step R&D process, the 3rd paper showed that it was important for so-to-speak "roundabout of drug discovery" centered on SMEs and start-ups [7].
In addition, the other papers showed that the authors original indicator "Purified Patent Family Number" calculated by parameters such as International Patent Classifications (IPC) number, cited patent number, and non-patent literature (NPL) number cited by patents is a crucial indicator for predicting the basic research potential of the pharmaceutical industry in each country [8, 9].
Furthermore, in another paper, the authors analyzed drug R&D situation by disease type [10]. The paper showed that cancer, infection and nervous system disease are current hot issue of R&D. It also showed that SMEs play a central role in R&D in US and UK, whereas major companies play a central role in R&D in Japan.
The authors also analyzed the knowledge flows of the pharmaceutical innovation system, focusing on the patents related with pipelines and drugs. It is shown that the patents/NPLs cited on the patents by patent examiners/applicants as well as the technical fields of cited patents are key factors in order to see the knowledge flows [11]. This article is the seventh paper of these consequential papers. The authors tried to grasp US trends of pharmaceutical funding system such as government agencies and private foundations for grants. Please note that this article is a
personal opinion of the authors, and not expressing opinions of the organization that the authors belong to.
2. Database
In this analysis, the authors used Thomson Reuters' Cortellis for Competitive Intelligence database (hereafter “Cortellis database”). This database includes approximately 50,000 drugs and pipelines information, and 35,000 contract information between organizations. It can be a platform bringing together the industry’s most comprehensive deals analysis coverage. Now this database is found as Cortellis Deals Intelligence.
The data extraction date is December 11, 2013.
Among 35,000 organization-to-organization contract information, the authors analyzed 18,845 contracts between licensors and partners whose headquarters are located in the U.S. This data could be analyzed in order to identify potential deal partners by therapeutic area, mechanism, technology, and stage of development.
3. Results
3.1. Contract Between Organizations
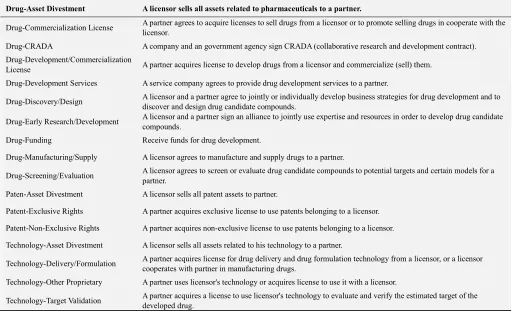
Figure 1 shows a detailed breakdown of contracts between organizations in order of the number of cases. Table 1 indicates a content of the contract shown in Figure 1.
Table 1. Definition of contracts.
Drug-Asset Divestment A licensor sells all assets related to pharmaceuticals to a partner.
Drug-Commercialization License A partner agrees to acquire licenses to sell drugs from a licensor or to promote selling drugs in cooperate with the licensor.
Drug-CRADA A company and an government agency sign CRADA (collaborative research and development contract).
Drug-Development/Commercialization
License A partner acquires license to develop drugs from a licensor and commercialize (sell) them.
Drug-Development Services A service company agrees to provide drug development services to a partner.
Drug-Discovery/Design A licensor and a partner agree to jointly or individually develop business strategies for drug development and to discover and design drug candidate compounds.
Drug-Early Research/Development A licensor and a partner sign an alliance to jointly use expertise and resources in order to develop drug candidate compounds.
Drug-Funding Receive funds for drug development.
Drug-Manufacturing/Supply A licensor agrees to manufacture and supply drugs to a partner.
Drug-Screening/Evaluation A licensor agrees to screen or evaluate drug candidate compounds to potential targets and certain models for a partner.
Paten-Asset Divestment A licensor sells all patent assets to partner.
Patent-Exclusive Rights A partner acquires exclusive license to use patents belonging to a licensor.
Patent-Non-Exclusive Rights A partner acquires non-exclusive license to use patents belonging to a licensor.
Technology-Asset Divestment A licensor sells all assets related to his technology to a partner.
Technology-Delivery/Formulation A partner acquires license for drug delivery and drug formulation technology from a licensor, or a licensor cooperates with partner in manufacturing drugs.
Technology-Other Proprietary A partner uses licensor's technology or acquires license to use it with a licensor.
Technology-Target Validation A partner acquires a license to use licensor's technology to evaluate and verify the estimated target of the developed drug.
The largest number of contracts between the two organizations was Drug-Funding (fund for drug development), 4,436 cases. It is followed by Drug-Development/Commercialization License, Technology-Other Proprietary. In the analysis of the paper [7], “Evaluate Pharma database” by Evaluate Ltd. was used, and contracts between two organizations was analyzed, but the database did not include data of Drug-Funding.
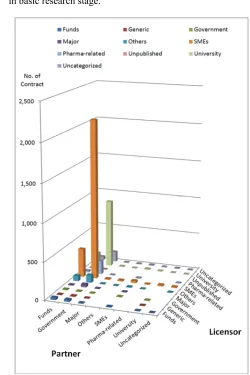
The database used this time, "Cortellis database", includes Drug-Funding (funds for drug development). Figure 2 shows which partner signs a contract with what kind of licensor organization. Organizations are classified into 8 categories, which are Major company, SMEs, Pharma-related-company, Generic company, Funds, University, Government, and Others. Table 2 shows the definition of each category.
Table 2. Definition of business entities. Business Entitiy Explanation
Major A major company that develops and sells new drugs. This category includes a major company that also develops non-active ingredients and a major company that also manufactures and sells generic drugs in addition to new drugs.
SME
A company below;
A company that develops new drugs and does not belong to a major company.
This category includes a SME or start-up that also develops non-active ingredients and a SME or start-up that also manufactures and sells generic drugs in addition to the development of new drugs.
A company that has been adopted in the United States' SBIR (Small Business Innovation Research) program between 1983 and 2011.
Generic A company that manufactures and sells generic drugs, not new drugs. This category includes a company that also develops non-active ingredients and do not develop new drugs in addition to generic drugs.
Pharma-related A company that develops non-active ingredients of pharmaceuticals, such as improving administration route and changing dosage form.
Funds A non-profit private foundation supporting development of drugs (Bill & Melinda Gates Foundation, Michael J. Fox Parkinson Disease Research Foundation, etc.)
Others CRO (contract for pharmaceutical development service), private laboratory, and hospital
Figure 2. Contracts by Licensor Type and Partner Type.
It turns out that SMEs play a central role, as the authors reported in previous paper [7]. Not only are there large contracts between a Major company and a SME, or a SME and other SMEs, but the contract of Government or Funds are also active with SMEs. Figure 3 shows the number of contracts between partner and licensor with limitation of contracts type “Drug-Funding”.
Funding related to pharmaceuticals includes many government agencies and foundations as partners. Both of them include many grants for SMEs, followed by university. It is noteworthy that the foundation plays an important role in US funding system.
Moreover, figure 4 shows in which phase government agencies and foundations made a contract. There are several phases in drug R&D. In this study, phases are divided into "Discovery", "Phase 1", "Phase 2", "Phase 3", "Before Approval", "Approval", and "Marketed". "Discovery" includes basic research and nonclinical study (animal study). Category also includes “Unknown” or “Uncategorized” because of data source.
Figure 4 indicates that government agencies and foundations have tendency to fund to SMEs and universities holding pipelines in discovery stage. It also shows that government agencies and foundations mostly invest pipelines
in basic research stage.
Figure 3. Contracts by Licensor Type and Partner Type in Drug-Funding.
In terms of Drug-Development/Commercialization License, as shown in Figure 5, SMEs mostly have contracts with universities holding pipelines in discovery stage. Following that, SMEs have contracts with SMEs holding pipelines in discovery stage, then Major companies have contract with SMEs holding pipelines in discovery stage. It is worth noting that SMEs have a tendency of having a contract with Major companies holding pipelines in discovery stage.
Figure 4. Number of Contracts on Drug-Funding (Funds and Government).
Table 3 shows the top 20 partners of deals for pharmaceuticals industry in the U.S. The top three are medical research institutions under the United States Department of Health and Human Services (HHS). As shown in Figure 1, Drug-Funding accounts for approximately 23.5%
of the total (4,436 out of 18,845), so foundations in the U.S. occupy the top. National Institutes of Health (NIH) consists of several laboratories and research centers, and all of them as a whole are referred to as NIH.
Table 3. Top 20 partners and number of contracts.
Order Partner Name Number of Contracts
1 National Institute of Allergy and Infectious Diseases 703
2 National Institutes of Health 681
3 National Cancer Institute 637
4 Pfizer Inc 517
5 US Government 447
6 Merck & Co Inc 376
7 Bristol-Myers Squibb Co 237
8 Eli Lilly & Co 199
9 Abbott Laboratories 175
10 National Institute of Neurological Disorders and Stroke 165
11 National Center for Research Resources 162
12 Genentech Inc 138
13 National Heart Lung and Blood Institute 126
14 US Department of Defense 110
15 National Institute of Diabetes, Digestive and Kidney Diseases 109
16 The Michael J. Fox Foundation 105
17 National Institute on Drug Abuse 94
18 US Health and Human Services Department 90
19 MedImmune LLC 87
19 Bill & Melinda Gates Foundation 87
These laboratories and research centers are divided into in-house and out-house departments by respective missions. The in-house department conducts research and clinical trials in the laboratory of the NIH in Bethesda, a suburb of Washington, D.C. Out-house departments provide grants for NIH's laboratories and research centers. In this analysis, all NIH laboratories and research centers that could not be identified are designated as NIH.
As mentioned above, one of the strengths of the United States is presence of foundations ranked as 16th and 19th. The Michael J. Fox Foundation ranked as 16th is a foundation founded in 2000 by American actor Michael J. Fox for research on Parkinson's disease. In 2013, its total funding amounted to $ 54,058,647. Bill & Melinda Gates Foundation ranked as the 19th is a foundation founded in 2000 by Gates, Microsoft. It is funding for research on HIV/AIDS, malaria infection and so on, as the Global Health Program. The Discovery & Translational Sciences program is distinctive and has the function of bridging outstanding basic research to actual solution.
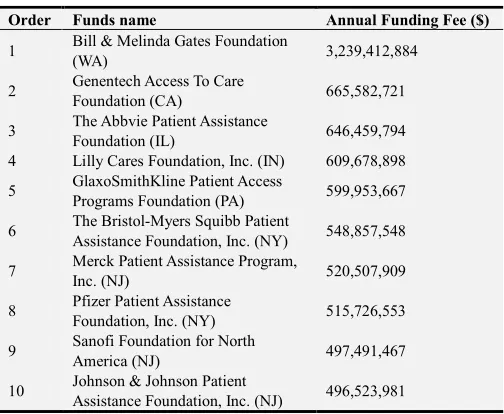
The top 10 entities in 2014 belong to all pharmaceutical-related fields except Bill & Melinda Gates Foundation ranked as the 1st and Ford Foundation ranked as the 7th (Table 4). Among the top 10 entities, the total of 8 entities excluding 1st and 7th is about 4.7 billion dollars a year [13]. According to the government draft budget of 2014, 121.5 billion yen (about 1 billion dollars, calculating 1 dollar is 100 yen) has been prepared for the creation of AMED (Japan version NIH) [14]. However, it is only a quarter of the
funding amount of the top nine companies excluding the 1st one of the U.S. entities.
Table 4. Top10 funds in U.S and their annual funding fee.
Order Funds name Annual Funding Fee ($)
1 Bill & Melinda Gates Foundation
(WA) 3,239,412,884
2 Genentech Access To Care
Foundation (CA) 665,582,721
3 The Abbvie Patient Assistance
Foundation (IL) 646,459,794
4 Lilly Cares Foundation, Inc. (IN) 609,678,898
5 GlaxoSmithKline Patient Access
Programs Foundation (PA) 599,953,667
6 The Bristol-Myers Squibb Patient
Assistance Foundation, Inc. (NY) 548,857,548
7 Merck Patient Assistance Program,
Inc. (NJ) 520,507,909
8 Pfizer Patient Assistance
Foundation, Inc. (NY) 515,726,553
9 Sanofi Foundation for North
America (NJ) 497,491,467
10 Johnson & Johnson Patient
Assistance Foundation, Inc. (NJ) 496,523,981
License, which indicates that a partner acquires license to develop drugs from a licensor and commercialize (sell) them And that they support drug R&D after commercialization
license. Genentech Inc. ranked as 12th was one of the global companies as it became under umbrella of Roche in 2009.
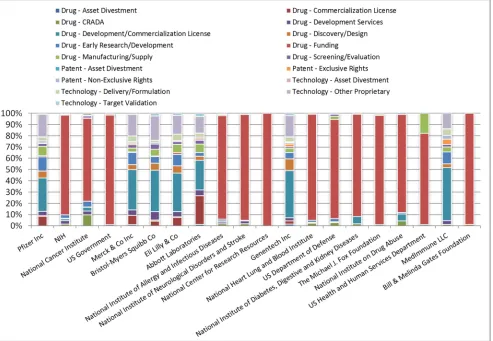
Figure 6. Contract detail of the top 20 partners.
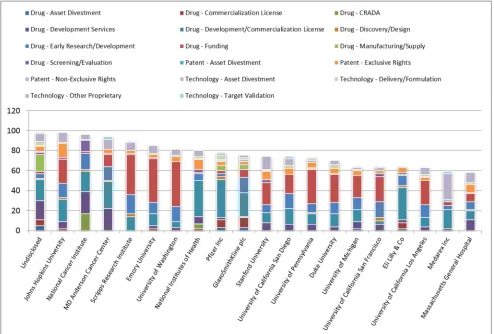
On the other hands, figure 7 shows details of the number of top 20 licensor and deals. Except unpublished, Johns Hopkins University is ranked as 1st, National Cancer Institute as 2nd and MD Anderson Cancer Center as 3rd. Of the top 20, ten institutions include universities, and Drug/Funding is the most popular as a deal, then Drug-Development/Commercialization License.
For Scripps Research Institute and Massachusetts General Hospital, which are hospitals affiliated with universities and nonprofit organizations, Drug-Screening / Evaluation is the major for Scripps Research Institute and Massachusetts General Hospital. The former is the nonprofit organization, the latter is the hospital which is affiliated with university. Drug-Screening / Evaluation means that licensor will screen and evaluate drug candidate compounds against potential targets and certain models for partners.
3.2. Funding for SMEs
Small Business Innovation Research (SBIR) and Small Business Technology Transfer (STTR) are the largest grans for SMEs and start-ups in the United States. This program also occupies 628 deals out of 4,436 deals of the U.S.
Figure 7. Detail of the number and deals of top 20 licensors.
On the other hand, the STTR program promotes science and technology innovation which SMEs collaborate with laboratories. It also promotes technology transfer between SMEs and laboratories. Like the SBIR program, it has 3 steps in order to implement its programs. The purpose for each phase is the same as SBIR, but the years of Phase I and the amount of funds are different. In phase I, it affords 150,000 dollars for about one year. Both of these programs fund to SMEs’ R&Ds, which have high possibility to be marketed, and have been started by the Small and Medium Business Administration since 2000. Currently 11 ministries (Ministry of Agriculture, Department of Commerce, Department of Defense, Ministry of Education, Department of Energy, Department of Homeland Security, Ministry of Transportation, Department of Health and Human Services, Ministry of Health and Human Services, Environment Agency, Aerospace Department, and National Science Foundation) are participating in the programs. Among them, 1.6 billion dollars are funded by National Institutes of Health, which is about 40% of the total [15].
Using the Cortellis database, this study analyzed whether the SBIR/STTR programs have been utilized by companies, universities and 1,195 organizations, which have drug pipelines, based in the U.S. This study has downloaded all the companies that have received the SBIR/STTR programs since 1983 by the information of http://sbir.gov. The study
has collated these companies’s information into the Cortellis database. As a result, 667 institutions, about 55.8% of Cortellis database were found to have utilized SBIR/STTR programs in the past. Table 5 shows the top 10, among companies having drug pipelines, in the Cortellis database that utilized the SBIR/STTR programs.
Table 5. The top 10, among companies having drug pipelines, which utilized the SBIR/STTR programs.
Order Company Name Number
8 Amgen Inc 138
10 Omeros Corp 109
22 Immunomedics Inc 70
31 Chiron Corp 57
32 ImClone Systems Inc 55
35 Gilead Sciences Inc 49
39 Medarex Inc 45
41 Exelixis Inc 44
65 IDEC Pharmaceuticals Corp 29
65 Immunex Corp 29
have rapidly grown from a SME to a world-class biotechnology company in 35 years, while most of top 10 companies are major companies, like Pfizer Inc., Merck & Co. Inc., Eli Lilly & Co., Bristol Myers Squibb Co.
In Phase III of the SBIR/STTR programs, introduction to venture capital is implemented, and there is no doubt that venture capital is an important source of funding for growth of start-ups based on a new technology [16]. However, investment in start-ups by Japanese venture capital is one tenth of that in the United States [17].
Figure 8 shows annual investment amount and number of companies invested by Japanese venture capital, adding to OECD's Science, Technology and Industry Scoreboard 2013. As for the annual investment in Japan, it is converted and plotted on the basis that 1 dollar equals 100 yen. As can be seen from Figure 8, investment by venture capital is small and its activation is an important issue in Japan. In the United States, it can be seen that venture capitals have invested many start-ups and supported their prosperity.
Figure 8. Annual investment amount and number of companies invested by JP, US, and EP venture capitals.
In AMED (Japanese version of NIH), it seems necessary to introduce the funding programs, including phase system like SBIR/STTR, for commercialization of drug pipelines of SMEs. It is also necessary to bridge government procurements and venture capital in Japan.
4. Conclusion
As a result of analyzing what kind of research grants from the government, foundation and companies in the U.S. are doing research funding for drug development, this study showed the following items.
Major companies, SMEs are dealing not only with other SMEs but also dealing actively with government agencies and foundations. Government involvement is one of the most important aspects, because it provides innovation system structure to link each entity. The foundation also plays the important role as a funding partner in U.S. It seems to relate the tax system of the country. Focusing the role of SMEs in U.S., there are some transactions that SMEs buy the candidates of major companies on the discovery phase. According to the Cortellis, about 55.8% of the companies developing drugs got grants of SBIR/STTR system. In the Phase III of SBIR/STTR system, it is available to get introductory service of venture
capital. It is very important source of funds for start-ups and venture capital firms. Investment from venture capital firms in Japan is one tenth of that in US. In AMED, introductory service of venture capital, commercialization, and government procurement will become useful system.
NOTE: Japan Agency for Medical Research and Development (AMED), established in April 1, 2015. Cabinet Japan approved establishment of 'control tower' function for medical R&D, in line with "Japan Revitalization Strategy" policy strategy in 2013. The Cabinet also approved the bills for Act on Promotion of Healthcare Policy and Act on the Independent Administrative Agency of Japan Agency for Medical Research and Development. The purpose of AMED is to promote integrated research and development in the field of medicine, from basic research to clinical trials.
References
[2] Squicciarni, Mariagrazia, Helene Dernis and Chiara Criscuolo. 2013. “Measuring Patent Quality: Indicators of Technological and Economic Value” OECD/DSTI/DOC 3
[3] OECD. 2013. OECD Science, Technology and Industry Scoreboard 2013: Innovation for Growth. Paris, France: OECD Publishing
[4] Booth, Bruce, and Rodney Zemmel. 2004. “Prospects for Productivity.” Nature Reviews Drug Discovery 3, 451-456
[5] Yoshiyuki OSABE, Mari JIBU. Development of new indicators for the launch of a Japanese version of the NIH (1): An overview and future prospects of pharmaceutical industry based on new indicators. Journal of Information Processing and Management. 2013, Vol. 56, No. 7, p. 448. https://www.jstage.jst.go.jp/article/johokanri/56/7/56_448/_art icle/-char/en
[6] Yoshiyuki OSABE, Mari JIBU. Development of new indicators for the launch of a Japanese version of the NIH (2): A technology-specific overview and future prospects of pharmaceutical industry. Journal of Information Processing and Management. 2013, Vol. 56, No. 9, p. 611. https://www.jstage.jst.go.jp/article/johokanri/56/9/56_611/_art icle/-char/en
[7] Yoshiyuki OSABE, Mari JIBU. Development of new indicators for the launch of a Japanese version of the NIH (3): Analysis of entities conducting pharmaceutical R&D activities. Journal of Information Processing and Management. 2014, Vol. 56, No. 10, p. 685.
https://www.jstage.jst.go.jp/article/johokanri/56/10/56_685/_a rticle/-char/en
[8] Mari JIBU, Yoshiyuki OSABE. Development of new indicators for the launch of a Japanese version of the NIH (4): Refined indicators for patents linked with marketed drugs and pipelines. Journal of Information Processing and Management. 2014, Vol. 57, No. 1, p. 29.
https://www.jstage.jst.go.jp/article/johokanri/57/1/57_29/_arti cle/-char/en
[9] Mari JIBU, Yoshiyuki OSABE. Development of new indicators for the launch of a Japanese version of the NIH (5): Analysis
based on refined indicators for patents linked with marketed drugs and pipelines. Journal of Information Processing and Management. 2014, Vol.57, No.3, p.178. https://www.jstage.jst.go.jp/article/johokanri/57/3/57_178/_art icle/-char/en
[10] Yoshiyuki OSABE, Mari JIBU. Development of new indicators for the launch of AMED (6): A disease-specific overview and future prospects of pharmaceutical industry. Journal of Information Processing and Management. 2014, Vol. 57, No. 5, p. 323. https://www.jstage.jst.go.jp/article/johokanri/57/5/57_323/_art icle/-char/en
[11] Mari JIBU, Yoshiyuki OSABE. Development of new indicators for the launch of AMED (8): Knowledge flows of the pharmaceutical innovation system. Journal of Information Processing and Management. 2014, Vol.57, No.8, p.562. https://www.jstage.jst.go.jp/article/johokanri/57/8/57_562/_art icle/-char/en
[12] Odagiri Hiroyuki. "Corporate Boundaries" in Pharmaceutical Research and Development, Pharmaceutical Industry Organization Theory, The University of Tokyo Press, 2002, p. 117-151.
[13] Foundation Center.
http://www.foundationcenter.org/findfunders/topfunders/top10 0giving.html, (accessed 2018-09-06).
[14] Ministry of Finance. Points of budget for science and technology in FY2014, 2013,
http://www.mof.go.jp/budget/budger_workflow/budget/fy201 4/seifuan26/05-07.pdf, (accessed 2018-09-06).
[15] SBIB/STTR. http://sbir.gov/, (accessed 2018-09-06).
[16] OECD Science, Technology and Industry Scoreboard 2013. http://www.oecd-ilibrary.org/science-and-technology/oecd-sci ence-technology-and-industry-scoreboard-2013_sti_scoreboar d-2013-en, (accessed 2018-09-06).
[17] Venture Enterprise Center. Survey result of venture capital investment trend in FY 2013 (preliminary report).
http://www.vec.or.jp/wordpress/wp-content/files/2013-sokuho 20131018.pdf, (accessed 2018-09-06).