65 Volume XIII (2015), Page 65 - 84
ASSESSING THE URBAN AND RURAL STAGE BUS SERVICES DISPARITIES IN PENINSULA MALAYSIA
Zakiah Ponrahono1, Syahriah Bachok2, Mariana Mohamed Osman3, Mansor
Ibrahim4, Muhammad Faris Abdullah5 & Alias Abdullah6
1Department of Environmental Management, Faculty of Environmental Studies,
UNIVERSITI PUTRA MALAYSIA
2,3,4,5&6Department of Urban and Regional Planning INTERNATIONAL ISLAMIC UNIVERSITY MALAYSIA
Abstract
Disparities between services and goods provision have been the concerns of various regional development proponents. Among the gaps that needed to be addressed by regional policies and initiatives were accessibility and mobility levels between urbanites and the rural population. This study reports on the differences of the urban versus rural bus services. For this purpose, this study extends the exploration of approximately 48 routes within selected urban and regional settlements in Peninsula Malaysia, using a quantitative traffic engineering measure known as Level of Service standards or LOS. Three performance measures, namely fixed-route hour of service, fixed-route service frequency and passenger-load threshold were evaluated in determining the existence and extent of such disparities. The passengers’ satisfaction and preference survey were conducted to complement some qualitative explanations left void by the LOS evaluation. Methods of on-board face to face intercept survey and adoption of Geographical Information System (GIS) /Global Positioning System (GPS) were deployed in the collection of primary data. More than 1600 survey forms were distributed, but after collection and data cleaning, only a total of 1130 were analysed. Findings of the study supported and confirmed the existence of such spatial imbalances of services provision. They also further accentuated that many developing nations’ rural settlements were indeed stigmatised by a lower level of stage bus services (average at LOS D) compared to those enjoyed by the urbanites (average services at LOS C).
Keyword: transport planning; public transport; passenger’s aspiration; onboard survey
© 2015 by MIP 66
INTRODUCTION
An issue greatly discussed by many regional stakeholders is the urban and rural divide of Malaysian mobility and accessibility levels (Nor & Nor, 2006; Roslan, 2001; Siong, 2008; Thompson, 2004). This divide hindered systematic and comprehensive growth of rural areas especially in network infrastructure upgrading and accessibility improvement. One of the main contributors of the disparity is inefficient public transport system, whereby the lack of such system would limit the choices, circumstances and fortunes of the population to reach amenities and facilities as well as access the employment opportunities (Kamba, Rahmat, & Ismail, 2007; Olsson, 2012; Pucher & Renne, 2013).
In some parts of the world, public transportation, such as buses in urban areas, is an optional mode to overcome many traffic issues including to reduce congestion, to increase the coverage of distances and to improve the mobility levels (Abdullah, 2006; Ismail, Hafezi, Nor, & Ambak, 2012; Jayaraman, Choong, Suan, & Lin, 2011; Ponnaluri, 2011; Suwardo, Napiah, & Kamaruddin, 2009; Yaakub & Napiah, 2011a, 2011b). However, for some rural populations who are captive to buses, these are the only access modes to destinations near and far. Whilst many services are provided to varying degrees in Malaysia, less have been prioritised on ensuring the buses’ integration, coordination and monitoring to reach an efficient level of sustainability (Hayashi, Doi, Yagishita, & Kuwata, 2004).
67 © 2015 by MIP
RURAL VERSUS URBAN BUS SERVICES
Issues of the urban-rural public bus in Malaysia received less than proportionate attention by the global literature (Abdullah, 2006; Ismail et al., 2012; Jayaraman et al., 2011; Ponnaluri, 2011; Suwardo et al., 2009; Yaakub & Napiah, 2011a, 2011b). Whilst many research highlighted the issues pertinent to countries, regions, cities and ruralities facing imbalance physical and socio-economic growth, contemporary literature has focused more on cases of developed nations’ urban-rural gaps (Hidding & Teunissen, 2002; Odeck & Alkadi, 2004; Odeck, 2006; Pucher & Renne, 2013). Limited literature can be cited for an in-depth discussion on quality and performance (operation) of urban-rural public transportation especially buses in Malaysia (Jayaraman et al., 2011; Kamaruddin, Osman, Anizaliana, & Pei, 2012; Napiah, Farid, & Suwardo, 2010; Noor, Nasrudin, & Foo, 2014; Sham, Samsudin, & Rahman, 2013; Suwardo et al., 2009; Suwardo, Napiah, & Kamaruddin, 2008a, 2008b). Most studies in public transportation were carried out in the specific areas of urban or rural localities distinctively, and these lack the comparative element in their discussion (Jayaraman et al., 2011; Kamaruddin et al., 2012; Napiah et al., 2010; Noor et al., 2014; Sham et al., 2013; Suwardo et al., 2009, 2008a, 2008b). Previous studies have purposively concentrated on ridership and improvement of bus services in a case study manner, providing scarce literature sources for regional disparities assessment. Hence, in-depth regional comparison and rigorous evaluation of rural-urban bus services divide is made difficult, if not impossible. This particular research fills in this literature gap.
Often, bus operations are varied by types and features, where distinctive characteristics are found between those of urban and rural, such as route coverage, fare and fleet systems (Odeck & Alkadi, 2004). These systems and fleet characteristic variations have been attributable to the socio-economic, value-belief-culture and geo-spatial differences of the localised needs. As nations grow, Asian urban centres are faced with mobility issues and automobile dependency. In rural areas, this effect is compounded by the limited alternatives (Bailey, 1986; Bell & Cloke, 1991; Dandapat & Maitra, 2015; Santoso, Yajima, Sakamoto, & Kubota, 2012). Additionally, the existing public transport in both localities encountered problems of low and poor quality of service operation, infrastructure and facilities, the similar conditions faced by capital cities and rural settlements of Malaysia (Jayaraman et al., 2011).
© 2015 by MIP 68
rail is associated with, bus system such as Brazil’s bus rapid transit (BRT) is considered a better and more functioning alternative to reduce automobile dependency, in pursuit of the preservation of the geo-cultural and sustenance of the regions (Currie & Delbosc, 2014; Jaramillo, Lizárraga, & Grindlay, 2012; Patrick & Roseland, 2005). However, this situation may not be a true reflection of the urban-rural public bus ridership reality in Malaysia. Whilst programmes of bus services transformation may be adopted for urban systems, different treatments may be necessary in rural areas which have a lower density and diverse population activities within sparse geographical areas.
The Level of Service (LOS) and passengers’ satisfaction are two viable measurement tools in assessing bus services performance (Chen, Yu, Zhang, & Guo, 2009). Target performance improvements are increased overall quality, reliability, efficiency and effectiveness of the system. Not only service quality is measured from the aspects of operation and management, the performance can also be evaluated against the perception and expectation of the passengers, who are the end users. Evaluating passengers’ satisfaction level towards buses would help identify the service quality and areas of necessary improvements (Zakaria, Hussin, Batau, & Zakaria, 2010). Even though there exists no specific standard measurement tool or parameter that can be applied universally, the attributes in LOS and passengers’ satisfaction study are considered by scholars as sufficient for service quality assessment (Samir, 2001; State of Florida Department of Transport, 2013). In short, LOS measures the service quality from the perspectives of existing passengers on the bus services, while providing insight to the aspiration of what matters the most for the current and future the users of buses.
69 © 2015 by MIP
the population size, density and sparse locations of the trip attractions (Ariffin & Zahari, 2013).
Santoso, Yajima, Sakamoto, & Kubota, (2012) highlight that since rural areas rarely face traffic issues like congestion and insufficient parking spaces, dependency on private vehicles is inevitable. Any attempt to provide sustainable bus services or improve the existing system would be a challenge. Hence, an expected scenario most likely experienced by rural Malaysians is one where low ridership on older fleets, passengers riding the scanty services with minimum amount of complaints and inter-district or even door to door service to the population. This study aims at confirming such scenario, by identifying differences and similarities between urban and rural public buses services in Malaysia, a gap clearly mooted by the literature. It is also the aim of the study to analyse the quality of services in the selected urban and rural settlements in Peninsula Malaysia for the purpose of generalizing the quantum and magnitude of public bus system issues.
RESEARCH AIM AND OBJECTIVES
Having identified research gaps and problem statements, the following objectives are formulated:
1. To determine the existence and magnitude of LOS difference between services of selected urban and rural centres of Peninsula Malaysia 2. To analyze the bus passengers’ preferences and aspirations
RESEARCH METHODOLOGY
Sampling Frame
© 2015 by MIP 70
by other public transport systems with the exception of informal paratransit such as informal car rental (kereta sapu). The four rural settlements are:
i. Pekan, Batu Pahat and Kerian (Pekan District Office, Batu Pahat District Office and Kerian District Office), settlements that centered on small or intermediate towns.
ii. Batu Pahat as included in the zone of Muar-Batu Pahat-Kluang District Growth Conurbation in National Physical Plan 2 (Federal Department of Town and Country Planning Ministry of Housing and Local Government of Malaysia, 2010).
iii. Seberang Prai bus route coverage includes suburb and small villages in Penang.
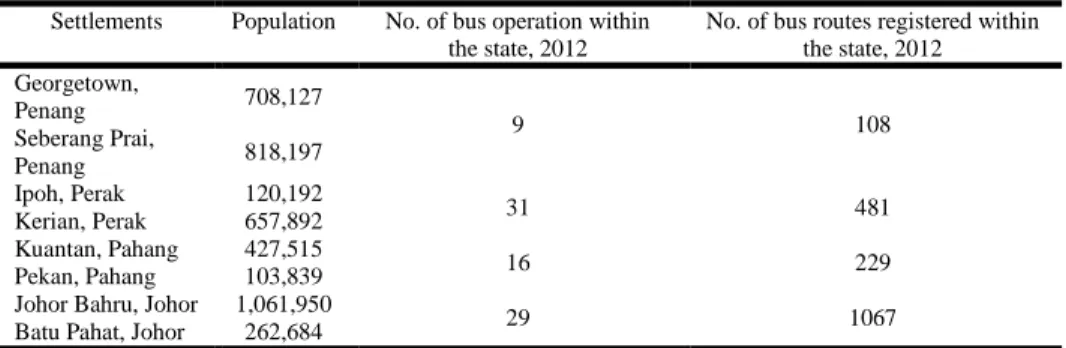
The present population and recorded bus users as supplied by the operators of the selected settlements against the number of operators and routes registered are detailed in the Table below:
Table 1: Population, Number of Bus Operators and Bus Routes of the Selected Case Studies
Settlements Population No. of bus operation within the state, 2012
No. of bus routes registered within the state, 2012 Georgetown,
Penang 708,127
9 108
Seberang Prai,
Penang 818,197 Ipoh, Perak 120,192
31 481
Kerian, Perak 657,892 Kuantan, Pahang 427,515
16 229
Pekan, Pahang 103,839 Johor Bahru, Johor 1,061,950
29 1067
Batu Pahat, Johor 262,684
Sampling Unit
71 © 2015 by MIP
passengers seated or standing near, next to, behind, in front or beside the
enumerators when and if a crash load of passengers’ boarding reached
maximum level or beyond the tolerable threshold. Employing the 95 percent
confidence level and confidence interval, the following algorithm by Yamane,
(1967) is adopted to ascertain the minimum sample size for each of the case
studies.
Given the confidence level = 95%, and P = 0.05
n = 400
For each case study state (Perak, Pahang, Pulau Pinang and Johor) a
minimum of 300 samples were targeted to be collected, thus 1200 samples for
the overall study. In this study, to achieve the targeted samples, an optimal
140 survey forms were distributed to passengers of the bus as soon as the bus
move from the terminal. Optimally, from the nine (9) terminals, it was aimed
that some 1260 samples to be collected. However, enumerators were working
on the basis of approved and permitted survey duration and survey routes
allowable by the operators. As such, after data cleaning, only 1130 survey
forms were analysed for generalisation purposes. Some terminals have higher
and more than proportionate samples due to a higher number of riders and
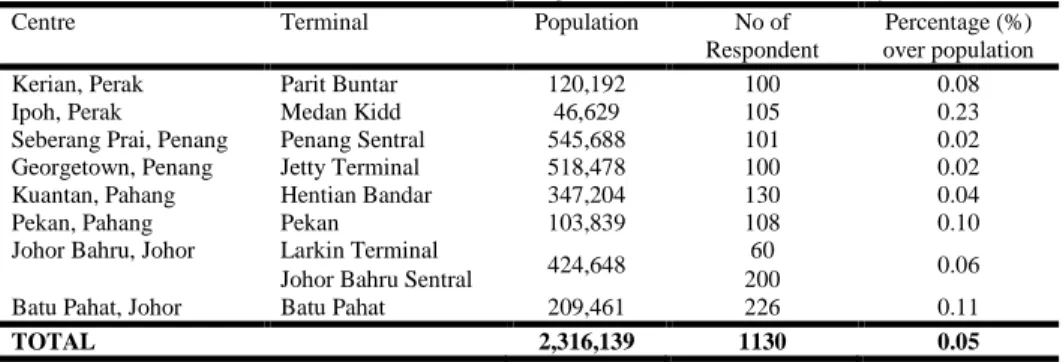
greater concentration of route coverage. Table 2 details out the distribution of
respondents by urban-rural centres.
Table 2: Distribution of Sampling Unit for On-Board Survey
Centre Terminal Population No of Respondent
Percentage (%) over population Kerian, Perak Parit Buntar 120,192 100 0.08 Ipoh, Perak Medan Kidd 46,629 105 0.23 Seberang Prai, Penang Penang Sentral 545,688 101 0.02 Georgetown, Penang Jetty Terminal 518,478 100 0.02 Kuantan, Pahang Hentian Bandar 347,204 130 0.04 Pekan, Pahang Pekan 103,839 108 0.10 Johor Bahru, Johor Larkin Terminal
424,648 60 0.06 Johor Bahru Sentral 200
Batu Pahat, Johor Batu Pahat 209,461 226 0.11
TOTAL 2,316,139 1130 0.05
1 + N (e)²
N
n = 2,739,544
1 + 2,739,544 (0.05)2
© 2015 by MIP 72
On-board public bus survey
Adopting face to face intercept survey has the greater advantage over other methods in capturing passengers’ demographic and travel characteristics. This method provided greater reliability, validity, credibility and precision or accuracy of data since passengers can easily recall, reflect and approximate their journey experiences with the very trip they were making when they were interviewed on board (Yaakub & Napiah, 2011a).
Procedure
Surveys were conducted were carried out on several bus trips during both weekdays and weekend. The on-board passengers’ responses were capture according to the schedule below:
Error! Reference source not found.
*Intercept face to face conducted during off peakFigure 1: Onboard Survey Period Conducted
Questionnaire
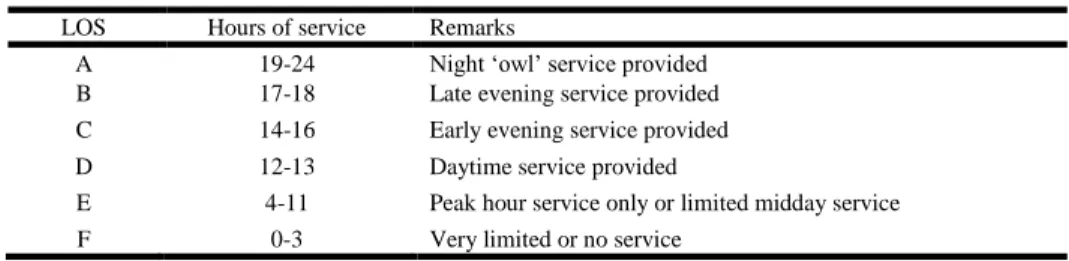
The variables to be collected for purposes of bus performance evaluation and improvements aspired by passengers have been translated into questions in the survey forms. This questionnaire was divided into two sections namely sections A and B. Section A consisted of the socio-demographic and trip characteristics. Meanwhile, Section B evaluated the satisfaction level with the current services as well as respondents’ preferences and aspirations. The quality of bus services in the selected case studies were assessed against three performance measuring standards or Level of Service LOS (Tables 3 through to 8):
73 © 2015 by MIP Table 3: Fixed-route Hour of Service LOS
LOS Hours of service Remarks
A 19-24 Night ‘owl’ service provided B 17-18 Late evening service provided C 14-16 Early evening service provided D 12-13 Daytime service provided
E 4-11 Peak hour service only or limited midday service
F 0-3 Very limited or no service
Source: (Yaakub & Napiah, 2011a)
Second, the measurement was made on the average frequency of bus within the waiting time, which is also known as the fixed-route service frequency LOS. Meanwhile, headway is a derivation of frequency of services, whereby in a service of two buses per hour i.e. the frequency of two per hour, the headways between two buses were thirty minutes.
Table 4: Fixed-route Service Frequency LOS
LOS Average Headway (min) Vehicle per hour Remarks
A <10 >6 Passengers do not need schedules
B 10-14 5-6 Frequent service, passengers consult schedules
C 15-20 3-4 Maximum desirable time to wait if bus/train missed
D 21-30 2 Service unattractive to choice riders E 31-60 1 Service available during the hour F >60 <1 Service unattractive to all riders Source: Noorfakhriah and Madzlan, 2001, p.5
Another measurement is the degree with which maximum allowable seating and standing capacity of a vehicle fleet is reached. This is known as passenger loading LOS.
Table 5: Passengers Loading LOS Thresholds
LOS Passengers /Seat Remarks
A 0.00-0.50 No passenger needs to sit next to another B 0.51-0.75 Passengers can choose where to sit C 0.76-1.00 All passengers can sit
D 1.01-1.25* Comfortable standee load for urban transit E 1.26-1.50* Maximum schedule load for urban transit F >1.50* Crush load
*approximate values for comparison
Source: Transport Research Board of National Academics TCRP Report 100 (TCQSM 2003) as cited in M. Napiah et al., (2010)
© 2015 by MIP 74
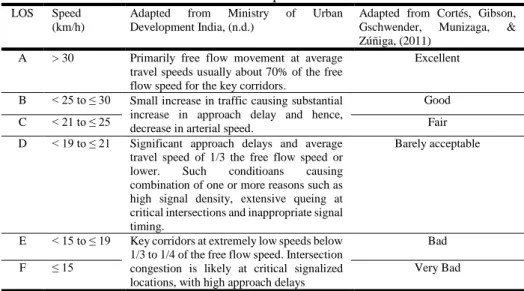
Table 6: Bus Speed LOS
LOS Speed (km/h)
Adapted from Ministry of Urban Development India, (n.d.)
Adapted from Cortés, Gibson, Gschwender, Munizaga, & Zúñiga, (2011)
A > 30 Primarily free flow movement at average travel speeds usually about 70% of the free flow speed for the key corridors.
Excellent
B ˂ 25 to ≤ 30 Small increase in traffic causing substantial increase in approach delay and hence, decrease in arterial speed.
Good
C ˂ 21 to ≤ 25 Fair
D ˂ 19 to ≤ 21 Significant approach delays and average travel speed of 1/3 the free flow speed or lower. Such conditioans causing combination of one or more reasons such as high signal density, extensive queing at critical intersections and inappropriate signal timing.
Barely acceptable
E ˂ 15 to ≤ 19 Key corridors at extremely low speeds below 1/3 to 1/4 of the free flow speed. Intersection congestion is likely at critical signalized locations, with high approach delays
Bad
F ≤ 15 Very Bad
Source: Adapted from Ministry of Urban Development India, (n.d.) and Cortés, Gibson, Gschwender, Munizaga, & Zúñiga, (2011)
Table 7 provides the threshold levels for each of the four measurements. Level D was determined as the minimum tolerable threshold for public transportation (State of Florida Department of Transport, 2013), whereas traffic engineers are familiar with Level C for private transportation systems (Clifton & Blohm, 2007; The City of San José, 2009).
Table 7: Acceptable Level of Service (LOS) Range
Determinant Minimum Range of Acceptable Level of Service (LOS) Fixed-route hour service D : Daytime service provided
Fixed-route Service Frequency D : Service unattractive to choice riders Passengers Thresholds D : Comfortable standee load for urban transit
Stage Bus Speed D : Barely acceptable
*All LOS below than acceptable range as above were determined as low or poor level of service.
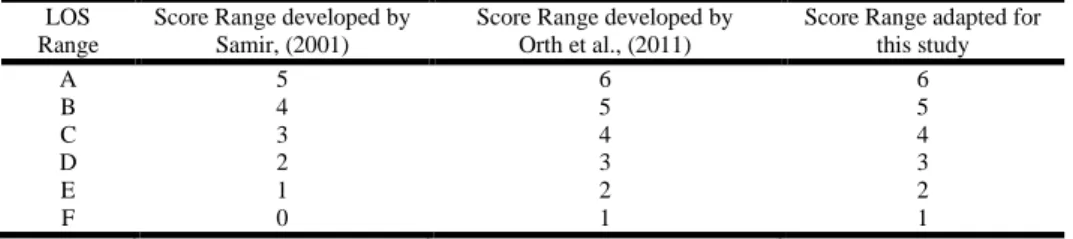
75 © 2015 by MIP Table 8: Score Range of Level of Service (LOS) Performance Measure Adaptation
LOS Range
Score Range developed by Samir, (2001)
Score Range developed by Orth et al., (2011)
Score Range adapted for this study
A 5 6 6
B 4 5 5
C 3 4 4
D 2 3 3
E 1 2 2
F 0 1 1
Source: (Orth et al., 2011; Samir, 2001)
FINDINGS AND DISCUSSION
Several findings were derived from the secondary and field surveys. First, the majority of the case studies have the bus services operated by a main provider or a single company operator, with the exception of Johor where multiple operators were servicing both the conurbations and rural settlements. Table 9 outlines the various operators by number of routes against geographical locations. The surveys were conducted on a total of 48 routes, 30 in urban areas and the remaining 18 in rural settlements. Disparities are glaring whereby most urban areas with the exception of Pulau Pinang have higher number of routes compared to those of rural.
Table 9: Bus Service Provider and Routes Coverage (Observed and Surveyed)
State Selected Case Studies Number of Routes Urban Settlement Rural Settlement Urban Rural
Perak
Main provider of bus consortium; Perak Transit Bhd Multiple private operators
Single Private Operator; The Red Omnibus Sdn. Bhd
6 3
Penang Main provider; Operator A 6 11
Pahang Main provider;RapidKuantan Single Private Operator;
Rahmat Alam Sdn. Bhd 12 2
Johor
Multiple Private Operators; Syarikat Maju Sdn. Bhd & CausewayLink Sdn. Bhd
Two Private Operator; CausewayLink Sdn. Bhd & Johore Motor Sdn. Bhd
6 2
TOTAL 30 18
© 2015 by MIP 76
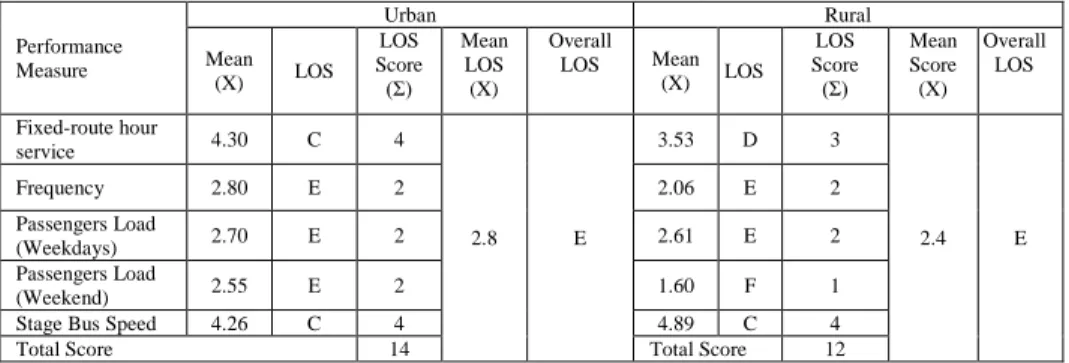
In contrast, two of the measurements applied on urban buses achieved better than the threshold at LOS C (for fixed route hour service and speed). The services of urban buses performed better than those or rural in passenger loads during the weekend. Performances in frequency and passenger loads during weekdays were comparable to those of rural areas.
Next, scoring measurement highlighted that there was a comparable scoring between services provided both in urban and rural areas. Nevertheless, scoring of rural areas (average 2.4 point) was lower than that of urban (2.8 points), indicating a mild disparity between urban and rural services.
Table 10: Summary of Mean Scores for LOS of Selected Urban-Rural Bus Services in Peninsula Malaysia
Performance Measure
Urban Rural
Frequency of LOS (W) LOS Score (Ʃ)
Mean LOS (X)
LOS
Frequency of LOS (W) LOS Score (Ʃ)
Mean LOS (X)
LOS
A B C D E F A B C D E F
Fixed-route
hour service 0 16 8 5 1 0 129 4.30 C 0 0 11 4 2 0 60 3.53 D Frequency 0 2 2 14 12 0 84 2.80 E 0 0 2 1 11 4 37 2.06 E Passengers
Load (Weekdays)
5 1 4 2 1 14 73 2.70 E 3 2 0 3 0 1
0 47 2.61 E
Passengers Load (Weekend)
1 2 0 2 0 6 28 2.55 E 0 0 0 1 1 3 8 1.60 F
Bus Speed 9 7 4 0 3 4 115 4.26 C 8 5 2 1 2 0 88 4.89 C * Score Range: A = 6, B = 5, C = 4, D = 3, E = 2, and F = 1.
Where:
1.
W= frequency of LOS obtained2. T = score range (A = 6, B = 5, C = 4, D = 3, E = 2, and F = 1.) 3. N = total case studies (routes surveyed)
4. X = mean LOS 5. LOS Score: Ʃ = W x T 6. Mean: (X) = Ʃ / N
The reflection of disparities between urban and rural bus services would inevitably influence the determination of route coverage, fare system and fleets provided by the operators (Rohani et al., 2013; Sham et al., 2013, 2012). As such, treatments of varying degrees should be initiated on performance of fixed routes hour services and passenger loads during weekends to bridge the services gaps experienced by the rural bus operations. More suitable operation hours and promotion of choice trips with higher bus frequency during weekends must be undertaken by operators of rural bus services.
77 © 2015 by MIP
The crush load situation (Level F, more than 1.5 capacity factor) has created uncomfortable and inconvenience riding experience for the passengers. It becomes worse during public holidays or special events/occasion when passenger volume was overloaded and severe traffic congestion occurred. Other contributing factors may include lower frequency of services on weekends as well as lower quality fleets were deployed in the rural areas.
It can also be discussed that in rural areas particularly, travel time became longer and the last bus trip was sometimes cancelled by the operators/drivers by choice or unintentionally because they already reached the maximum operation hours. In rural areas, more often than not, buses frequency was less desirable than those of urban. Furthermore, spiraling the effects of lower load, rural buses have less revenues and profit, thereby compromising the fleet quality and comfort/convenient (Transportation Research Board, 2013). The domino effects are less attractive services resulting in lower ridership levels and lower reliability of the services for the rural population. In the worst case scenario, this will result in the collapse and closure of certain routes, as have been deliberated by more than one of the operators.
Further discussion of the above three major findings is regarding the gaps of services between two geographical settings based on operating system (Ariffin & Zahari, 2013; Odeck & Alkadi, 2004; Patrick & Roseland, 2005; Rohani et al., 2013; Sham et al., 2013, 2012). In many rural areas and one or two urban bus services, delivery was by a single operator or a monopoly. This is a major factor that influences the lower and poorer quality of the service, leading towards less competitive or an imperfect market. In a market inequilibrium, passengers received less choices, limited exposure to higher quality services and normally being complacent or more receptive of the lower than appropriate levels of buses services quality. As such, morale and motivation to complaint about poor bus services were lower as propagated by many previous researchers (Aziz & Amin, 2012; Bachok, 2007; Ismail et al., 2012; Jayaraman et al., 2011; Kamba et al., 2007).
© 2015 by MIP 78
Table 10: Final Mean Score and LOS categorization for LOS of Selected Urban-Rural Bus Services in Peninsula Malaysia
Performance Measure
Urban Rural
Mean (X) LOS
LOS Score
(Ʃ) Mean
LOS (X)
Overall LOS Mean
(X) LOS LOS Score (Ʃ)
Mean Score (X)
Overall LOS
Fixed-route hour
service 4.30 C 4
2.8 E
3.53 D 3
2.4 E
Frequency 2.80 E 2 2.06 E 2
Passengers Load
(Weekdays) 2.70 E 2 2.61 E 2
Passengers Load
(Weekend) 2.55 E 2 1.60 F 1
Stage Bus Speed 4.26 C 4 4.89 C 4
Total Score 14 Total Score 12
* Score Range: A = 6, B = 5, C = 4, D = 3, E = 2, and F = 1.
Where:
1.
W= frequency of LOS obtained2. T = score range (A = 6, B = 5, C = 4, D = 3, E = 2, and F = 1.) 3. N = total case studies (routes surveyed)
4. X = mean LOS 5. LOS Score: Ʃ = W x T 6. Mean: (X) = Ʃ / N
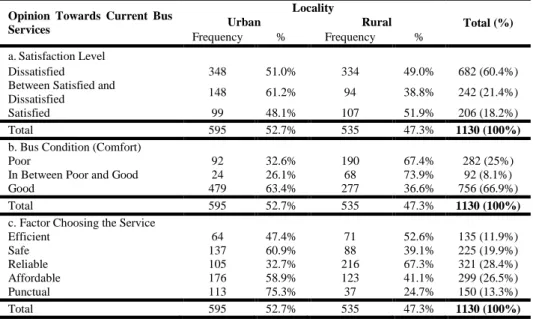
Table 11 depicts the satisfactory level disparities between urban and rural passengers. Passengers in the surveys have been asked to recall trips made using buses either previously or the ones that they were currently experiencing. From the Table, one of the many conclusions is that disparities between urban and rural were most dramatic in the bus conditions and punctuality. In rural areas, passengers were in the opine that bus conditions were poor (67.4%) compared to 32.6% rating by the urban riders. Rural population were also not choosing to ride the bus due to factor of punctuality (only 24.7%) compared to those in urban areas (75.3%).
Secondly, from Table 11, satisfaction levels were less varied but still distinguishable between urban and rural passengers. Whilst more urbanites were more dissatisfied with the services (51%) than rural riders (49%), the former believed that safety (60.9%) was a positive factor to attract urban passengers towards buses compared to rural passengers (39.1%).
79 © 2015 by MIP
Finally, rural people surveyed were also more complacent about the bus conditions, despite the lower quality of, comfort levels and convenience offered by the fleet by perceiving the conditions to be between poor and good (73.9%). Urban riders were very critical of this view, by recording only 26.1% response for this category.
Table 11: Bus Services Satisfactory Level between Urban and Rural Passengers
Opinion Towards Current Bus Services
Locality
Total (%)
Urban Rural
Frequency % Frequency %
a.Satisfaction Level
Dissatisfied 348 51.0% 334 49.0% 682 (60.4%) Between Satisfied and
Dissatisfied 148 61.2% 94 38.8% 242 (21.4%) Satisfied 99 48.1% 107 51.9% 206 (18.2%) Total 595 52.7% 535 47.3% 1130 (100%)
b. Bus Condition (Comfort)
Poor 92 32.6% 190 67.4% 282 (25%)
In Between Poor and Good 24 26.1% 68 73.9% 92 (8.1%) Good 479 63.4% 277 36.6% 756 (66.9%) Total 595 52.7% 535 47.3% 1130 (100%)
c. Factor Choosing the Service
Efficient 64 47.4% 71 52.6% 135 (11.9%) Safe 137 60.9% 88 39.1% 225 (19.9%) Reliable 105 32.7% 216 67.3% 321 (28.4%) Affordable 176 58.9% 123 41.1% 299 (26.5%) Punctual 113 75.3% 37 24.7% 150 (13.3%) Total 595 52.7% 535 47.3% 1130 (100%)
Table 12 shows further differences between urban and rural passengers by their disaggregated satisfaction levels.
Table 12: Passengers’ Satisfaction Level
Satisfaction Level Locality
Quality Issue % Within
Satisfaction Level According
Locality Punctuality
& Frequency
Comfort & Clean
Safety & Reliability
Dissatisfied Urban 141 (40.6%) 50 (14.4%) 156 (45%) 347 (30.7%) Rural 166 (49.6%) 75 (22.4%) 94 (28.1%) 335 (29.6%) Between Satisfied
& Dissatisfied
Urban 52 (45%) 27 (18.3%) 70 (36.7%) 149 (13.2%) Rural 47 (34.9%) 12 (18.1%) 34 (47%) 93 (8.2%)
Satisfied Urban 32 (50.5%) 25 (12.9%) 42 (36.6%) 99 (8.8%) Rural 52 (48.6%) 21 (19.6%) 34 (31.8%) 107 (9.5%) % within aspiration towards service
improvement 490 (43.4%)
210
© 2015 by MIP 80
One clear similarity that can be derived from the Table above is that urban and rural bus users put emphasis on punctuality and frequency (50.5% and 48.6% satisfied responses respectively). Safety and reliability are secondary to riders of both geographical locations (36.6% and 31.8% satisfied responses respectively) when choosing to utilise bus services.
Two glaring disparities between urban passengers compared to their rural counterparts are that the former were more dissatisfied with safety and reliability (45% compared to 28.1%) and while the latter were more dissatisfied with punctuality and frequency (49.6% compared with 40.6% agreeable responses respectively).
Table 12 provides further discussion on the differing treatments needed to improve the buses quality between the urban and rural services delivery. In rural areas, improvement aspired were more focused towards higher frequency and greater punctuality. Meanwhile, urban users were expecting more of safety assurance and reliability improvement with regards to the future bus services. Comfort and cleanliness were tertiary factors considered by passengers when evaluating the quality of the buses.
CONCLUSION
In summary, this study has identified Level of Service (LOS) as measurement tools for a quantitative assessment of bus services quality. The first objective of the study has been achieved by determining that the current services levels in Malaysia were LOS E which was lower than the threshold tolerated by many developed countries. Even more concerning is that there is a wide gap of services quality between urban and rural buses, namely the fixed hour service and passenger loads (weekend) i.e. LOS D and F respectively for urban areas compared to LOS C and E respectively for rural areas. The rural buses suffered from lower passenger’s number and poorer fleet quality.
The second objective of the study was to ascertain the areas of improvements as aspired by the urban as oppose to rural passengers. It can be concluded that urbanites were more concerned about safety and reliability due to trips being made even during late hours while the rural passengers were emphasising on punctuality and frequency because services frequencies were lower and quality fleets have less capability to perform strictly adhering to published schedules.
81 © 2015 by MIP
performances in urban and rural buses (Aziz & Amin, 2012; Bachok, 2007; Ismail et al., 2012; Jayaraman et al., 2011; Kamba et al., 2007), but also proved that the magnitude of such disparities are glaring especially in the improvements aspired by the passengers. Rural respondents were dissatisfied with buses frequency and punctuality but urbanites were more concerned with safety and reliability. This finding is coherent with the literature on regional disparities of buses services worldwide (Odeck & Alkadi, 2004; Pucher & Renne, 2013).
In conclusion, capital planning, infrastructure instalment and subsystem improvements are essential in the longer term planning of public transport system development. City region public transport operation, management and structure must be supported with a mature and more appropriate sustainable public transport provision guidelines and standards; through strict evaluation and proper use of indicators. Improving rural buses quality is of great importance because many services are facing dire issues, with more routes were susceptible to closure in the future should patronage continued to dwindle.
© 2015 by MIP 82
REFERENCES
Abdullah, A. Z. (2006). Predicting the Impact of Demand- and Supply-Side Measures on Bus Ridership in Putrajaya, Malaysia. Journal of Public Transportation, 9(5), 57–70.
Ariffin, R. N. R., & Zahari, R. K. (2013). Towards a Sustainable Urban Transport System in the Klang Valley, Malaysia: The Key Challenges. Procedia - Social and Behavioral Sciences, 85, 638–645. http://doi.org/10.1016/j.sbspro.2013.08.391
Aziz, A. A., & Amin, N. F. M. (2012). Transforming the Land Public Transport System in Malaysia.
JOURNEYS, (May), 30–37.
Bachok, S. (2007). What Do Passengers Need Out Of Public Transport Information Systems ? What Do Passengers Information Systems. In CAITR-2007, 29th Conference of Australian Institutes of Transport Research. Transport System Centre (TSC). 1–13.
Bailey, A. J. (1986). Regulatory reform and rural bus service: Evidence from South Dakota. Socio-Economic Planning Sciences, 20(5), 291–298. http://doi.org/10.1016/0038-0121(86)90038-8 Bell, P., & Cloke, P. (1991). Deregulation and Rural Bus Services - a Study in Rural Wales. Environment
and Planning A, 23(1), 107–126. Retrieved from <Go to ISI>://A1991EZ09800007
Chen, X., Yu, L., Zhang, Y., & Guo, J. (2009). Analyzing urban bus service reliability at the stop, route, and network levels. Transportation Research Part A: Policy and Practice, 43(8), 722–734. http://doi.org/10.1016/j.tra.2009.07.006
Cinquina, A. (2006). Sustainable public urban transport systems:The case of Curitiba. Lunds Universitet. Clifton, K. J., & Blohm, A. (2007). Vehicle Level of Service in Transit Station Areas : A Survey of Current
Practice.
Cortés, C. E., Gibson, J., Gschwender, A., Munizaga, M., & Zúñiga, M. (2011). Commercial bus speed diagnosis based on GPS-monitored data. Transportation Research Part C, 19(4), 695–707. http://doi.org/10.1016/j.trc.2010.12.008
Creswell, J. W. (2009). Research Design: Qualitative, Quantitative and Mixed Methods Approaches (3rd ed.). SAGE Publication Ltd.
Currie, G., & Delbosc, A. (2014). Assessing Bus Rapid Transit system performance in Australasia.
Research in Transportation Economics, 48, 142–151. http://doi.org/10.1016/j.retrec.2014.09.012
Dandapat, S., & Maitra, B. (2015). An approach for identifying optimal service for rural bus routes. Case Studies on Transport Policy, 3(3), 287–294. http://doi.org/10.1016/j.cstp.2014.09.003
Department of Statistic Malaysia. (2014). Intercensal Mid-Year Population Estimates. Retrieved from http://www.statistics.gov.my/portal/download_Population/files/Anggaran_Penduduk_Pertenga han_Tahun_Antara_Banci2001_2009.pdf
Federal Department of Town and Country Planning Ministry of Housing and Local Government of Malaysia. (2010). Second National Physical Plan (NPP-2).
Hayashi, Y., Doi, K., Yagishita, M., & Kuwata, M. (2004). Urban Transport Sustainability : Asian Trends , Problems and Policy Practices. EJTIR, 4(1), 27–45.
Hidding, M. C., & Teunissen, a. T. J. (2002). Beyond fragmentation: New concepts for urban-rural development. Landscape and Urban Planning, 58(2-4), 297–308. http://doi.org/10.1016/S0169-2046(01)00228-6
Hook, W. (2006). Urban Transportation And The Millennium Development. Global Urban Development, 2(1), 1–9.
Ismail, R., Hafezi, M. H., Nor, R. M., & Ambak, K. (2012). Passengers Preference and Satisfaction of Public Transport in Malaysia. Australian Journal of Basic and Applied Sciences, 6(8), 410–416. Jaramillo, C., Lizárraga, C., & Grindlay, A. L. (2012). Spatial disparity in transport social needs and public transport provision in Santiago de Cali (Colombia). Journal of Transport Geography, 24, 340–357. http://doi.org/10.1016/j.jtrangeo.2012.04.014
83 © 2015 by MIP
Kamaruddin, R., Osman, I., Anizaliana, C., & Pei, C. (2012). Customer Expectations and its Relationship Towards Public Transport in Klang Valley. Journal of ASIAN Behavioural Studies, 2(5), 29–38. Kamba, A. N., Rahmat, R. A. O. K., & Ismail, A. (2007). Why Do People Use Their Cars : A Case Study
In Malaysia, 3(3), 117–122.
Land Public Transport Commission (SPAD). (2011). Greater Kuala Lumpur/Klang Valley Land Public Transport Master Plan: Travel Demand Management Plan. Klang Valley.
Land Public Transport Commission (SPAD). (2012). National Land Public Transport Masterplan. Ministry of Transport Malaysia. (2014). Ministry of Transportation. Retrieved from
http://www.mot.gov.my/my/Pages/Default.aspx
Ministry of Urban Development India. (n.d.). Service Level Benchmarks for Urban Transport at a Glance.
Napiah, M., Farid, amirah suriati A., & Suwardo. (2010). Trip Productibity Evaluation of Bus Service: Medan Kidd Bus Station. In Proceeding of Malaysia Universities Transportation Research Forum and Conferences 2010 (MUTRFC2010) (Vol. 2010). Universiti Tenaga Nasional, Malaysia. 1-10.
Noor, H. M., Nasrudin, N., & Foo, J. (2014). Determinants of Customer Satisfaction of Service Quality: City Bus Service in Kota Kinabalu, Malaysia. Procedia - Social and Behavioral Sciences, 153, 595–605. http://doi.org/10.1016/j.sbspro.2014.10.092
Nor, A. R. M., & Nor, N. G. M. (2006). Empowering Public Transport for Urban Environmental Management. Malaysian Journal of Environmental Management, 7, 93–111.
Odeck, J. (2006). Congestion, ownership, region of operation, and scale: Their impact on bus operator performance in Norway. Socio-Economic Planning Sciences, 40(0038), 52–69. http://doi.org/10.1016/j.seps.2004.05.001
Odeck, J., & Alkadi, A. (2004). The performance of subsidized urban and rural public bus operators: Empirical evidence from Norway. The Annals of Regional Science, 38(3), 413–431. http://doi.org/10.1007/s00168-003-0152-y
Olsson, J. (2012). Rural-urban spatial interaction in the global south: Long-distance mobility changes, desires and restrictions over two decades in rural philippines. Geografiska Annaler, Series B: Human Geography, 94(3), 287–304. http://doi.org/10.1111/j.1468-0467.2012.00415.x Orth, H., Dorbritz, R., & Weidmann, U. (2011). Public Transport Capacity and Quality – Development
of an LOS-Based Evaluation Scheme Public Transport Capacity and Quality – Development of an LOS-Based Evaluation Scheme. In 11th Swiss Transport Research Conference. Monte Verita, Ascona. 1-16.
Patrick, R., & Roseland, M. (2005). Developing sustainability indicators to improve community access to public transit in rural residential areas. Journal of Rural and Community Development, 1, 1– 17.
Ponnaluri, R. V. (2011). Sustainable Bus Rapid Transit initiatives in India : The role of decisive leadership and strong institutions. Transport Policy, 18(1), 269–275. http://doi.org/10.1016/j.tranpol.2010.08.010
Pucher, J., & Renne, J. L. (2013). Urban-Rural Differences in Mobility and Mode Choice: Evidence from the 2001 NHTS. Journal of Chemical Information and Modeling, 53, 1689–1699. http://doi.org/10.1017/CBO9781107415324.004
Rohani, M. M., Wijeyesekera, D. C., & Karim, A. T. A. (2013). Bus operation, quality service and the role of bus provider and driver. Procedia Engineering, 53, 167–178. http://doi.org/10.1016/j.proeng.2013.02.022
Roslan, A. H. (2001). Income inequality, poverty and development policy in Malaysia. In Conference on Poverty and Sustainable development, (Vol. 4).
Royce A. Singleton, J., & Straits, B. C. (2010). Approaches to Social Research (5th ed.). Oxford University Press.
© 2015 by MIP 84
Santoso, D. S., Yajima, M., Sakamoto, K., & Kubota, H. (2012). Opportunities and strategies for increasing bus ridership in rural Japan: A case study of Hidaka City. Transport Policy, 24, 320– 329. http://doi.org/10.1016/j.tranpol.2012.09.005
Sarantakos, S. (2005). Social Research (Third). Palgrave Macmillan.
Sham, R., Samsudin, N., & Rahman, K. (2013). Managing Public Transport Service Operation in Reducing Travel Fear Factor. Procedia - Social and Behavioral Sciences, 101, 338–344. http://doi.org/10.1016/j.sbspro.2013.07.208
Sham, R., Soltani, S. H. K., Sham, M., & Mohamed, S. (2012). Travel Safety Fear Factor among Vulnerable Group of Travelers: The Urban Scenario. Procedia - Social and Behavioral Sciences, 50 (July), 1033–1042. http://doi.org/10.1016/j.sbspro.2012.08.103
Siong, H. C. (2008). Urban Governance and Rapid Urbanization Issues in Malaysia. Jurnal Alam, 13(4), 1–24.
State of Florida Department of Transport. (2013). 2013 Quality / Level of Service Handbook.
Suruhanjaya Pengangkutan Awam Darat (SPAD). (2014a). No Title. Retrieved from http://www.spad.gov.my
Suruhanjaya Pengangkutan Awam Darat (SPAD). (2014b). SHE Code of Practice (COP). Retrieved from http://www.spad.gov.my/function/she-guidelines
Suwardo, Napiah, M. B., & Kamaruddin, I. B. (2008a). Puncuality and Expected Waiting Time of Stage Buses in Mixed Traffic. Jurnal Transpotasi, 8(Edisi Khusus No. 3), 213–226.
Suwardo, Napiah, M. B., & Kamaruddin, I. B. (2009). On-Time Performance and Service Regularity of Stage Buses in Mixed Traffic. International Journal of Civil, Architectural Science and Engineering, 3(7), 1–8.
Suwardo, Napiah, M., & Kamaruddin, I. B. (2008b). Review on Motorization and Use of Public Transport in Perak Malaysia: Realities and Challenges. In 2nd International Conference on Built Environment in Developing Countries (ICBEDC2008).
The City of San José. (2009). Traffic Impact Analysis Handbook: Volume 1 - Methodologies & Requirements (Vol. I).
Thompson, E. C. (2004). Rural villages as socially urban spaces in Malaysia. Urban Studies, 41(12), 2357–2376. http://doi.org/10.1080/00420980412331297573
Transportation Research Board. (2003). Part 3 Quality Of Service Contents. In Transit Capacity and Quality of Service Manual 2nd Edition. 3–i to 3–94.
Transportation Research Board. (2013). Part 2 Bus Transit Capacity. In Transit Capacity and Quality of Service Manual Third Edition. 2–1 to 2–96. Retrieved from http://www.trb.org/main/blurbs/169437.aspx
Yaakub, N., & Napiah, M. (2011a). Public Bus Passenger Demographic and Travel Characteristics. IEEE, 1–6.
Yaakub, N., & Napiah, M. (2011b). Public Transport : Punctuality Index for Bus Operation. World Academy of Science, Engineering and Technology, 60, 857–862.
Yamane, T. (1967). An Introductory Analysis. (Second Edition). New York: Harper and Row.