PLANNING MALAYSIA
Journal r?f the Aialaysia11 Institute oj'P/a1111ers (2009) \'II, 83 - I l 0
AN INTEGRATED APPROACH FOR THE
PREDICTION OF WATER QUALITY INDEX BASED
ON LAND USE ATTRIBUTES USING DATA
GENERATION METHOD AND BACK PROPAGATION
NETWORK ALGORITHM
Abstract
Faris Gorashi1 and Alias Abdullah'
Kulli)~Fah c~.lArchitecture and E11viro11111e11tal Desig11 INTERNATIONAL ISLAMIC UNIVERSITY MALA YS!A
Malaysian experts have \varned that several n1ajor cities, including the capital Kuala Lu1npur, could face serious \Vater shortages due to over-pollution of the country1s rivers by problen1s brought about by over-develop111ent. As 97 per cent of Malaysia's \Yater supply is sourced fro111 surface \.vater, the 1nain ai1n of this study \Vas to identify a relationship bet\veen water quality and land use attributes. The study \Vhich \Vas conducted on Go1nbak River and its \vatershed in Malaysia, introduced data generation method for the prediction and forecast of LU/LC data within the watershed. The method used exponential n1odel equation, Lagrange 111odel equation third & fourth degree polynon1ial fit; saturation gro\vth-rate niodel in order to generate the required data: and artificial neural net\vork's back propagation network algorith111. The study also introduces the LA-WQI 111odeL This 111odel was developed by associating the appropriate loading factors to a set of sub indices. The findings revealed that as the activities increased throughout the watershed, the values of WQI quality decreased accordingly. The accuracy of prediction of the proposed LA-WQI ranged from 94.3% to 99.3% between Actual DOE-WQI and LA-WQI for station 18 in Gombak River. The results of predicted WQI obtained using LA-WQI, showed a continuous decrease of water quality. Despite the high accuracy attained by the application of LA-WQI model on Gon1bak River; it has not yet been tested on other rivers. It is reco111111ended that future studies should be able to further test the current 111odel on a regional scale.
Keywords: Water Quality Index, ANN, Gombak River, Back Propagation, Land-Use Data Generation
1
Ph.D./Doctoral Student, Kulliyyah of Architecture and Environmental Design (KAEO), International Islamic University Malaysia (Email: [email protected]) 2 Professor, Departn1ent of Urban and Regional Planning, Kulliyyah of Architecture
and Environmental Design (KAED), International Islamic University Malaysia (Email: [email protected] I [email protected]).
Faris Goroshi and Alias Abdullah
An lmegratcd Approach for the Prediction of IVater Quality Index based 011 Land U~e Aflrilmtes U1'ing Data Ge11cralio11 1\/ethod and Bae/:. Propagation Nc111·or/:. Algorithm
INTRODUCTION
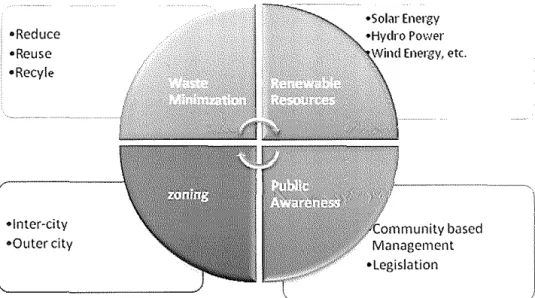
In Malaysia there are 189 river basins nationwide. Out of 189 river basins, 120 rivers are being monitored by the Department of Environment (DOE). There are 926 monitoring stations for these rivers. According to the Department of Environment (44.5% are clean, 48.4 % slightly polluted and 7.1% are polluted. Generally, stations located upstream are clean, while those located downstream are either polluted or slightly polluted. The main cause of pollution of these river basins is over-development on the rivers' catchment area. The growth of urban areas has led to many problems, and any attempt to plan and manage the urban environment will ultimately have to be concerned with the entire city system and its interdependence with its rural hinterland, other city systems and the outside world as a whole. A prime goal of planning is to achieve efficiency in the utilization of resources with the objective of creating a high level of environmental quality for healthy living. Where urbanization is unstoppable and useful most of the time, the best management practices (BMP) serves to match both the necessity of mankind to innovate and high level of environmental quality. Some of the essential factors for BMP are shown in Figure 1.
•Reduce •Reuse •Recy!e
•lnter~city
•Outer city
•Solar Energy
•Legislation
Figure 1: Suggested factors for improving best management practice in town planning
PLANNING iUALAYSIA
.!011r11al of the Aialaysia11 fllsti/11/e of Planners (2009)
These factors constitute a necessary condition, but alone it is not enough. Usually decisions made at the upper level of the decision hierarchy,
significantly change the land use zoning patterns3. Rapid development in
peninsular Malaysia has begun to put a strain on existing water resources. Environmental problems such as flash floods and heavy sedimentation are often associated with development activities within the basin. Water pollution also arises due to intensive land clearing, uncontrolled earthworks, mining and logging activities in water catchments area. The state of Selangor can be considered as one of the fastest developing states in Malaysia. Rapid development is one of the major reasons in causing water pollution.
RELATED WORK
The study of the relationship between water quality and urbanization is not new.
Wang (2001 )4 examined how the form and rate of urbanization influence water
quality through examining the effect of density and industrial activities on a
range of water quality classifications. Work in Evans & Miller (1988)5
provided an examination of the spatial variation to water quality across an entire watershed. The findings of researches reveal a strong relationship between the degradation of water quality and urban land use. While a number of studies (Goodchild & Stevaert, 1993)6, (Engel et al., 1993)7, (Carr & Chamber, 1998)8,
3
Alias Abdullah, Kazuhisa IKI and Morozumi Mitsuo, 1994. A study to evaluate change of zoning in GIS operation due to the diversification of the AHP judgment, Proceeding o.f the Sixteenth Syn1posiu111 on Conzputer Technology of l1~forn1ation, System and Applications, AIJ, S-5-6, pp. 349-354.
4
Wang X., 2001. Integrating Water-Quality Management and Landuse Planning in a
Watershed Context, Journal o.f environn1ental 111anage111e11t, 61, pp. 25-36.
5Evans, B. M. and D. A. Miller, 1988. Modeling Nonpoint Pollution at the Watershed
Level with the Aid ofa Geographic Information System, In Nonpoint Pollution: !988 -Policy, Econon1y, Ma11age111ent, and A11propriate Technology, An1erican Water Resources Association, pp. 283-290.
6
Goodchild, M. F., B. 0. Parks, and L. T. Steyae1t, (eds.) 1993. Geographic Information Syste111s and Environn1e11tal Modeling, Oxford University Press, New York, pp. 231-237.
7
Engel, B. R., R. Srinivasan, J. Arnold, C. Rewerts, and S. J. Brown, 1993. Nonpoint Source (NPS) Pollution Modeling Using Models Integrated with Geographic Information Systems (GIS). Water Science and Technology, Vol. 28, No. 3-5, pp. 685-690.
8
Carr, G.M. and P.A. Chan1bers, 1998. Spatial and te111poral patterns of nutrients and
algal abundance in Alberta rivers. Report prepared for the Prairie Provinces Water Board, Regina, SK.
fi1n.1· Goroshi and Alia_> Ahduf/oh
,-/11 !111cgrarcd Approach for the l'redh rum o( Water Quali(r Index hased 011 taml Use A11rih111c.1 l'.1ing Data Gl'm.Ta/1011
\ktlwd mu! Bad. l'ropaga/wn .\'ct\\ork .!lgorilhm
(Corell et al., 2001 )"and (Tong & Chen, 2002)10 concluded that land use has a direct effect on the deterioration of water quality of rivers through point and non-point effluent discharges, few have dealt specifically with the relationship that defines this relationship. Generally, river systems are polluted by point and non-point sources. Currently, there are very little effo1ts directed towards nionitoring point sources in Malaysia. Monitoring of all point and non-point is very difficult or impossible to achieve; whereas the procedure is costly, time consuming and needs a large body of manpower. Thus the need for indirect approaches has grown widely in the recent years. ln order to obtain an accurate assessn1ent of spatial and ten1poral variation of land use, using \Vater quality as a key indicator, many studies of modeling using different approaches has been attempted in recent years. Hubert-Moy et al.11 used Dempster-Shafer theory of evidence to predict land use and land cover, however the differences bet\veen prediction and reality \Vere associated \Vith uncertainties \vhich is of great interest to the expert. Non predicted changes \vere due to unexpected transformation of land use. Generally, the model produced was unable to elin1inate the anon1alies associated \vith the prediction. In a later research. (Smith et al., 2003)" developed an approach using LandSat imagery, trained with high resolution data sets. These data sets identified the impervious surface area at sub-pixel resolution. The data were then used in a time series spatial predictive model using Monte Carlo's approach. The model simulated urbanization in four \vays, as edge gro\vth, spreading urban centers, road induced growth and spontaneous growth. The first look of the results taken from this model shows good monitoring techniques used, however the prediction model is limited to the probabilistic categorization and assumptions initiated by the author.
9
Correll, D.L., Jordan, T.E.. and D.E. Weller. 2001. Effects of precipitation. air
te1nperature, and land use on organic carbon discharges fron1 Rhode River \Vatersheds. Water, Air and Soil Pollution, 128, pp.139-159.
10
Tong, S. T. Y. and \V. Chen. 2002. Jvlodeling the relationship bet\veen land use and surface \Yater quality, Journal o.lE11viro11111e11tal A1anagenzent. 66, pp. 377-393.
"Hubert-Moy. L.. Cotonnec, A .. Le Du, L.. Chardin, A .. and Perez, P. (eds). 2001 .. ·I
('0111pariso11
o.l
Class(/ication ]Jrocedures of Renzote Sensed Data Applied 011 D(ff'erent Landscape Units, Re111ote Sensing o.Fthe E11l'iro11111ent. Elsevier, Vol. 75, No. 2, pp. 174-187.12
Smith, A. J .. Goetz, S.D., Prince, R. and Wright, B., 2003. Estimation of sub-pixel
in1pervious surface area using a decision tree approach, Renzote Sensing q( The Enviro11111ent, (in press).
PLANNING' 11/ALA YSIA
Jo11r11al 11{1he Alalay.l'it111 !11s1i1me of Pla1111c1:~ (!009)
W. Ren et al. (2003)13 examined the water quality of Huangpu River in China, and land use of the same river watershed, their study revealed the correspondence of deterioration of water quality with respect to the rapid urbanization. The authors took a period of 50 years to analyze their data, and concluded that there is a strong indication of influence of the industrial land use on the changing of the water quality of the river. However the type and nature
of industrial activities, changing technologies and the factors affecting the water
quality were not explored in their study. In another study, Noorazuan et al. (2003)14 applied GIS in evaluating the change in land use and its impact on the stream flow of Langat River in Malaysia. The study revealed the landscape diversity of Langat significantly altered the Langat's stream flow response. Although the study has given acceptable results of the change of stream flow which was 20.35% in l 983 - 1988 to about 31.4 in 1988 - 1994, the stream flow and characteristics were not included within the study scope.
Based on the complexity of the alteration of water quality, simulation Models have always been good practice to simulate real-time situations with controlled variables; However for water quality response the behavior of water quality characteristics changes is a non-linear one. Kadri, et al. (2004)15 attempted a stochastically based approach model in order to predict daily maximum stream flow. Stochastic models can be used to predict water quality as well, but most of the conventional statistical models are based on the assumption that the observations are independently distributed in time. The occurrence of the event is assumed to be independent of all previous events. This assumption is not always valid for hydrologic time series. Chandra (2003) "' used mass budget regression model in order to extract percentages of pollutants from point and non-point sources from the upstream to the downstream of Krishna River in India. Although the recent development on regression models for the prediction of pollutant loads can give more acceptable results, such models could only be useful in predicting the physical water
13Wen,vei Ren, Yang Zhong. John ivieligrana, Bruce Anderson, W. Edgar Watt Jiakuan
Chen, and I-Jok-Lin Leung, 2003. Urbanization, Land use, and Water Quality in
Shanghai, E11viron111e11! International, 29, Elsevier, pp. 649-659.
14Noorazuan M. H.
Ruslan Rainis, Hafizan Huahir, Sharifuddin, M. Zain, and Nazari
Jaafar, 2003. GIS Application in Evaluating Land use - Land Cover Change and its
linpact on the Hydrological Regin1e in Langat River Basin, Malaysia, iV!a11 Asia
Co1?ference 2003. GISdevelopn1ent.net.
15Kadri, Yurek!L Ahn1et Kurunc, and I-Iuseyin Sin1sek, 2004. Prediction of daily Strea111
Flo\v Based on Stochastic Approaches, Journal o_fSpatial Hydrology, Vol. 4, No. 2.
16
Sekhar M. Chandra, and Sreenivasulu, 2003. Modeling Nutrients Contributed by
Overland Flow Fro1n the Krishna River Basin, D(ffitse Pollution Conference, Dublin, Water Resources Manage1nent, IA, pp. 20 - 23.
Faris Goroshi and Alias Abd11/f11h
An Integrated Approach for rhe Predicrion of !Valer Qua/iry Index based 011 Land Use A11rib11tes Using Dala Ge11erario11 1\ferhod and Back Propagation Network Algorithm
quality parameters. Other pollutants such as constituents that undergo chemical transformation, alteration, degradation and I or volatilization cannot be assessed using this approach as it will not give accurate segments unless the distance between the upstream and the downstream is negligible, which is impossible in practice.
The same author (Chandra, 1995) 17 had attempted earlier modeling of land use and water quality. In his study the author focused on the cause-effect principal. Using the mass budget from non-point sources discharges compared to existing land use. The results were concluded as percentage output. Theoretically this method could give good results in a controlled environment; however the application of this model on surface water could give a very false statuesque. This approach is an indicative one and needs more development. Most of land use change studies have mainly dealt with the analysis and modeling of land use change18. Simulation models had always been good
practices to model a real time situation with controlled variables, however, due to the complexity of water response/behavior in rivers, analysis of data recorded or generated, suffer to understand this complexity. In a study on recreational zoning development, Alias et al., (1994) 19 concluded that zoning map and policy can be effectively developed through a quantitative spatial analysis.
In recent years, geographic information systems (GIS), artificial neural network (ANN) and fuzzy logic techniques have been used in several hydrological studies. However, few of these research studies have undertaken an extensive sensitivity analysis (Dixon, 2004)20.
17
Sekhar, M. Chandra, and P. Anand. Raj, 1995. Land Use Water Quality Modeling,
Journal Of Water Science Technology, Vol. 31, No. 8, !WA Publishing, pp.383-386. 18
Ruslan Rainis, 2003. Application ofGIS and Landscape Metrics in Monitoring Urban
Land Use Change. "Urban Ecosystem Studies in Malaysia. A Study of Change'', Noorazuan Md Hashim & Ruslan Rainis (eds.), Universal Publishers, pp 267 -278.
19
Alias Abdullah, Kazuhisa !Kl and Mitsuo Morozumi, 1994. An integrated approach of AHP and GIS application to analyze and develop recreational zoning, Journal of
Architecture Planning and Enviro11111ental Engineering, AIJ, No. 463, pp. 213 - 222.
20
Dixon, B., 2004. Applicability of Neuro-Fuzzy Techniques Jn Predicting Ground Water Vulnerability: A GIS-based sensitivity analysis, Journal of Hydrology, published by Elsevier B. V. doi: I 0. I 016/jhydrol.2004. I 1.010. Retrieved online on 22/04/2005. http://www.sciencedirect.cotn
Artificial Neural Network (ANN)
PLANNING 1l1ALA YSIA Journal of the Alalaysia11 /11slilu/e of P/a1111ers (2009)
The concept of artificial neurons was first introduced in 1943. Artificial Neural Network is a network of interconnected elements. These elements were inspired from studies to simulate the biological brain. The purpose of Artificial Neural Network is to learn to recognize patterns in ones data. Once the Neural Network has been trained on samples of data, it can make predictions by detecting similar patterns in future data ((Cormac, 1999)'1 and (Picton, 1994)22). Mostly used neural networks are SFAM algorithm, where one attempts to predict the class or category for a given pattern. The architecture of the network was better explained in a previous study by the authors23. Other widely used neural
network is the Back Propagation Neural Networks and sometimes called Feedback Network. This method can predict the variable quantity with high precision, for example the concentration of a certain parameter. The algorithm makes its prediction as numeric values, not as class names. It is best suited for predicting continuous numerical values such as water quality data.
Training an ANN is a mathematical exercise that optimizes all of the ANN's weight and threshold values using some fractions of the available data. Neural networks serve to provide researchers with empirical models of complex system from which they can begin to unravel the underlying relationships and come to a more complete understanding of the environment. The most commonly used activation function within the nodes is the logistic sigmoid function, which produces output in the range of 0-1 and introduces non-linearity into the network, which gives the power to capture non-linear relationships between input and output values. The logistic function was used in this work in the form given below.
While many statistical and empirical models exist for water quality prediction, artificial neural network (ANN) models are increasingly being used
21
Corn1ac Technologies Inc., 1999. Manual, NeuNet Pro, Revision 2.2. Connac
Technologies Inc. (http://www.cormacteeh.eom/Neunet) 22
Picton, P. D., 1994. lntroducNon to neural netivork, The Mac1nillan Press Ltd:
London.
23Faris, F.G. & Alias A., 2008. A Study on the Water Quality of Gombak River Using
Artificial Neural Network, Al-Rissala Journal, International Islan1ic University
Malaysia (In press).
Fari.1· Gorosfli and Alias Ahd11!111Jz
An lmcgratcd Approach /Or the Prediction rf Irater Q11alitr lmh~,. hascd on Land U~c A11rib111cs Using Data Gc11cratw11 J/ct/10d and Back Propagation Xe111-ork Afgorilhm
for forecasting of water resources variables because ANNs are often capable of modeling complex systems for which behavioral rules are either unknown or difficult to simulate. Hafizan et al., (2004 )14 mentioned "previous studies have shoH'n that ANN 1J10(/els pe1jOr111 H'ell in JJredicting short and !011g-ter111 environmental data". Loke et al., ( 1997)25 concluded that ANNs can deal with problems that are traditionally difficult for conventional modeling techniques to solve. ln recent years, artificial neural networks were successfully applied in the area of water quality modeling. The use of ANN model was to be better than other simulations and commonly used statistical models'" due to the complex inter-related and non-linear relationships between multiple parameters. However, modeling applications for water quality response due to land use attributes are generally more difficult due to the complexities in environmental distribution, mobility and number of point and non-point sources of waste discharge.
Junaidah et al., (2004)27 concluded that the model derived using MLR technique gave a better prediction than the model derived using ANN in a study on sediment prediction, However, this statement can be debatable depending on the complexity of the model itself. Water quality responds to myriad stimuli and reactions. Many chemical constituents are involved either naturally or synthetically. The model of which cannot be treated in a linear manner. ANN is intended to be used with problem of complexity. A later study by Stewart"
241-Iafizan Juahir, Sharifuddin M. Zain, Zainal Ahn1ad. Nazari M. Jaafar. 2004. An
Application of Second Order Neural Net\vork Back Propagation Method in Modcling River Discharge. In H1ater E11vironn1ental Planning: ToH'ards Integrated Planning and
i\;/a11age111e11t o_l H1aler Resources jbr E11viro11111e11tal Risks. Alias Abdullah, Norio
Okada, and Mohd Ka1nil Yusoft~ eds., International Isla1nic University Malaysia, pp. 307-324.
°'Lake, E .. Warnaars E. A., .Jacobsen P., Nelen F. and Ceu Almeida M., l 997. Artificial Neural Net\vorks as a tool in Urban Stonn Drainage. Journal o_f" l·Vater Science and
Technology, Vol. 36. Issues 8-9, pp. !Ol-109.
26
Diane l'v1. L., David P. A .. 2004. Use o_f" Art{ficial 1Veural 1VetH·ork A1odels to Predict Indicator Orga11is111s Concentrations in an Urban rVatershed, AGU. 85( 17), Joint Assembly Suppl.. Abstract H53A-06 l 330h POSTER.
27
Junaida Ariffin, An1inuddin Abdul Ghani. Nor Azazi Zakaria, and Ah1nad Shukri Yahya, 2004. Sedin1ent Prediction Using ANN and Regression Approach, Proceedings o.f' the /'11 International Co1?f'ere11ce 011 i\1anaging Rivers in the 2 I11 Ce11t1u:v: Issues & Chanlenges, Malavsia, pp. !68-174.
28
Ste\vart A. Rou;1ds, 2002. Develop1nent of a Neural Net\vork Model for Dissolved Oxygen in the Tunlatin River, Oregon, Proceeding o_f' the second J~dera/ lnterage11c:r 1-!ydrologic Modeling Co1!f"erence, Las Vegas, Nevada, July 29 ~ August 1, 2002 Subcom111ittee on Hydrology of the interagency Advisory Con1111ittee on Water Resources.
{J 2009 hy Al/P
PLANNING JlfALAYSIA
.!011r11a/ oflhe /vlalaysia11 !11sti1111e of Pla1111ers (2009)
revealed that a multiple linear regression may be viewed as a special case ANN model that uses linear transfer functions and no hidden layers. If the linear model performs as well as a more complex ANN, then using the nonlinear ANN may not be justified; however the optimization of the ANN model revealed a markedly better prediction than the MLR model in a study to predict the concentration of dissolved oxygen in a river. In addition multiple linear regression models failed to capture the long term patterns; however ANN model was successful in predicting those patterns (Zou et al., 2002)29.
A study done by Kamarul and Ruslan (2004)30 concluded that ANN
could become a useful modeling method, as alternative to actual data collection, thus is the best choice for the government to manage water resource issues. The study uses existing raw water quality data from official sources and related to eight land uses categories i.e. residential, industrial, commercial, public utilities, recreational, institutional, and forest. In this study the authors used the Simplified Fuzzy Adaptive Resonance Theory Map [SFAM]. The SFAM logic output was according to classes of water quality. Although the findings were well correlated, nevertheless, the wide range of water quality classes will not give an accurate forecast in terms of a particular water quality parameter. Using a different approach such as back propagation could have given more precised findings.
CASE STUDY
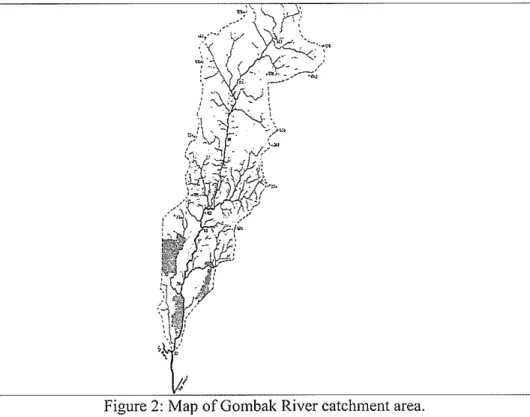
The study area of this research is Gombak River. Gombak River is situated mainly in the Gombak District in Selangor state and its lower zone is situated in
the Malaysian Capital Kuala Lumpur. The River is a slow flowing one, which originates from many tributaries in the Gombak district. The river has several confluences with other streams such as Batu River, Untut River, and Kelang River in the Hea1t of Kuala Lumpur. Figure 2 shows a map of the Gombak River Catchment area. The catchment area within which the river passes through, has grown quite rapidly since early 1970s and is expected to continue growing in the future. The topography of the watershed area, as it is surrounded
29
Zou, R., Lung, W.S., and Guo, H., 2002, Neural Network Embedded Monte Carlo Approach for Water Quality Modeling Under Input Information Uncertainty, Journal of Computing in Civil Engineering, ASCE, 16 (2), pp. 135-I42.
3°Kan1arul Isrnail, and Ruslan Rainis, 2004. Modeling River Water Quality Index Using
Artificial Neural Networks and Geographical Info1111ation System. In Water
Environ111ental Planning: To\vards Integrated Planning and Nlanagen1e11t of Water
Resources for Environmental Risks, Alias Abdullah, Norio Okada, and Mohd Kami! Yusoff, eds., International Islamic University Malaysia, pp. 307-324.
Faris Goroshi and Alias Abdullah
A11 !111egra1ed Approach for the Prediction of tVater Quality Index based 011 Land Use Allributes Using Data Generation ,\fetlwd and Back Propagation Network Algorilhm
by hilly mountains. Gombak river watershed is in the upper part of Klang river basin. About 60% of the catchment is steep mountains rising to a height of
l220m. The Gombak River drains a narrow elongated watershed that runs slightly west of south from the steep-sloped main range mountains down through more gently sloping foothills to the alluvial plain in the vicinity of north
Kuala Lumpur31• Sungai Keroh, Sungai Pusu, Sungai. Rumput, Sungai. Salak,
Sungai. Semampus and Sungai. Blongkong feed Gombak River.
I
'
Figure 2: Map of Gombak River catchment area.
The Gombak River traverses a vast spectrum of land use change within the Gombak River watershed area. The axial length of the drainage basin is 22.2 km, average width 5.5 km, and an area of 123.3 square km. The river
confluence with Batu River at 28.3 metre altitude32 Gombak River and Kelang
River meet at a confluence point in the heart of Kuala Lumpur city. The watershed can be divided into three main sections. The upper zone, including
31Bishop,
J. E., 1973. Limnology of a Small lvlalayan River, Sungai Gombak, The
Hague., pp. 485. 32
Lai, F.S., 1983. Biochemical Oxygen Demand Concentration of Two River Basins of Selangor, Pertanika, Vol. 6(3), pp. 32-43.
PLANNING il!ALAYS/A Jo11r11al of the J\Jalaysian /11slil11/e of Planners (2009)
the upper tributary sub-zone, takes in the undisturbed forest reserve areas of the watershed and terminates at the point where the river leaves the steep sloped hills and enters the gentler foothill section. The middle and lower zones with gradients of 4.7% and 2.2% respectively.
RESEARCH APPROACH
A water index is a method of combining various water quality parameters into one concise and objective value representing the state of the water quality trends. The WQI (Water Quality Index) is used to compare water quality on rivers, on different locations on the same river, and to measure water quality changes over a period of time. There are many methods used for the calculation of WQI. The Department of Environment (DOE) has obtained an opinion-poll formula for the calculation of WQI. A panel of experts is consulted on the choice of parameters and on the weightage to be assigned to each parameter. The parameters, which have been selected, were: DO (Dissolved Oxygen), BOD (Biochemical Oxygen Demand), COD (Chemical Oxygen Demand), AN (Ammonia-Nitrogen), SS (Suspended Solids) and pH (pH value). A more comprehensive description of the DOE-WQI and Harkins' method had been discussed in a previous study by Faris & Alias, (2008)33•
The water quality parameters are accessible and can be made available as frequent as needed; however, land use and land cover are difficult or impossible to obtain in short frequent terms. To overcome this challenge, it was deemed necessary to develop a method for data generation that can mimic the actual land use and land cover. The proposed method will be able to predict the actual data then and to project (forecast) data for the future. The generation of land use or land cover data is essential for the ANN training of the river based on land use sub indices and for building the model that predicts and forecasts the WQI of the river.
Data Generation Models and Boundary Conditions for Gombak River Watershed
For the purpose of this study and in order to generate land use or land cover data, the following models and boundary conditions will be followed:
33 Faris, F.G. & Alias Abdullah, 2008. Prediction of Water Quality Index Using Back
Propagation Network Algorithtn. Case Study: Go1nbak River, Journal o.f Engineering
Science and Technology, 2008 (Jn press).
Faris Goroshi and Alias Abdullah
An Integrated Approach for rhe Prediction of fValer Quality Index based on land Use Allribules Using Data Generalion /lferlwd and Back Propagalion Ne111·ork Algorithm
Exponential Model Equation:
Exponential model will be used to generate data for all ascending values. However ifthe values (according to the planner's decision) need to be stabilized based on maximum capacity of the watershed or the region, then another model (Lagarange Model) will be used in order to generate data for the converging values.
Lagrange Model Equation: 3rd degree Polynomial Fit:
- +b
+.
1+d 3y-a x ex x ... .
Third degree polynomial model will be used in order to generate data that had reached the maximum capacity area allocated for the watershed/region. The data generation will continue until the value of the generated area reaches the capacity area.
In order to generate descending values such as forest area, the saturation growth model will be used.
Saturation Growth-Rate Model:
ax
y= (b+x)
The data will be generated until a convergent point has been reach. At this point the maximum allocated capacity of the category will be reached. After the land use or land cover data were generated. Another neural network was set up to train the stations 18 and 24 based on LU/LC parameters only. The configuration of the network was not changed to ensure the consistency of the training. The network used WQI values that corresponds the same date of the generated LU/LC data.
The Proposed Land-Use Attributes WQI Model (LA-WQI Model)
This model was developed by associating the appropriate loading factors to a set of sub indices. The loading factors were obtained based on peak factor theorem by assigning weights to different categories of land use indices. These weights were primarily assigned based on the effect of each land use as well as the existence of each category within the watershed. Then they were corrected furthermore by trial and error until the required weights were assigned.
The proposed model:
LA-WQI = 100 - [0.15 BUsi
+
0.17 Rsi+
0.26 Csi+
0.38 lsi+
0.04 Fsi]PLANNING MALAYSIA Journal of the 1\1alaysia11 /11stit11te of Planners (2009)
Where, BUsi is the build-up area sub index; build-up area represents the effluents of storm and wash water from the build-up area, Rsi is the residential area sub index, Csi is commercial area sub index, lsi is Industrial area sub index and Fsi is the Forest area sub index. It has been thought earlier, that forest area within a river watershed does not degrade the water quality of the river;
However, Mohd Kami! et al. 34 concluded in a study of water quality index and
forest health, that a disturbed forest will degrade the water quality of the river within its catchments.
Assumptions and boundary conditions - The land use and act1v1t1es within catchments area may vary from one river to another; however the main land uses and activities that constituted Gombak River catchment were the ones used as input parameters in the proposed model. These parameters were assumed to be the most effective ones after an extensive training process using the (leave-one-out) method. The input parameters represent the effluents discharged from each category and the physical area per se. The loading factors (associated weights) were obtained by ANN training and using peak factor theorem.
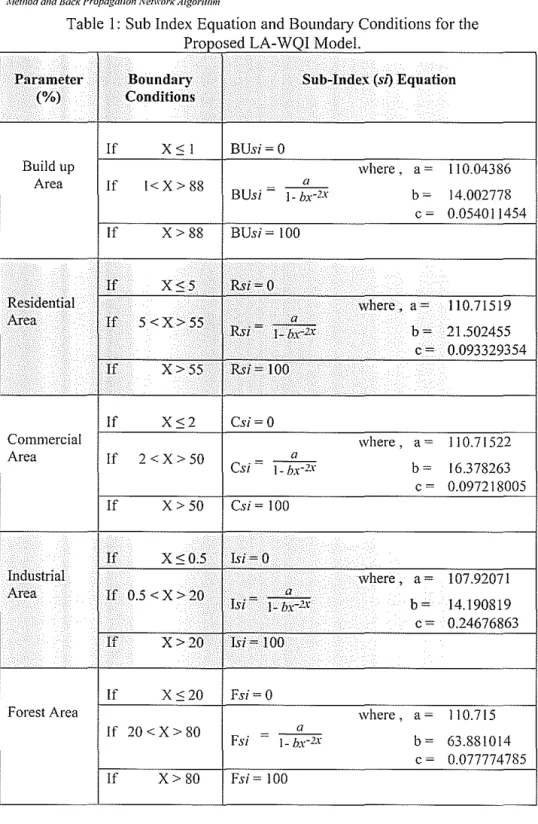
All the five categories are firstly generated as area measured in acres and converted to percentages of the watershed. These percentages are considered as the effects of these categories on water quality. They are then calculated using the logistic model and boundaiy conditions as shown on Table I.
The calculation of the sub indices were based on the Logistic Model:
1 f(x) = 1 + e -x
The reason for choosing the logistic model is that it is based on the sigmoid function, a function of which is used internally for the training of artificial neural networks' back propagation algorithm. The model will be applied on the average values of the percentages ofland use every year, and will be compared with average values of yearly WQI (actual and ANN predicted). The predicted WQI will include both water quality and land use sub indices.
34
Yusoff, M.K., Heng, S.S., Majid, N.M., Mokhtaruddin, A.M., Hanum, !.F., Alias, M.A., & Kobayashi, S., 2001. Effects of different land use patterns on the stream water quality in Pasoh, Negeri Sembilan, Malaysia. In Rehabilitation of Degraded Tropical
Forest Eco.\)JSle111s: Workshop Proceedings, Kobayashi, S., Turnbull, J.W., Toma, T. Mori, T., Majid, N.M.N.A. eds., 2-4 November 1999, CIFOR, Bogar, Indonesia, pp.
87-98.
Faris Goroshi and Alias Abdullah
An flllegrated Approach for the Prediction of Water Quality Index based 011 Land Use At1rib11tes U~ing Data Generation 1\lerhod and Back Propagation Network Algorilhm
Table I: Sub Index Equation and Boundary Conditions for the P rooose d LA WQIM d l
-
o e.Parameter Boundary Sub-Index (s1) Equation
(%)
ConditionsIf X SI BUsi= 0
Build up \Vhere, a= 110.04386
Area If I< X > 88 BUsi = a
I-bx-2X b= 14.002778
c= 0.054011454
If X> 88 BUsi=IOO
If
xss
Rsi=OResidential where, a= 110.71519
Area If 5 <X>55
R,;=
aI-bx-2X b= 21.502455
c= 0.093329354
If X>55 Rsi= 100
If
XS2 Csi=OCo1nn1ercial \Vhere, a= 110.71522
Area
If
2 <x
> 50 Csi= aI-bx-2x b= 16.378263
c= 0.097218005
If
x
> 50 Csi= 100If XS0.5 lsi= 0
Industrial \Vhere, a= 107.92071
Area If 0.5 <X>20 rs;= a
I-bx-2X b= 14.190819
c= 0.24676863
If X>20 lsi=IOO
If XS20 Fsi= 0
Forest Area \Vhere, a= 110.715
If
20 <x
> 80 aFsi = I-bx-2x b= 63.881014 c= 0.077774785
If
X> 80 Fsi=IOORESULTS AND DISCUSSIONS
PLANNING 1l1ALA YSIA
Journal of the Afalaysian Institute af Planners (2009)
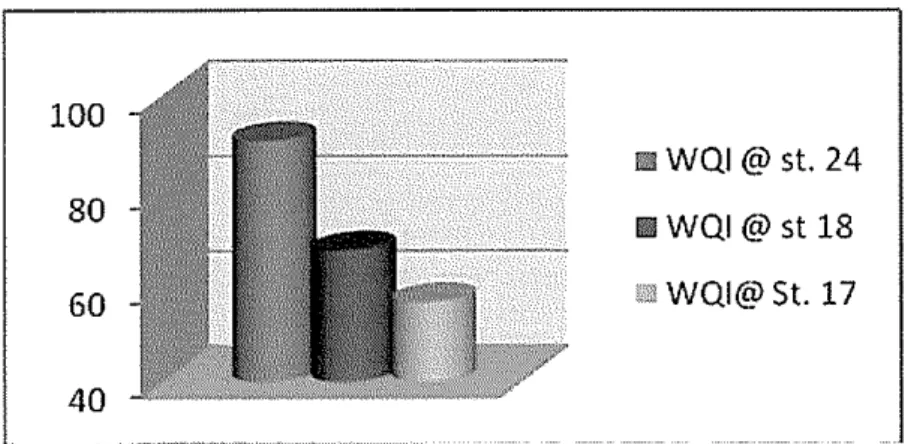
The water quality index sums up the overall quality of the three stations located along the Gombak River. As shown in Figure 3, the mean WQI for stations 24, 18 and 17 respectively were 91, 68 and 57 on the DOE WQI scale. This puts station 24 as clean river water; station 18 as slightly polluted and station 17 as polluted river water. Station 18 is considered the downstream of Gombak river watershed. The station was trained using ANN back propagation algorithm. The neural network was configured with 5 hidden nodes, 12125 iteration cycles and a momentum of 50. The results of the network produced normalized RMS error of 0.86 and Actual error of 0.36.
100
80
60
40
111WQJ@st. 24
llllWQJ@st 18
Figure 3: Average Annual Values ofGombak River for the period of 1999 to 2006.
The network later was able to produce its own minimum, maximum and mean values for predicted output. Based on the results (Please refer to Table 2) obtained by the network, back propagation algorithm was able to predict WQI with high accuracy. The number of tested WQI was equivalent to that of the predicted one. The time-series graph shown in Figure 4 indicates very high accuracy of prediction ofWQI at station no. 18 ofGombak River. Values that appear less than the actual data is due to the learning process of the network. Water quality monitoring station no. 18 is the last monitoring point within the boundary of Gombak River watershed. Unlike station no. 24, the land use affecting the water quality of Gombak River is an extensive one as shown on Table 3 and Figure 5. The build-up area exceeds 80% of the total area of this
part of the watershed. It is important to understand the evolution of land use
within the watershed in order to generate data and to forecast data for future development. The build-up area increment has stabilized to a lesser value after the year 2000 as shown in Figure 6. This stabilization indicates that the capacity of the watershed has approached its peak.
Faris Goroslii and Alias Abdullah
An Integrated Approach for the Prediction of Water Quality Index based 011 Land UN Allributes Uving Data Generation Afethod and Back Propagation Net11·ork Algorithm
Table 2: Results of Actual vs. Predicted WQI using Back Propagation
l . l fS . 8
A1gont1m o tat10n No. 1
Actual Predicted Actual Predicted Actual Predicted
WQI WQI WQI WQI WQI WQI
85.88 84.95 61.41 61.25 65.51 65.29
79.99 80.31 61.61 61.93 68.37 68.16
45.88 47.04 62.91 62.57 77.28 77.10
64.71 64.60 75.17 75.24 38.81 47.04
55.19 55.07 62.09 62.07 63.06 63.15
53.64 53.67 71.87 71.72 70.47 70.19
58.46 58.43 81.16 80.58 65.58 65.58
50.49 49.89 73.33 73.27 52.05 51.44
78.84 78.71 69.00 68.81 71.19 70.96
66.31 66.13 73.40 73.03 78.15 78.58
67.00 66.76 66.38 66.19 73.32 72.79
52.87 52.99 81.74 80.92 74.65 74.59
57.40 57.36 77.43 77.06 75.74 75.66
80.59 80.08 67.55 67.33 69.79 69.69
52.73 52.74 65.59 65.38 71.75 71.96
53.24 52.84 59.94 60.09 64.61 64.57
77.93 77.79 66.24 65.98 64.97 64.91
61.59 61.72 65.61 65.49 69.43 69.00
57.81 57.76 28.10 45.85 68.85 68.53
67.00 66.65 62.19 62.21 73.05 72.99
70.33 70.18 71.01 70.71 62.62 62.37
64.63 64.31 63.07 63.26 71.48 71.25
56.09 55.97 71.61 71.38 76.61 77.06
76.49 76.62 65.05 64.71 79.21 79.55
a e ..:i: e ected
T bl ' S l l d an use /l d an cover categories
No. Year Build Un Arca Forest Residential Industrial Comntcrcial
1 2003 6356.595 7.161 2802.5 77.552 620.625
2 2002 6334.512 7.186 2792.691 77.280 6!8.079
3 2000 6312.506 7.202 2782.917 77.010 615.916
4 1997 6298.492 7.217 2776.739 76.839 614.549
5 1990 5195.878 8.480 2290.531 63.385 506.9
The build-up area reaching its highest capacity and forest area is at its lowest values. The data were generated from 1984 until 2001; however, only the years 1998 until 2006 will be considered for the purpose of this study in order to match corresponding WQI data available. The data was generated for build-up Area, forest area, residential area, commercial area and industrial area.
i5
s:
90.00
80.00
70.00
60.00
50.00
40.00
30.00
PLANNING tllALAYSJA Journal oftlw klulaysfrm htslitute of Planners (2009)
!-+-Actual
! - G -predicted,
1 4 7 10 13 16 19 22 25 28 31 34 37 40 43 46 49 52 55 58 61 64 67 70
Row Number
Figure 4: Time-Series Graph of Actual vs. Predicted WQI at Station 18 of Gombak River
Figure 5: Land Use Map ofGombak River Watershed
8000 E
u 6000 ~
ro 4000
E
ro
c. 2000 ~·=?-Build Up Area
~
:!l 0
·5
- - Linear (Build Up Area)
"'
1980 1985 1990 1995 2000 2005Year
Figure 6: Build-Up Area of Station 18 from 1980 to 2005
Faris Goroshi and Alias Abdullah
An flllegrated Approach for the Prediction of IVater Quality Index based 011 Land Use Allributes Using Data Ge11eratio11
Afetlwd and Back Propagation Network Algorithm
Buildup Area Data Generation
Using the 3rd degree Polynomial model: y=a+bx+cx2+dx3 ••• ....
The initial curve for build up area as shown in Figure 7 was generated using the
following coefficient data: a -7.312269e+009, b 10961380,
c = -5477.1702 and d = 0.9122745. The model operated with few numbers of data at the initial stage of generation and yielded a standard error of 49.54, and with correlation coefficient of 0.99985.
!
g<
~"
~
fo'0 .... 9'0
,,,
,.,
,,,
""
Al)1\!lpS
-:,'l.r1>9'1.
'1-,;.s:<"'
.. +1~~982.1 1997.3
s = 49.54404482 r=0.99985039
Figure 7: Data generation of Build-Up Area at Station 18 using Lagrange Model
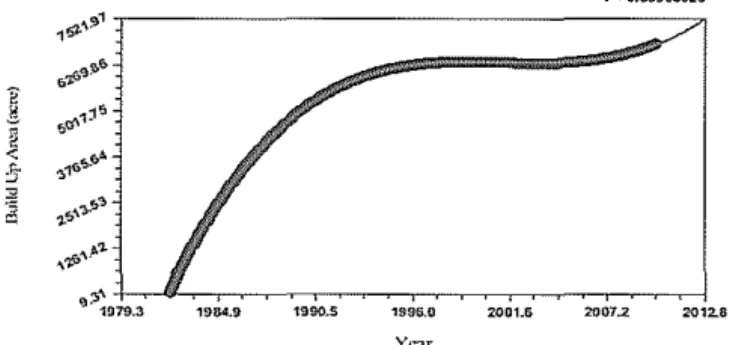
Based on the data generated above, 4th Degree Polynomial model was used to generate the required build-up area from 1984 until 2010 on a monthly basis as shown in Figure 8. During the iteration process the following coefficient data were used: a= -4.64034e+009, b = 5692851.6, c = -1582.5807, d = -0.366894, and e = 0.00015750769
ii
'
@ <
5
"
~
1o:>i"'~1
f;t:f'!J'P&
~1~"'
~-t&"'~
,..,, ... ~~~
'l."ti>'l.·A1-\'1:;~979.3 19&4.9 1990.S
s = 9.09269479 •=0.9999as29
Figure 8: Build-Up Area Data Generation using 4'" Degree Polynomial Model
PLANNING 1l1ALA YSIA Journal of the Alafaysian Institute of Planners (2009)
The data exceeding the capacity of the watershed will not be considered as stated in the boundary condition of model applications.
Forest A1·ea Data Generation
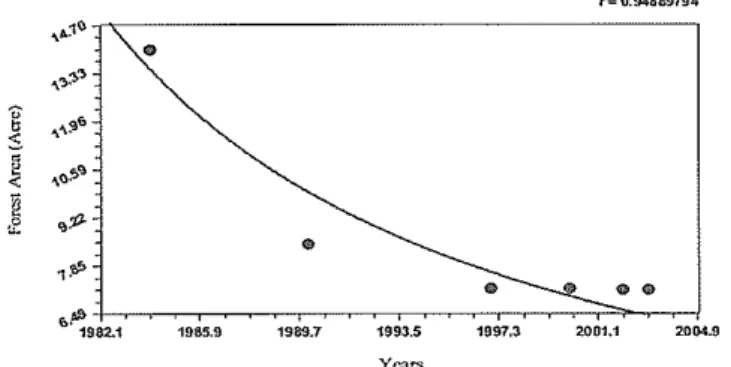
The forest area affecting station no. 18 of the watershed is decreasing in value; therefore a saturation growth-rate model was used to generate the area. To generate the initial data, the following coefficients were used: coefficient data: a= 0.11519198 and b = -1966.9875 and were applied on the model:
ax
y= (b+x)
The initial curve (Figure 9) for data generated produced acceptable results; however due to few numbers of data, the curve needed adjustment. The second stage of data generation solved this problem and produced the required data.
Based on the initial saturation growth-rate model the remaining required data were generated from 1984 until 2010 using the same model (Figure 10) and applying new coefficient data for the model obtained from a number of iterations. The coefficient data were a= 0.11519245, and b = -1966.9874. As the second application was based the first model the second application produced much lower standard error 0.0011342
..
~~\)e
..
-:,~')"
.... ~G'
$
~ .. a!> OJ
!
,,,.
ii:'"'
,,.
1982.1 19115.9 1989.7 1993.5
Years
1997.3
s = 0,96353055 r=0.948119794
21)01.1 21)()4.9
Figure 9: Forest Area Data Generation of Station 18 Using Therefore Saturation Growth-Rate Model
Faris Gorashi and Alias Abdullah
An lmegrated Approach for the Pretfictio11 of fVater Quality Index based 011 La11d Use Attributes Using Data Generation Afethod 011d Back Prapagation Net11·ork Algorithm
·"'
'
~
,-v•
~ \~o]
\)~s" 0.00113423
r= 0.999911!191
,1•+-~~~~~~~~~~~~~~~~~-,-j
1979.2 1984.8 1990A 1996.0 2001.G 2007.2 2012.8
Figure I 0: Application of Saturation Growth-Rate Model On Forest Area Affecting Station 18
Data Generation of Residential Area Affecting Station 18
Following the same method used for generating build-up area, the residential area was generated initially using 3rd degree Polynomial model with coefficient data of a = -3.0076658e+009, b = 4508008.2, c = -2252.2557, and d =0.37508435 as shown in figure 5.50. The standard error was 20.913 in the initial model application. After the initial data were generated, the remaining required data were generated using 4th Degree Polynomial model with coefficient data ofa = 1.7159507e+009, b = 1990074.4, c = 413.14533, d = -0.22143343, and e = 7.2490844e-005. The residual curve gave better prediction ability with a standard error of7.497584 as shown in Figure 11.
Residuals
1987.G 1996.0 2004.4 2012.8
Figure 11: Residual Curve of Actual Versus Generated Data of Residential Area
Data Generation for Commercial and Industrial Area Affecting Station 18
Exponential model had been used for the generation of data for commercial and industrial area. The initial setup for data generation used a = 7.3704247e-046, and b = 0.055158363 data coefficient for commercial area and for industrial
PLANNING 11.fAl,A YSIA Journal of the Malaysian Institute of Planners (2009)
area, a= 9.4973359e-047, and b = 0.055143224. Data generated for commercial and industrial areas represented the years 1984 through 2010. For commercial area, the best standard error was 115.2054407, with Correlation Coefficient of 0.8126092; while industrial area had best standard error of 14.4130782 with correlation coefficient of 0.8122768.
After data generation, exponential model was defined by new coefficient
data of a= 7.3720831e-046, & b = 0.05515825 for commercial area, and a=
9.4985733e-047 and b = 0.055143159 for industrial area for further data generation, forecast and analysis. The standard error for commercial and industrial area was 0.0869008 and 0.0108680 respectively.
ANN Training of Gombak River LU/LC Parameters for Station IS
A neural network was set up in order to train the generated LU/LC data affecting station 18 of Gombak River. The network architecture consisted of 5 hidden nodes, and 94 rows. The network which used pack propagation algorithm carried out 125500 cycles of iterations as described in the training boundaiy conditions. The average predicted water quality index during this period (9 years) was 66.68. The normalized RMS error was 19.97% and actual e1rnr of 8.47. The high error value was expected at this part as the learning process is between a more stable LU/LC parameters and heterogeneous WQI that changes continuously. The network was able to identify a pattern while the training process continued. The pattern indicated that the WQI predicted based on LU/LC data was more linear than that of actual WQI as shown in figure time series of station 12 (Figure 12).
Figure 12: Time Series Graph of Actual vs. Predicted WQI at Station l 8
Faris Goroshi and Alias Abd11/lah
An Integrated Approach for the Predic1io11 of Water Quality Index based 011 Land Use Allributes Using Dai a Generation
Alet!tod and Back Propagation Network Algorithm
In order to predict the WQJ using the LA-WQJ the sub indices of selected LU/LC parameters had to be calculated. Using the method described previously in the research approach, the calculated sub indices were then multiplied by the weight factor of each category.
The LA-WQI was then calculated using the proposed model equation as follows:
LA WQI ~ JOO- [0.15 BUsi
+
0.17 Rsi+
0.26 Csi+
0.38 lsi+
0.04 FsijThe results of predicted WQI obtained using LA-WQI, shows a continuous decrease of water quality index from 66.825 in 1998 to 64.677 in 2006. As the activities increase throughout the watershed the values of WQI quality decreases accordingly. The values of predicted WQI using the mentioned methods are illustrated in Figure 13.
100
0
g
0
N
LIO 0 0
N
"'
0 0
N
Ill Actual WQI
Ill Predicted WQI Lond Use
El Predicted WQI Proposed Model
---·---~··-c----c---c=-ccccc==
- - - · - - - - __J
Figure 13: Values ofWQI Obtained Using DOE-WQI, ANN-WQI and LA-WQI Models
The average mean results of WQI from each method were very near in value. The results showed an accuracy of 98% between Actual DOE WQI and LA WQI for station no. 18 of Gombak River.
As shown in Figure 14, average Values of WQI for Actual, ANN Predicted and LA WQI predicted are 66.299, 66.844 and 66.008 respectively which constitute an accuracy range of97.9 to 99.5 %.
70
65
60
55
50
1
PLANNING ft.IALA YSIA Jo11r11al of the lvfalaysia11 Institute of Pla1111ers (2009)
ii Actual WQI
llll Predicted WQI Land Use
1'11 Predicted WQI Proposed Model
Figure 14: Average Values ofWQI using DOE, ANN and LA-WQI Models
VALIDATION
In order to carry out a sensitivity test to validate the method for generating and forecasting LU/LC data, some of the obtained data were withheld and were not used in originating the models for data generation. These data represent LU/LC data for the year of 1984
The average area for the whole year was considered during the validation process, and it was compared to actual land use data for the same year as shown in Table 4. The land use area obtained using the method described in the methodology to generate and forecast data, had given a very high precision ranging from 91.862 to 95.902 when compared to actual data obtained from DOA.
Table 4: Comnarison between Average Values of Actual vs. Predicted Dat a
BU fAcre) R(Acre\ C (Acre\ I (Acre\
Actual 1984.43 1229.6 17.569 4.837
Avera!!e 1899.234 1338.524 16.84918 4.621188
Accuracv o/o 95.706 91.862 95.902 95.538
The trends which were chosen to describe the pattern of development were very realistic, and succeeded to mimic the actual patterns of development. Furthermore, and in order to see the pattern of dete1ioration of the water quality of the Gombak River with respect to the increase of land use within the watershed, the LA-WQI model was applied on three stations. The average values of WQI obtained on the three stations were taken from the same dates to
Faris Goroshi and Alias Abdulluh
A11 /11legu11ed Appro(1chfi1r the Prediction rif IJ'ater Quality Index based 011 Land Use Allributes Using Datu Generation j\ferhod and Back Propagation Net11·ork Algorithm
ensure the consistency of the results as shown in Table 4. The sub-indices were multiplied by their respective factor explained previously. The Values of WQI were 96, 91. 9 and 65. 7 respectively.
CONCLUSION
This study had focused on finding a low-end alternative for water quality monitoring techniques. It used data generation method coupled with ANN approach to provide an effective prediction model that suits environments with high heterogeneity. The proposed approach minimized most of anomalies associated with prediction methods and provided water quality forecasting and prediction with high accuracy. The study proposed a method that mimicked the actual development pattern in the watershed; however, it is recommended that for future planning, watershed development should follow an identified model fit for development. All developmental schemes should be conducted in accordance with a specific allocation of time and space which follows a certain model. This will help in producing more accurate forecasting of LU/LC sub-indices, which in turn will help in forecasting the WQl for the future years until the watershed is fully developed. After the watershed is fully developed, the activities of different categories of land use will produce a uniform discharge of effluents to the river. The study had also identified that the mid streams of Gombak River is deteriorating in quality due to rapid development within the vicinity of the watershed. Despite the high accuracy attained by the application of LA-WQI model on Gombak River; it has not yet been tested in other rivers due to the limitation of the scope of this study. It is recommended that future studies should be able to further test the current model on a regional scale.
REFERENCES:
Books/Journals:
Alias Abdullah, Kazuhisa !ki, and Mitsue Morozumi, 1994. A study to evaluate change of zoning in GlS operation due to the diversification of the AHP
judgment, Proceeding of the Sixteenth Symposium on Computer
Technology oj"!nformation. System and Applications, AIJ, S-5-6, pp.349-354.
Alias Abdullah, Kazuhisa !ki, and Mitsue Morozumi, 1994. An integrated approach of AHP and GIS application to analyze and develop
recreational zoning, Journal o.f architecture planning and Environn1ental Engineering, AIJ, No. 463, pp. 213-222.
PLANNING il!ALAYSJA
Jo11r11al of the iHalaysia11 !11stit11te of Planners (2009)
Bishop, J.E., 1973. Limnology of a Small Malayan River, Sungai Gombak, The
Hague. pp. 485.
Carr, G.M. and Chambers, P.A., 1998. Spatial and temporal patterns of
nutrients and algal abundance in Alberta rivers. Report prepared for the Prairie Provinces Water Board, Regina, SK.
Chandra Sekhar, M. and Anand Raj, P., 1995. Land Use Water Quality Modeling, Journal Of Water Science Technology, Vol. 31, No. 8, !WA Publishing, pp.383-386.
Correll, D.L., Jordan, T.E., and Weller, D.E., 2001. Effects of precipitation, air temperature, and land use on organic carbon discharges from Rhode River watersheds. Water, Air, and Soil Pollution, 128, pp. 139-159. Diane M. L., David P. A., 2004. u,e of Artificial Neural Network Models to
Predict Indicator Organisms Concentrations in an Urban Watershed,
AGU, 85(17), Joint Assembly Suppl., Abstract H53A-06 l 330h POSTER
Engel, B. R., Srinivasan, R., Arnold,]., Rewerts,C., and Brown, S. J., 1993. Nonpoint Source (NPS) Pollution Modelling Using Models Integrated
with Geographic Information Systems (GIS). Water Science and
Technology, Vol. 28, No. 3-5, pp. 685-690.
Evans, B. M. and Miller, D. A., 1988. Modeling Nonpoint Pollution at the Watershed Level with the Aid of a Geographic Information System. In:
Nonpoint Pollution: 1988 - Policy, Economy, Management, and Appropriate Technology. American Water Resources Association, pp. 283-290.
Faris, F.G. and Alias Abdullah, 2008. A Study on the Water Quality ofGombak River Using A11ificial Neural Network, Al-Rissala Journal, International Islamic University Malaysia 2008 (In press).
Faris, F.G. and Alias Abdullah, 2008. Prediction of Water Quality Index Using Back Propagation Network Algorithm. Case Study: Gombak River,
Journal of Engineering Science and Technology, 2008 (In press).
Goodchild, M. F., Parks, B. 0., and Steyaert, L. T., (eds.), 1993. Geographic Information Systems and Environmental Modeling, Oxford University Press, New York, pp. 231-237.
Hafizan Juahir, Sharifuddin M. Zain, Zainal Ahmad, Nazari M. Jaafar, 2004. An Application of Second Order Neural Network Back Propagation
Method in Nlodeling River Discharge. In 1'Vater Enviro111nental Planning: Tcnvarll'i Integrated Planning and /\!fa11agen1e11t o,f Water Resources .for
Environmental Risks, Alias Abdullah, Nerio Okada, and Mohd Kami! Yusoff, eds., International Islamic University Malaysia, pp. 307 - 324.
Hubert-Moy, L., Cotonnec, A., Le Du, L., Chardin, A., and Perez, P., (eds.),
2001. A Comparison ofClass(fication Procedures of Remote Sensed Data
Applied on Different Landscape Units, Remote Sensing of the Environment, Elsevier, Vol. 75, no. 2, pp. 174-187.
Faris Goroshi and Alias Abdullah
An Integrated Approach for the Prediction of Water Quality Index based 011 Land Use Attributes Using Data Generation
ldethod and Back Propagation Net\\'ork Algorithm
Junaida Ariffin, Aminuddin Abdul Ghani, Nor Azazi Zakaria, and Ahmad Shukri Yahya, 2004. Sediment Prediction Using ANN and Regression Approach, I" International Conference 011 Managing Rivers in the 2
I''
Centwy: Issues & Challe11ges, Malaysia pp. 168-174.Kadri, Yurekli, Ahmet Kurunc, and Huseyin Simsek, 2004. Prediction of daily
Stream Flow Based on Stochastic Approaches, Journal of Spatial
Hydrology, Vol. 4 No. 2.
Kamarul Ismail, and Ruslan Rainis, 2004. Modeling River Water Quality Index Using Artificial Neural Networks and Geographical Information System,
In rVater Environn1ental Planning: To1vards Integrated Planning and 1Vfanagen1ent of Water Resources for Environn1ental Risks, Alias Abdullah, Norio Okada, and Mohd Kami! Yusoff, eds., International Islamic University Malaysia.
Lai, F.S., 1983. Biochemical Oxygen Demand Concentration of Two River
Basins ofSelangor, Pertanika. Vol. 6(3), pp. 32-43.
Lake, E., Wamaars E. A., Jacobsen P., Nelen F. and Ceu Almeida M., 1997.
Artificial Neural Networks as a tool in Urban Storm Drainage, Journal of
Water Science and Technology, Vol. 36, Issues 8-9, pp. I 0 l-109.
Noorazuan M. H, Ruslan Rainis, Hafizan Huahir, Sharifuddin, M. Zain, and Nazari Jaafar, 2003. GIS Application in Evaluating Land use - Land Cover Change and its Impact on the Hydrological Regime in Langat
River Basin, Malaysia, Map Asia Conference 2003, GISdevelopment.net
Picton, P. D., 1994. Introduction to neural network, the Macmillan press ltd,
London.
Rounds, S.A., 2002. Development of a Neural Network Model for Dissolved
Oxygen in the Tualatin River, Oregon, Proceeding of the second Federal
Interage11cy Hydrologic Modeling Conference, Las Vegas, Nevada, July 29 - August 1, 2002 Subcommittee on Hydrology of the interagency Advisory Committee on Water Resources.
Ruslan Rainis, 2003. Application of GIS and Landscape Metrics in Monitoring
Urban Land Use Change, "Urban Ecosystem Studies in Malaysia. A
Study of Change'', Noorazuan Md Hashim & Ruslan Rainis, eds., Universal Publishers, pp 267-278
Sekhar M. Chandra, and Sreenivasulu, 2003. Modeling Nutrients Contributed
by Overland Flow From the Krishna River Basin, Diffi1se Pollution
Co11ference. Dublin, Water Resources Management, lA, pp. 20 -23. Smith, A. J., Goetz, S.D., Prince, R. and Wright, B., 2003. Estimation of
sub-pixel impervious surface area using a decision tree approach, Remote
sensing of the enviro11me11t. (in press).
Tong, S. T. Y. and Chen, W., 2002. Modeling the relationship between land use
and surface water quality. Journal of Environmental Management, 66:
pp. 377-393.
PLANNING ,l/ALA YSIA Journal of rhe kfalaysim1 fnstilute of Pla1111ers (2009)
Wang, X., 2001. Integrating water-Quality management and Landuse Planning In a Watershed Context. Journal of environmental management, 61, pp. 25-36.
Watts, R.L., 1966. New Federations: Experiments in the Commonwealth.
Oxford: Clarendon Press.
Wenwei Ren, Yang Zhong, Me!igrana, J., Anderson, B., Watt, W.E., Jiakuan Chen, and Hok-Lin Leung, 2003. Urbanization, Land use, and Water Quality in Shanghai, Environment International. 29, Elsevier, pp. 649-659
Yusoff, M.K., Heng, S.S., Majid, N.M., Mokhtaruddin, A.M., Haman, !.F., Alias, M.A, Kobayashi, S., 2001. Effects of different land use patterns on the stream water quality in Pasoh, Negeri Sembilan, Malaysia. In
Rehabilitation of Degraded Tropical Forest Ecosystems: Workshop Proceedings, Kobayashi, S., Turnbull, J.W., Toma, T. Mori, T., Majid, N.M.N.A. eds., 2-4 November 1999, CIFOR, Bogor, Indonesia, pp. 87-98.
Zou, R., Lung, W.S., and Guo, H., 2002. Neural Network Embedded Monte Carlo Approach for Water Quality Modeling Under Input Information Unce1iainty. Journal of Computing in Civil Engineering, ASCE, 16 (2), pp. 135 - 142.
Internet:
Cormac Technologies Inc. 1999. Manual, NeuNet Pro. Revision 2.2. Cormac Technologies Inc. <http://www.cormactech.com/Neunet>
Dixon, B., 2004. Applicability of Neuro-Fuzzy Techniques In Predicting Ground Water Vulnerability: A GIS-based sensitivity analysis. Journal of Hydrology, published by Elsevier B. V. doi:I0.1016/jhydrol.2004.11.010. Retrieved online on 22/04/2005. <http://www.sciencedirect.com>
***
!f;) 2009 by MIP