www.ijte.net
Implementation of the Instructional
Practices Inventory-Technology Process
with Fidelity: The Impact on Technology
Use and Student Cognitive Engagement
Mekca Wallace-Spurgin
Centerville School District, USA
To cite this article:
Wallace-Spurgin, M.R. (2018). Implementation of the instructional practices
inventory-technology process with fidelity: The impact on inventory-technology use and student cognitive
engagement.
International Journal of Technology in Education (IJTE), 1
(1), 35-45.
Volume 1, Issue 1, Fall 2018
ISSN: 2689-2758
Implementation of the Instructional Practices Inventory-Technology
Process with Fidelity: The Impact on Technology Use and Student
Cognitive Engagement
Mekca Wallace-Spurgin
Abstract
In an effort provide access to devices and prepare students for the future, a small rural high school committed to becoming a high-tech school. Data collected the first year using the IPI-T process suggested teachers were typically the users of the technology, students were often disengaged, and teachers were asking students to participate in lower-order surface activities. Missing from the process was the implementation of the faculty collaborative sessions. Year two IPI-T data was collected three times. Additionally, faculty collaborative sessions were planned and facilitated within one week of collection data. Participating in each faculty collaborative session, teachers (a) became familiar with the IPI-T Rubric and Protocols, (b) analyzed and discussed the data, (c) identified high-quality examples of student learning that foster student engagement with technology, (d) designed high-quality lessons that foster student engagement with technology, (e) compared longitudinal data and set goals for future data collection using the IPI-T tool.An analysis of the data revealed when implementing the IPI-T process with fidelity teacher and student technology use increased as did student cognitive engagement when using technology. In addition, it was found that students use technology for information searches the majority of the time rather than media development or to collaborate among peers for example, which are associated with higher-levels of cognitive engagement.
Keywords: Educational technology, Student cognitive engagement, Instructional practices inventory-technology, Technology integration.
Introduction
The educational landscape is changing. The learning needs of our Digital Native (Prensky, 2001b) students warrant the integration of technology, however, when teachers do use technology for instruction, they may not be using it to its fullest potential to promote high levels of student cognitive engagement (Cuban, Kirkpatrick, & Peck, 2001; Prensky, 2015; Russell, Bebell, O‟Dwyer, & O‟Connor, 2003; Schrum & Levin 2012; Zhao, Pugh, Sheldon, & Byers, 2002). It is important to provide in-service teachers the opportunities to learn how to integrate technology into their teaching practices (Cuban et al., 2001; Russell et al., 2003; Zhao et al., 2002). In an effort to provide access to technology and prepare students for the “digital complexities of the future”, school board members in a small, rural community in Southern Iowa approved the purchase of Chromebooks to be distributed within the local high school. The school board and administration was interested in determining if students were using the devices as well as if they were cognitively engaged when using technology. As a result, they sent the researcher and a team of teachers to a workshop to be trained in the Instructional Practices Inventory – Technology (IPI-T) process.
Instructional Practices Inventory
Jerry Valentine, Professor at the University of Missouri, and graduate assistant Bryan Painter, created the Instructional Practices Inventory (IPI) in 1996. The IPI measures student cognitive engagement. In 2001, Valentine began to recognize the need to add a technology component to the measuring tool as schools were moving 1:1 with technology devices, resulting in the creation of the Instructional Practices Inventory – Technology (IPI-T). As defined within Valentine‟s Instructional Practices Inventory - Technology (IPI-T), each category coded describes the level of student engagement and are referred to as:
Student Verbal Learning Conversations (5) Teacher-led Instruction (4)
Student Work with Teacher Engaged (3) Student Work with Teacher Not Engaged (2) Student Disengagement (1)
It is important to note that the categories are not a hierarchy but rather “six distinct ways to categorize student engagement” (Valentine, 2017, p. 2). According to Valentine (2012c), Categories 5 and 6 are coded when students are observed participating in higher-order, deeper thinking activities such as decision making from analysis, collaboration among peers, and creative and innovative thinking. Categories 2, 3, and 4 include lower-order, surface activities such as basic fact finding, recall and memorization, and simple understanding (Workshop handouts, p. 2).
Categories of Technology Use
There are six IPI-T categories. Each category describes the level of student cognitive engagement and are referred to as (1) Student Disengagement; (2) Student Work with Teacher Not Engaged; (3) Student Work with Teacher Engaged; (4) Teacher-led Instruction; (5) Student Verbal Learning Conversations; (6) Student Active Engaged Learning. The IPI and the IPI-T both utilize each of the six categories. It is important to note that the categories are not considered a hierarchy but rather “six distinct ways to categorize student engagement” (Valentine, 2017). Categories 6 and 5 include learning activities that fall within the higher-order, deeper thinking spectrum of Bloom‟s Taxonomy and Bloom‟s Digital Taxonomy such as analysis and creating while Categories 4, 3, and 2 include lower-order, surface thinking activities such as recalling simple facts and googling for answers.
Tech-use Categories and Definitions
Following is a brief explanation of the Tech-Use Categories and definitions. The categories provide faculty with details about how students are cognitively engaged for each form of tech use:
1. Word Processing. The students are using technology to produce written documents. This category includes note taking, composing papers, editing, formatting, and printing the written material.
2. Math Computations. The students are using technology to perform mathematical computations. This category includes calculating, charting, and plotting with hand-held calculators, spreadsheets, and statistical formulae.
3. Media Development. The students are using technology to collect, manipulate, and/or create media. This category includes the use of technology to collect, edit, and/or design photo, video, and/or audio data and presentations, as well as programming, writing code, and web development.
4. Information Search. The students are using technology to search and/or gather information for their learning task. This category includes the use of the Web and/or other media to access facts, information, and/or insights available through the use of technology.
5. Collaboration Among Individuals. The students are using technology to interact with and/or collaborate with others to accomplish their learning task. This category includes the use technology for all forms of synchronous (same time, usually verbal), communication and many forms of near-synchronous (intermittent or streamed, usually text chat) communication.
6. Experience-Based Immersion Learning. The students are using technology to engage in a tech-driven, immersion learning experience. This category includes the use of technology to engage students in game-based software, intense interactive simulations, and virtual reality associated with classroom learning goals. 7. Interactive/Presentation Technology. The students and/or teacher are using an interactive or presentation
tech tool to support the learning task. This category includes us of software that supports the transfer of information among students and between students and teachers.
8. Other. Occasionally the data collector may determine that none of the seven options adequately describe how students are using technology. This “other” option should be marked if that is the case. However, selection of this “other” option is extremely unusual.
Description of Faculty Collaborative Study Sessions
teachers should have the opportunity to study the data and reflect upon their perceptions of effective learning/instructions” (p. 3). Faculty should converse about best practices and the value of the six categories. Once a baseline is established, discussions about how to change the engagement profiles over time should occur to ensure instructional design and teaching practices evolve. Profiles of many schools have been collected by Valentine. His findings indicate that conversations about the IPI/IPI-T data should take place in a setting of “trust and inquiry, where teachers can be open, not defensive, about profile data” (Valentine, 2017). Valentine, (2017) suggested when studying the data faculty should be reminded the data represent a „snapshot in time‟ of the entire school‟s learning experiences, secondly the six categories are „discreet‟ not „continuous‟, categories three through six are of value of different times throughout the lesson, next the six categories are not a hierarchy, and finally the six categories are distinct ways to categorize student cognitive engagement. Strategies prescribed by Dr. Jerry Valentine (2012b) include:
1. Create a school IPI-T team
2. Educate the faculty about the process 3. Support the IPI-T team and the process 4. Collect data multiple times per school year 5. Inform the faculty of upcoming data collections 6. Collect systematic, proportionate samples
7. Meet as a faculty to study the data after each data collection 8. Engage the faculty in reflecting about the data collection day 9. Engage the faculty in comparisons of the data
10. Create collaborative learning experiences to build new knowledge 11. Disaggregate data per faculty requests
12. Establish annual cognitive engagement goals which support higher-order deeper thinking skills
13. Arrange the setting for collaborative faculty learning 14. Understand faculty perspectives and progress accordingly
The first data collection profile should serve as baseline data and future data collections provide longitudinal perspectives of engaged learning for the school. Valentine (2017) recommends each school collect data four times each school year to achieve optimum impact. Teacher leaders collecting the data should engage faculty in studying the data to identify patterns, trends, and changes in each data profile as well as establish and deliver purposeful professional development and continuous conversations. Valentine (2017) stated, “To make a difference in student cognitive engagement, the faculty IPI/IPI-T collaborative conversations must progress from merely studying profile percentages to learning discussions that deepen knowledge, build a commitment to refinement of instructional practices, particularly increasing higher-order/deeper thinking time and reducing disengagement during class time” (p. 3).
The IPI-T was created through the collaborative discussions among Dr. Jerry Valentine, technology specialists, teachers, and school leaders in an effort to address the growing use of technology in the classroom. The IPI-T was built upon the work of the basic IPI process to provide faculty with additional data to understand student cognitive engagement when technology is being used in the classroom. It is a walkthrough observation process designed to collect data concerning how often and in what ways teachers are integrating technology as well as how often students are cognitively engaged in higher-order, deeper (HO/D) thinking as well as lower-order, surface (LO/S) thinking. The implementation of the IPI-T process includes engaging faculty in collaborative sessions within one week after each data collection. Faculty collaborative sessions allow all faculty to reflect about the data and establish cognitive engagement goals. Implementing the entire IPI-T with fidelity increases the likelihood that the targeted schools will see a positive influence on student achievement as they move toward a 1:1 environment.
Rationale for Studying Student Engagement
instruction to meet the needs of today‟s learners (Autry & Berge, 2011; Milman, 2009; Prensky, 2001a, Tapscott, 2009). Many of today‟s students, particularly as they progress to high school, appear to be disengaged, unmotivated, and uninterested in learning (Prensky, 2001a; Prensky, 2005; Schrum & Levin, 2015). Shernoff, Csikszentmihalyi, Schneider, and Shernoff (2003) reported over a quarter of the day, secondary students are in a disconnected state, such as boredom (as cited by Jensen, 2016). Hattie (2012) reported that expert teachers with the ability to assist students in the development of deep and conceptual understandings have an effect size of 1.0 (p. 32-33). Hattie (2012) referred to the “hinge-point” for identifying what is and what is not effective as d=0.40 or an effect size of 0.40 (p.3). In a blog post titled, “Principal of Change: Stories of Learning and Leading”, Couros (2013) described what today‟s students need to reach their full potential growing up as 21st century learners (as cited by Schrum & Levin, 2015). Couros admitted, although technology is not the focus, it does give us many opportunities to magnify the opportunities such as supporting student voice and student choice, providing time for reflection and opportunities for innovations, foster critical thinking and problem-based learning that supports problem solving among students, opportunities for self-assessment, and connected learning through collaboration not just locally but globally (as cited by Schrum & Levin, 2015). In an effort to align current teaching practices with the integration of technology and reach today‟s students, the IPI and IPI-T process assists in the collection of data to get an insight into how students are engaging in the learning during the instructional activity.
Barriers
Barriers that prevent the integration of technology by classroom teachers are identified and thoroughly documented in the existing literature (Ertmer, 1999; Hew & Brush, 2007; Kopcha, 2012). The Barrier to Technology model, suggests there are two sets of barriers, external and internal, that influence the integration of technology in teachers‟ classrooms (Ertmer, 1999; Ertmer and Leftwich, 2010; Ertmer, Ottenbreit-Leftwich, Sadik, Sendurur, & Sendurur, 2012). First order-external barriers are also known as resource barriers and include such things as sufficient time allowance to prepare for technology-integrated instruction (Hew & Brush, 2007; Kopcha, 2012; Vongkulluksn, Xie, & Bowman, 2018). Vongkulluksnet al. (2018) considered the second order-internal barriers, teachers‟ value beliefs as the “most proximal determinant of technology integration” regarding them most important to using technology for learning (Ertmer, 1999; Ertmer and Ottenbreit-Leftwich, 2010; Ertmer et al., 2012).
Collaborative Learning
Valentine (n.d.) maintained, that periodic collaborative learning among teachers to set common goals, “to build knowledge and professional skills, and to discuss professional values and beliefs together” is the key ingredient in quality professional development that drives learning and academic success of students (Faculty Collaborative Study). Removing barriers to technology use such as sufficient time allowance to prepare for technology-integrated instruction (Hew & Brush, 2007; Kopcha, 2012; Vongkulluksn, Xie, & Bowman, 2018) and increasing teacher‟s ability beliefs increases the likelihood teachers will use technology to fulfill instructional goals that are student-centered and lead to student achievement (Kopcha, 2012; Vongkulluksn, Xie, & Bowman, 2018). Engaging faculty in a series of collaborative study sessions of the IPI-T data has been shown to have the capacity to remove barriers to technology use by teachers to fulfill instructional goals, increase teachers‟ ability beliefs, increase student usage of technology, and positively impact student cognitive engagement and academic success (Jensen, 2016; Valentine 2012a; Valentine, 2013).
Purpose of the Study
place four times during the first year of the Chromebook roll-out. The researcher noticed technology use by the teacher decreased slightly, increasing student use of technology, but disengagement increased dramatically as did the integration of activities that fall within Categories 4, 3, and 2 on the IPI-T. This is not surprising as the researcher and the IPI-T data collection team did not implement the IPI-T process with fidelity. Valentine (2012b) stated, “The greater the implementation integrity to these strategies, the greater the likelihood the school will see positive academic results from their use of the IPI” (p. 1). Missing from the process during the pilot of the IPI-T was the implementation of faculty collaboration sessions. The sessions provide faculty with time to study the data after each data collection, engage faculty in reflecting about the data, create collaborative learning experiences to build new knowledge, and allows faculty voice in establishing annual cognitive engagement goals.
Research Questions
1. To what extent does participation in faculty collaborative study sessions affect
faculty‟s technology use as measured by codes on the Instructional Practices Inventory Technology (IPI-T)?
2. To what extent does participation in faculty collaborative study sessions affect student‟s technology use as measured by codes on the Instructional Practices Inventory-Technology (IPI-T)? 3. How do faculty view their participation in faculty collaborative study sessions? Specifically, did
participating affect the teacher‟s use of technology use in the classroom?
4. How do faculty view their participation in faculty collaborative study sessions? Specifically, did participating affect students‟ use of technology use in the classroom?
Method
The design employed was an explanatory-sequential mixed methods approach. The quantitative portion of this study used the IPI-T instrument, a pre-determined and numerically coded instrument, to collect data concerning the frequency and scale of student cognitive engagement as technology is integrated into the classroom (Larinee, 2003; Valentine 2015c). Observational data collected using the IPI-T was recorded numerically for analysis and interpretation through descriptive and inferential statistics (Valentine 2015c). A web-based questionnaire, created by the researcher, was used to collect qualitative data. The questionnaire consisted of both closed-ended and open-ended questions.
Data collected from the qualitative strand was analyzed for themes and then because the data was collected in sequence, findings were associated with the quantitative results of the IPI-T to determine how and why the data converged. Participation in this study was not a requirement. However, if a faculty member chose to participate, after receiving an overview of this research study, they were asked to sign a research consent form. Each participant was given a signed copy of this form to keep. In addition to the general consent form, consent was sought at the district level, requiring approval from the district‟s superintendent.
Participants
The research participants are employed within a school district located in southern, rural Iowa. The district includes five buildings: (a) preschool; (b) kindergarten and first grade; (c) second through fifth grade; (d) the middle school which houses students in grades six through eight; (e) the high school, grades nine through twelve. This research study involved only the high school, grades 9-12 because technology is nearly one device per two students.
Quantitative
(Larinee, 2003; Valentine 2015c). Observational data collected using the IPI-T was recorded numerically for analysis and interpretation through descriptive and inferential statistics (Valentine 2015c). Inferential statistics were used to analyze the nominal data and main effects of participation in faculty collaborative sessions, particularly the effect on IPI-T student cognitive engagement codes using the parametric statistic of analysis of variance (ANOVA).
Qualitative
The sampling strategy for the qualitative strand was a purposeful sample, utilizing a confirming and disconfirming sampling procedure during the study to follow up on and explore specific findings (Creswell, 2015). A single person from each content area, listed on the IPI/IPI-T Data Recording Form, was identified and invited to volunteer to participate in an open-ended, web-based questionnaire. Content areas included core classes: math, science, social studies, and English and language arts, as well as non-core classes: fine and performing arts, physical education and health, vocational technology, and special education.
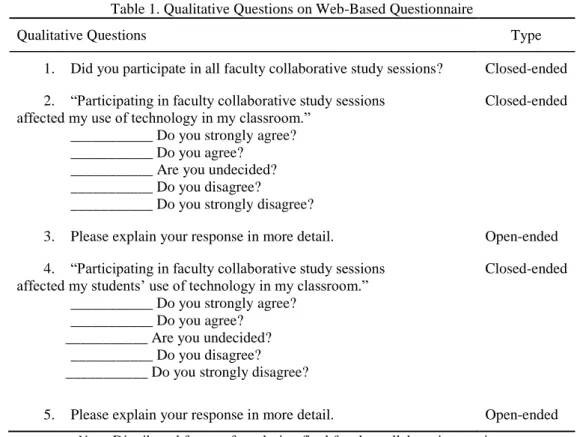
Upon institutional review board approval, eight participants, four representing core courses, and four representing non-core courses were informed about the study face-to-face. They learned about the purpose of the study as well as what to expect if they chose to participate. Once participants agreed they were asked to complete an informed consent form prior to participating. After the consent forms were complete, the eight participants responded to an open-ended, web-based questionnaire created using Google Forms. The questionnaire was distributed during the final faculty collaborative session to only those that agreed to participate (see Table 1).
Table 1. Qualitative Questions on Web-Based Questionnaire
Qualitative Questions Type
1. Did you participate in all faculty collaborative study sessions? Closed-ended 2. “Participating in faculty collaborative study sessions
affected my use of technology in my classroom.” ___________ Do you strongly agree? ___________ Do you agree? ___________ Are you undecided? ___________ Do you disagree? ___________ Do you strongly disagree?
Closed-ended
3. Please explain your response in more detail. Open-ended 4. “Participating in faculty collaborative study sessions
affected my students‟ use of technology in my classroom.” ___________ Do you strongly agree?
___________ Do you agree? ___________ Are you undecided?
___________ Do you disagree? ___________ Do you strongly disagree?
Closed-ended
5. Please explain your response in more detail. Open-ended
Note. Distributed face-to-face during final faculty collaborative session.
Results and Discussion
An examination of the data revealed that participation in faculty collaborative study sessions had a statistically significant impact on student technology use as well as student cognitive engagement when using technology. While teacher technology use did increase, the expected impact of participating in faculty collaborative study sessions was that teachers‟ technology use would actually decrease. Descriptive statistics revealed more often students participate in information searches and word processing when they are the users of technology which are associated with lower-order/surface thinking. Furthermore, results showed that 31% of the codes collected, higher-order/deeper thinking was observed when students were the user of technology. Technology use categories observed at a higher level included media development, collaboration among individuals, and experience-based technology. For the qualitative portion, data were thematically analyzed and interpreted looking for overlapping themes within the open-ended questions, with the goal of providing a greater understanding of the quantitative results and the impact the faculty collaborative study sessions had on technology use and student cognitive engagement. Four key themes emerged: (a) technology integration, (b) implementing new technology, (c) awareness of tech usage, and (d) more time. Of the four themes that emerged from the questionnaire responses, the greatest overlap was regarding awareness. In line with first order-external barriers, all eight participants mentioned that more time is necessary. Specifically, they stated that they need more time to study and analyze the IPI-T data as well as to participate in purposeful professional development.
Research Question 1
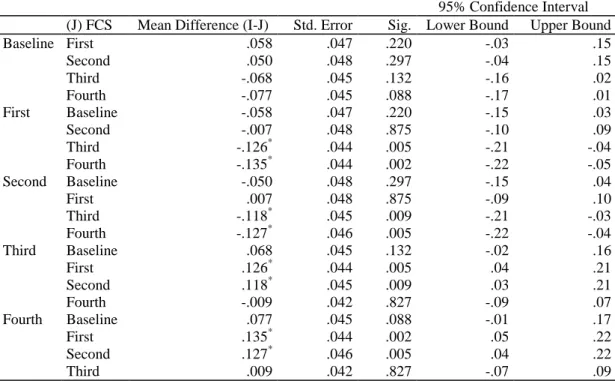
To what extent does participation in faculty collaborative study sessions affect faculty‟s technology use as measured by codes on the Instructional Practices Inventory-Technology (IPI-T)? To answer this question IPI-T data were collected. The data was analyzed using the software program the Statistical Package for Social Science (SPSS). A One-way ANOVA was performed to analyze any differences that might have existed between the variables (see Table 2, 3 and 4). The null hypothesis stated that faculty collaborative sessions have no effect on faculty‟s technology use as measured by codes on the Instructional Practices Inventory – Technology (IPI-T). A One-way ANOVA revealed a significant difference among the baseline, first, second, third, and fourth faculty collaborative sessions, F (1, 1206) = 8.7, p = .003. Baseline codes for teacher use (M = .45, SD = .498) were significantly higher than the First (M = .39, SD = .489), and Second (M = .40, SD = .490) whereas Third (M = .51, SD = .501), and Fourth (M = .52, SD = .500) were significantly higher than the Baseline and Second. There was no significant difference in teacher technology use between the Baseline data and the data collected prior to the Fourth faculty collaborative session (p = .09). Consequently, the null hypothesis was rejected.
Table 2. Multiple Comparisons IPI-T Teacher Technology Use
95% Confidence Interval (J) FCS Mean Difference (I-J) Std. Error Sig. Lower Bound Upper Bound
Baseline First .058 .047 .220 -.03 .15
Second .050 .048 .297 -.04 .15
Third -.068 .045 .132 -.16 .02
Fourth -.077 .045 .088 -.17 .01
First Baseline -.058 .047 .220 -.15 .03
Second -.007 .048 .875 -.10 .09
Third -.126* .044 .005 -.21 -.04
Fourth -.135* .044 .002 -.22 -.05
Second Baseline -.050 .048 .297 -.15 .04
First .007 .048 .875 -.09 .10
Third -.118* .045 .009 -.21 -.03
Fourth -.127* .046 .005 -.22 -.04
Third Baseline .068 .045 .132 -.02 .16
First .126* .044 .005 .04 .21
Second .118* .045 .009 .03 .21
Fourth -.009 .042 .827 -.09 .07
Fourth Baseline .077 .045 .088 -.01 .17
First .135* .044 .002 .05 .22
Second .127* .046 .005 .04 .22
Third .009 .042 .827 -.07 .09
Table 3. Teacher Technology Use
95% Confidence Interval for Mean
FCS N Mean Std. Dev. Std.
Error
Lower Bound
Higher Bound
Min. Max.
Baseline 215 .45 .498 .034 .38 .51 0 1
First 229 .39 .489 .032 .33 .45 0 1
Second 207 .40 .490 .034 .33 .46 0 1
Third 280 .51 .501 .030 .46 .57 0 1
Fourth 277 .52 .500 .030 .46 .58 0 1
Total 1208 .46 .499 .014 .43 .49 0 1
Note. Teachers (n=27). FCS=Faculty Collaborative Sessions.
Table 4.ANOVA Effects of FCS* on Teacher Use of Technology
Sum of Squares df Mean Square F Sig.
Between Groups 17.493 1 17.493 8.667 .003
Within Groups 2434.155 1206 2.018
Total 2451.648 1207
Note. p < .05
Research Question 2
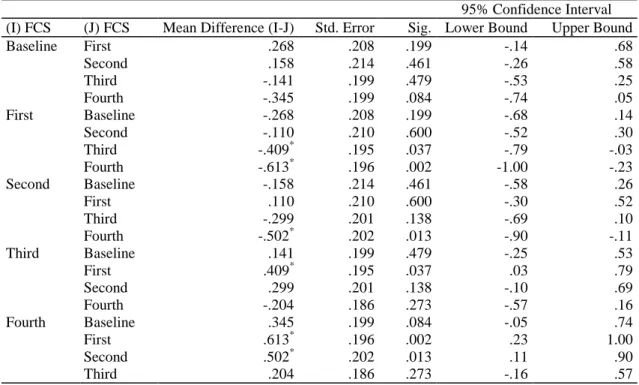
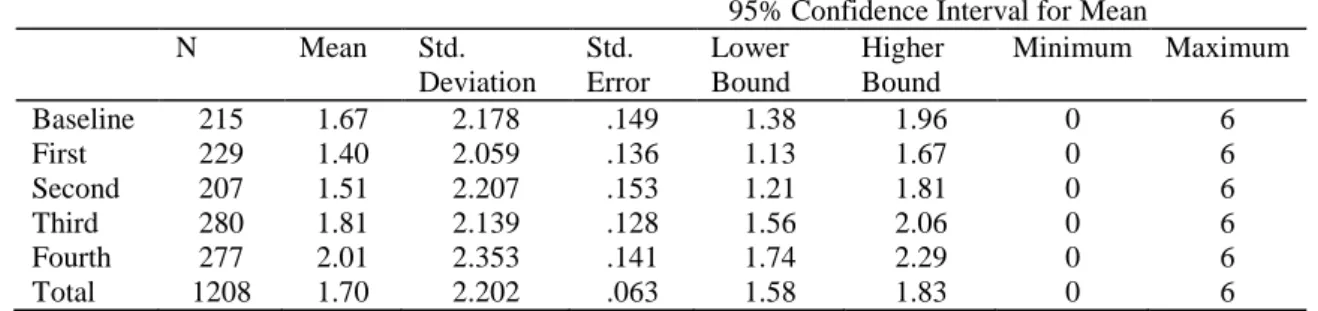
To what extent does participation in faculty collaborative study sessions affect students‟ technology use as measured by codes on the Instructional Practices Inventory-Technology (T)? To answer these questions IPI-T data were collected. IPI-The data was analyzed using the software program the Statistical Package for Social Science (SPSS). A One-way ANOVA was performed to analyze any differences that may exist between the variables (see Table 5, 6, and 7). The null hypothesis stated that faculty collaborative sessions have no effect on students‟ technology use as measured by codes on the Instructional Practices Inventory – Technology (IPI-T). A One-way ANOVA revealed a significant difference among the baseline, first, second, third, and fourth faculty collaborative sessions, F (4, 1203) = 3.4, p = .02. Baseline codes for student use (M = 1.67, SD = 2.17) were significantly higher than the First (M = 1.40, SD = 2.05), and Second (M = 1.51, SD = 2.21) whereas the Third (M = 1.81, SD = 2.14), and Fourth (M = 2.01, SD =2.35) were significantly higher than the Baseline and Second. There was no significant difference in students‟ technology use between the Baseline data and the data collected prior to the fourth faculty collaborative session (p=.08). Consequently, the null hypothesis was rejected.
Table 5. Multiple Comparisons IPI-T Student Engagement Codes
95% Confidence Interval (I) FCS (J) FCS Mean Difference (I-J) Std. Error Sig. Lower Bound Upper Bound
Baseline First .268 .208 .199 -.14 .68
Second .158 .214 .461 -.26 .58
Third -.141 .199 .479 -.53 .25
Fourth -.345 .199 .084 -.74 .05
First Baseline -.268 .208 .199 -.68 .14
Second -.110 .210 .600 -.52 .30
Third -.409* .195 .037 -.79 -.03
Fourth -.613* .196 .002 -1.00 -.23
Second Baseline -.158 .214 .461 -.58 .26
First .110 .210 .600 -.30 .52
Third -.299 .201 .138 -.69 .10
Fourth -.502* .202 .013 -.90 -.11
Third Baseline .141 .199 .479 -.25 .53
First .409* .195 .037 .03 .79
Second .299 .201 .138 -.10 .69
Fourth -.204 .186 .273 -.57 .16
Fourth Baseline .345 .199 .084 -.05 .74
First .613* .196 .002 .23 1.00
Second .502* .202 .013 .11 .90
Third .204 .186 .273 -.16 .57
Table 6. Students‟ Technology Use
95% Confidence Interval for Mean
N Mean Std.
Deviation Std. Error
Lower Bound
Higher Bound
Minimum Maximum
Baseline 215 1.67 2.178 .149 1.38 1.96 0 6
First 229 1.40 2.059 .136 1.13 1.67 0 6
Second 207 1.51 2.207 .153 1.21 1.81 0 6
Third 280 1.81 2.139 .128 1.56 2.06 0 6
Fourth 277 2.01 2.353 .141 1.74 2.29 0 6
Total 1208 1.70 2.202 .063 1.58 1.83 0 6
Table 7. ANOVA Effects of FCS* on Student Cognitive Engagement When Using Technology
Sum of Squares df Mean Square F Sig.
Between Groups 58.681 4 14.670 3.407 .016*
Within Groups 5791.223 1203 4.814
Total 5849.904 1207
*Note. FCS=Faculty Collaborative Sessions. p < .05.
Research Question 3
How do faculty view their participation in faculty collaborative study sessions? Specifically, did participating affect the teacher‟s use of technology use in the classroom? Question 1 was a closed-ended question and asked,
did you participate in all faculty collaborative study sessions? Each of the eight participants (100%) responded “yes”. Question 2 was also a closed-ended question and asked participants to rate the impact of faculty collaborative sessions on their own use of technology in their classroom. On a scale of strongly agree to strongly disagree, two participants chose “strongly agree” and six participants chose “agree”. Two key themes emerged from participant responses: technology integration and implementing new technology.
Research Question 4
How do faculty view their participation in faculty collaborative study sessions? Specifically, did participating affect students‟ use of technology use in the classroom? Question 4 was a closed-ended question and asked participants to rate the impact of faculty collaborative sessions on students‟ use of technology in their classroom. On a scale of strongly agree to strongly disagree, four participants chose “strongly agree” and four participants chose “agree”. Two key themes emerged from participant responses: awareness and the need for more time. More time to not only collect data but to continue to participate in faculty collaborative study sessions. Faculty expressed the need to continue the build longitudinal data in an effort track trends and patterns. In addition, responses indicated the need for time to be allotted so that faculty can participate in purposeful professional development opportunities that are designed to integration educational technology in and in a higher-order manner.
Conclusion
The purpose of this explanatory-sequential mixed method study was to assess the impact of the IPI-T process on technology use and student cognitive engagement. The goal was to implement all strategies, including faculty collaborative sessions four times per year to support teacher implementation of new technology to increase higher-order, deeper thinking by students and increase student use of technology. The impact was measured by comparing quantitative IPI-T data codes of those faculty that participated in the intervention group with baseline data prior to the implementation of the faculty collaborative study sessions. Data collected during the quantitative phase was the emphasis of this study. Qualitative data was gathered from one participant from each core and non-core area, a total of eight participants. Each were asked to answer questions on a web-based questionnaire during the final faculty collaborative session. Four key themes emerged and each were associated with the quantitative portion of the study.
a team of specialists. The IPI-T is an „add-on‟ component designed for schools that have experience with the IPI process and are currently 1:1 (one technology device per student) or planning to soon become 1:1 or high-tech schools. Implementing the entire IPI-T process with fidelity has been shown to have a positive influence on student technology use and student cognitive engagement. School board members in the targeted district have already purchased $250,000 worth of Chromebooks and have committed to additional purchases in the upcoming school year. As they move toward a 1:1 environment, longitudinal data can be studied and the IPI-T process can drive collaborative discussions among teachers and leaders to ensure a successful adoption of technology.
Recommendations
This mixed methods study contributes to the overall understanding of the capacity of removing barriers to technology use when faculty engage collaboratively in the analysis of data and instructional practices on a regular basis to fulfill instructional goals, increase student usage of technology, and positively impact student cognitive engagement and academic success. Future research should extend these findings by replicating this study with faculty from the same school district in different grade levels or with the same faculty, grades 9-12, to gather longitudinal data. Findings from future research, examining the impact of participating in faculty collaborative study sessions at multiple grade levels, could be used to inform district initiatives, school improvement, and the development of professional development to integrate technology. The IPI and IPI-T encourages faculty members to work towards a balance of higher and lower levels of student cognitive engagement through incremental changes in instructional practice (Dennis, 2013). Gathering longitudinal data could be used to inform change in instructional practices over time. Additionally, future studies should include an examination of the change in technology instructional practices when faculty participate in faculty collaborative study sessions over a period of time.
In an effort to increase student use of technology and align current teaching practices with the integration of technology, the IPI-T process assisted in the collection of data to get an insight into how students were cognitively engaged in the learning during the instructional activity. Implementing the IPI-T process in its entirety encouraged faculty members to study the data and think collaboratively about ways to work towards a balance of higher and lower levels of student cognitive engagement through incremental changes in instructional practice (Dennis, 2013). Categories 6 and 5 include learning activities that fall within the higher-order/deeper thinking spectrum of Bloom‟s Taxonomy and Bloom‟s Digital Taxonomy such as media development, collaboration among others, and experience or problem based learning. This study identified a relationship between specific technology-use categories and specific IPI-T student cognitive engagement codes. Studies should be done to identify engaging activities designed for specific technology-use categories that promote higher-order thinking.
References
Autry, Alex J., Jr, & Berge, Z. (2011). Digital natives and digital immigrants: Getting to know each other.
Industrial and Commercial Training, 43(7), 460-466. doi:10.1108/00197851111171890
Creswell, J. W. (2015). Educational research: Planning, conducting, and evaluating quantitative and qualitative research (5th ed.). Lincoln, NE: Pearson.
Cuban, L., Kirkpatrick, H., & Peck, P. (2001). High access and low use of technologies in high school classrooms: Explaining an apparent paradox. American Educational Research Journal, 38(4), 813-834. Dennis, L. B. (2013). How Are Teachers Integrating Technology in K-5 Classrooms? Studying Student
Cognitive Engagement Using the Instructional Practices Inventory-Technology (IPI-T) Instrument. New Mexico State University, Las Cruces, New Mexico.
Ertmer, P. A. (1999). Addressing first-and second-order barriers to change: Strategies for technology integration. Educational Technology Research and Development,47(4), 47-61, doi:10.1007/BF02299597 Ertmer, P. A. & Ottenbreit-Leftwich, A. T. (2010). Teacher technology change: How knowledge, confidence,
beliefs, and culture intersect. JRTE, 42(3), 255-284. doi: 10.1080/15391523.2010.10782551
Ertmer, P. A., Ottenbreit-Leftwich, A. T., Sadik, O., Sendurur, E., & Sendurur, P. (2012). Teacher beliefs and technology integration practices: A critical relationship. Computer & Education 59, 423-435, doi:10.1016/j.compedu.2012.02.001
Hattie, J. (2012). Visible learning for teachers: Maximizing impact on learning. New York: Routledge.
Jensen, E. (2016). Poor students, rich teaching: Mindsets for change. Indiana: Solution Tree Press.
Kopcha, T. J. (2012). Teachers‟ perceptions of the barriers to technology integration and practices with technology under situated professional development. Computers and Education, 59(4), 1109-1121, doi:10.1016/j.compedu.2012.05.014
Larinee, D. B. (2013). How are teachers integrating technology in K-5 classrooms: Studying student cognitive engagement using the Instructional Practices Inventory-Technology (IPI-T) instrument. (Unpublished doctoral dissertation). New Mexico University, New Mexico.
McCrindle, M. (2014). The ABC of XYZ: Understanding the global generations. Australia: A McCrindle Publication.
Milman, N. B. (2009). Are students today really different? Distance Learning, 6(2), 59-61. Retrieved from http://search.proquest.com.ezproxylocal.library.nova.edu/docview/230703086?accountid=6579
Prensky, M. (2001a). Digital Natives, Digital Immigrants, part I. On the Horizon, 9(5), 1-6. Retrieved from http://old.ektf.hu/~kbert/2014_15_01/erasmus/DigitalNativesPartIII.pdf
Prensky, M. (2001b). Digital Natives, Digital Immigrants, part II: Do they really think differently? On the
Horizon, 9(6), 1-10. Retrieved from
http://www.taylorprograms.com/images/Marc_Prensky_Digital_natives_2.pdf
Prensky, M. (2005). Teaching digital natives: Partnering for real learning. Retrieved from http://marcprensky.com/wp-content/uploads/2013/04/Prensky-TEACHING_DIGITAL_NATIVES-Introduction1.pdf
Prensky, M. (2015). Teaching Digital Natives: Partnering for real learning. California: Corwin.
Russell, M., Bebell, D., O‟Dwyer, L., & O‟Connor, K. (2003). Examining teacher technology use implications for preservice and inservice teacher preparation. Journal of Teacher Education, 54(4), 297-310.
Schrum, L. & Levin, B. (2012). Leading 21st century schools. California: Corwin.
Schrum, L. & Levin, B. (2015). Evidence-based strategies for leading 21st century schools. California: Corwin. Tapscott, D. (2009). Growing up digital: How the Net Generation is changing our world. New York: McGraw
Hill.
Valentine, J. (2012a). IPI component basic workshop description. Unpublished manuscript. Valentine, J. (2012b). Strategies for IPI implementation. Unpublished manuscript.
Valentine, J. (2013). Frequently requested facts and figures about student engagement. Unpublished manuscript. Valentine, J. (2015). The Instructional Practices Inventory- Technology (IPI-T): IPI-Technology Component
Workshop description. Unpublished manuscript.
Valentine, J. (2017). The IPI Process-Basic perspectives. Unpublished manuscript.
Valentine, J. (n.d.). Faculty collaborative study. Retrieved from: https://ipistudentengagement.com/ipi-process-in-depth/faculty-collaborative-study
Vongkulluksn, V. W., Xie, K., & Bowman, M. (2018). The role of value on teachers‟ internalization of external barriers and externalization of personal beliefs for classroom technology integration. Computers and Education, 118, 70-81, doi: 10.1016/j.compedu.2017.11.009
Zhao, Y., Pugh, K., Sheldon, S., & Byers, J. L. (2002). Conditions for classroom technology innovations.
Teachers College Record, 104(3), 482-515.
Author Information
Mekca Wallace-Spurgin Centerville School District
634 North Main, Centerville, IA 52531 USA