23 Asian Journal of Social Sciences and Management Studies Vol. 5, No. 1, 23-31, 2018 ISSN(E) 2313-7401 / ISSN(P) 2518-0096 DOI: 10.20448/journal.500.2018.51.23.31
Digital Study of the Protestant Market: Taipei and Provincial Capital Cities in
China's Southeast Coast as Case Studies
Zhaohui Hong
1Jianfeng Jin
21Fordham University, USA 2Purdue University Northwest, USA
( Corresponding Author)
Abstract
Addressing the digital and spatial study of the Protestant market in Taiwan and mainland China is pioneering attempt to enhance the Christian study in Asia. The article selects Taipei and China's five additional provincial capital cities in the southeast coast to calculate and map the supply-side and demand-side of the Protestant market in the early of 21st century. Utilizing the digital and spatial methods, the article provides a comparative perspective in measuring the Protestant density, accessibility and availability of Taipei and five capital cities in China's southeast coast. The article concludes that in light of a democratic society with a religious freedom policy, Taipei has enjoyed a healthy Protestant market demonstrated by its better Protestant density, accessibility and availability.
Keywords: Digital study, Spatial study, Protestant market church, Accessibility, Church availability.
Citation | Zhaohui Hong; Jianfeng Jin (2018). Digital Study of the Protestant Market: Taipei and Provincial Capital Cities in China's Southeast Coast as Case Studies. Asian Journal of Social Sciences and Management Studies, 5(1): 23-31.
History:
Received: 21 December 2017 Revised: 23 January 2018 Accepted: 26 January 2018 Published: 30 January 2018
Licensed: This work is licensed under a Creative Commons Attribution 3.0 License
Publisher: Asian Online Journal Publishing Group
Contribution/Acknowledgement: The authors would also like to express their sincere appreciation to Drs. Ching-chih Lin and Hodna Hung for their valuable suggestions and assistances.
Funding: The authors are grateful for two grants supported by the Henry Luce Foundation from 2011 to 2017, "Establishing a Spatial Information Network for the Study of Christianity in China" (No. 4301-41573) and "the Spatial Study of Chinese Religion and Society" (No. 4301-59088).
Competing Interests: The authors declare that they have no conflict of interests.
Transparency: The authors confirm that the manuscript is an honest, accurate, and transparent account of the study was reported; that no vital features of the study have been omitted; and that any discrepancies from the study as planned have been explained.
Ethical: This study follows all ethical practices during writing.
Contents
1. Introduction ... 24
2. Methodology and Data ... 24
3. Overview and the Density of Protestant Church in Taiwan and Mainland China ... 24
4. Conclusion ... 30
24
1. Introduction
As the capital city of Taiwan, Taipei has demonstrated its dynamic development of Protestant market in the past years (Rubinstein, 1991; Lee and Sun, 1995; Chao, 2006). Through comparative perspective, an effort is made to improve understand of the Protestant churches and Protestants in Taipei, located in China’s southeast coast. This is a meaningful and pioneering attempt to utilize digital and spatial reference to bring together China’s five additional provincial capital cities in the southeast coast--Guangzhou, Fuzhou, Hangzhou, Shanghai, and Nanjing
(Dunch, 2001; Wu, 2003; Wu, 2005; Xue et al., 2009; Keating, 2012; Hong et al., 2014).
This study is designed to utilize the digital and spatial methods in calculating and mapping the supply-side of the Protestant market or Protestant churches, as well as the demand-side of Protestant market or Protestant population in Taipei and other five east coast capital cities in mainland China. Presently, many scholars perceive that given the current religious regulations and persecution, mainland Chinese Protestants are suffering from the crisis of Protestant population demand over Protestant church supply (Leung and Liu, 2004; Grim and Finke, 2010; Hong et al., 2014) while Taipei, as a democratic society, is enjoying its religious freedom and government deregulation over religious affairs (Katz, 2003; Madsen, 2007). However, few scholars, if any, have provided digital, spatial and comparative perspectives in measuring the Protestant density, accessibility and availability of the six provincial capital cities in China's southeast coast. This article intends to address the digital differences of the Protestant market in Taiwan and mainland China, and shed light on the general understanding of the Chinese religious market and the spatial image of Protestant market.
2. Methodology and Data
Benefitting from conventional statistical methods, this article discusses the density of Protestants through measuring the members of Protestants and the number of Protestant churches based on a case study of six cities, including Taipei, Guangzhou, Fuzhou, Hangzhou, Shanghai and Nanjing. In addition, three spatial and digital methods are utilized to validate and develop what the statistical method has demonstrated about the density of Protestants. As the first spatial method, the Two-Step Floating Catchments Area (2SFCA) is capable of calculating the Protestant church accessibility score, which demonstrates the different distances from Protestant's residential area to the nearest church. As the supplement, the Network Analysis Method (NAM) is useful to conduct time measurement, estimating the driving time for Protestants from home to the nearest church in order to address the Protestant church availability. Meanwhile, this article applies the Location Analysis Method (LAM) as the third tool to compare the similarities and differences of research findings and explain the disparity demonstrated by different research methods. Although the three different spatial methods are using different measurements through selecting 30 minutes of one-way driving by the NAM, 20 minutes by the 2SFCA and 15 minutes by the LAM, each method applies to all six cities consistently and equally.
After discussing the research findings, this article compares the different rankings of Protestant church accessibility and availability among six cities, based on the statistical and spatial methods. As a result, this study demonstrates the best and worst rankings of church accessibility and availability. Following the similar methodology, scholars may expand their research areas to other cities in both Taiwan and mainland China.
With respect to the Protestant church information concerning the five provincial capital cities in mainland China, this study relies on the government official data demonstrated by the Chinese Baidu Map in 2015. In addition, this study takes reference from The 2004 China’s Economic Census Data with GIS Maps, published by the China Census Bureau. Regarding the Protestant population data, this article reviews and selects some reliable statistical information provided by the city government agencies, census data and scholarly research papers. Furthermore, this study benefits from a spatial and digital platform, the Religious Explorer of China--supported by the Henry Luce Foundation and developed by the University of Michigan and Purdue University--to visualize and map the church accessibility and availability in mainland China.
3. Overview and the Density of Protestant Church in Taiwan and Mainland China
25 Map-1. Location of the Six Cities
Benefitting from the digital and spatial techniques, Map 2below denotes the spatial maps in which each dot represents the location of Protestant churches in the selected six cities (see Map 2).
Map-2. Spatial Maps of Protestant Churches in Taipei (2010) and the Five Cities in Mainland China (2015)
26
For the first step, in order to calculate the density of Protestants, the priority and challenge is to estimate the Protestant population number in each city because there is limited data available on the Protestant information for all cities. Given that, this study has to select the years as close as possible for the six cities. While the information concerning Taiwan, Taipei, Guangzhou and Nanjing's Protestant population is available from 2015, other cities--including the data of national Protestant population in mainland China--is spread from 2001 to 2013. Indicated by Table 1 below, while mainland China had 1.74% of Protestant members in 2010 and Taiwan had 5.61% of Protestants in 2015, Taipei had its highest rate of Protestants (13.07%) in 2015 and Guangzhou had its lowest rate (0.72%). Table 1 also lists the estimated number of Protestant population based on the calculation of the latest census data. In particular, Table 1includes the reference information concerning Protestant data.
Table-1. Protestant Population in Mainland China, Taiwan, and the Six Capital Cities (2010-2015)
Location Protestant Population Percentage of Protestant Source
Mainland China 23,050,000 1.74% Research Project Team of the Institute of World Religious Studies in the Chinese Academy of Social Sciences (2010)
Taiwan 1,307,842 5.61% Mitchell (2015)
Hangzhou 33,594 1.50% Hangzhou Statistical Information Network (2010)
Taipei 288,793 13.07% Mitchell (2015)
Guangzhou 45,308 0.72% Guangzhou Municipal Bureau of Ethnic and Religious Affairs (2015)
Fuzhou 72,231 2.47% Amity Foundation (2004)
Shanghai 97,869 1.58% Shanghai Bureau of Ethnic and Religious Affairs (2014)
Nanjing 57,106 2.35% Nanjing Bureau of Ethnic and Religious Affairs (2015)
For the second step in estimating the density of Protestants, it is vital to determine the number of Protestant churches in the selected cities. Table 2 provides the big picture in listing the number of Protestant churches in mainland China and Taiwan. Table 2also indicates that Taipei had 543 churches in 2015, while the other five cities in mainland China increased the number of churches from 16 to 35 in 2015, as demonstrated by the Baibu Map, which is a "Chinese Google Map." With respect to searching the church information through Baidu, the first step is to allocate the information concerning the altitude and latitude through
http://api.map.baidu.com/lbsapi/getpoint/index.html.
After searching each city district, it is necessary to input data into an Excel spreadsheet in order to insert all data into the ArcGIS.
Table-2. The Number of Protestant Churches in Mainland China, Taiwan and the Six Capital Cities
Location Number of Protestant Churches Source
Mainland China 11,463 China Census Bureau (2005)
Taiwan 4,101 Mitchell (2015)
Hangzhou 35 Baidu Map (2015)
Taipei 543 Mitchell (2015)
Guangzhou 22 Baidu Map (2015)
Fuzhou 25 Baidu Map (2015)
Shanghai 23 Baidu Map (2015)
Nanjing 16 Baidu Map (2015)
In light of this data about the Protestant population and churches, it is feasible to summarize the density of Protestants for all six cities, in addition to mainland China and Taiwan. Table 3 below denotes the density of Protestants in both mainland China and Taiwan, which have a large gap in terms of the average number of Protestants per church. While 2,011 Protestants in mainland China had to share one church in 2010, there were 319 Protestants by average using one church in Taiwan--6.3 times higher than that of mainland China. With respect to the selected six cities, similarly, 532 Protestants in Taipei were accommodated by one church on average, while the average number of Protestants in each church in other five provincial capital cities had more than the national average--except for Hangzhou (960). Table 3 also lists the rankings of Protestant density indicating that Taipei is the best and Shanghai is the worst place in terms of the Protestant density.
Table-3. The Density of Protestants in Mainland China, Taiwan, and the Six Cities
Location Number of Protestants Percentage of Protestants Number of Protestant Churches Average Number of Protestants per Church Rankings of Density
Taiwan 1,307,842 5.61% 4,101 319 1
Taipei 288,793 13.07% 543 532 2
Hangzhou 33,594 1.50% 35 960 3
Mainland China 23,050,000 1.74% 11,463 2,011 4
Guangzhou 45,308 0.72% 22 2,059 5
Fuzhou 72,123 2.47% 31 2,330 6
Nanjing 57,106 2.35% 16 3,569 7
Shanghai 97,869 1.58% 23 4,255 8
3.1. Spatial Measurement of Protestant Market
27
effective in measuring the driving time from a Protestant's residential area to the closest church. Provided the available map techniques, setting up 20-minutes of one-way driving may demonstrate the church accessibility score through 2SFCA (see Map 3below).
Map-3. The Protestant Church Accessibility Scores in the Six Cities by the 2SFCA
28
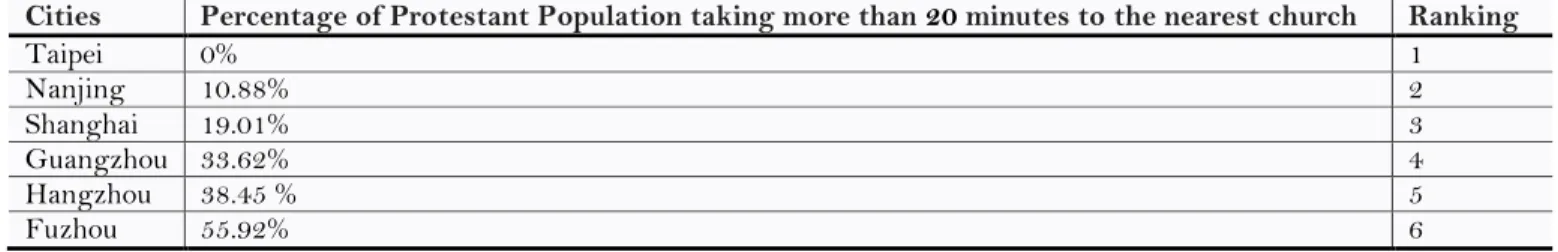
After exporting the data based on the 2SFCA, Table 4below lists the statistical information concerning church accessibility in the six cities. Obviously, Taipei has its best church accessibility, which is consistent with the density of church information, as all Protestants in Taipei can reach their nearest church within 20 minutes of one-way driving. However, 10.88% of Protestants in Nanjing, 19.01% in Shanghai, 33.62% in Guangzhou, 35.45% in Hangzhou and 55.92% in Fuzhou would take more than 20 minutes to travel to their nearest churches.
Table-4. Protestant Church Accessibility in the Six Cities by the 2SFCA
Cities Percentage of Protestant Population taking more than 20 minutes to the nearest church Ranking
Taipei 0% 1
Nanjing 10.88% 2
Shanghai 19.01% 3
Guangzhou 33.62% 4
Hangzhou 38.45 % 5
Fuzhou 55.92% 6
As a supplement, the Network Analysis Method (NAM) has been used to double check the driving time from a Protestant's residential area to the nearest churches. In an attempt to accommodate the NAM, this study selects the driving time of 30 minutes instead of 20 minutes in all six cities, but adds 12 km as the distance from Protestant's home to the nearest church. Map 4below shows the three different measurements: the area with the yellow color represents 6 km and 15 minutes of one-way driving, while the area with the green means 12 km and 30 minutes of driving and the area with red color symbolizes 18 km and 45 minutes of driving from a Protestant's residential area to the closest church.
Map-4. The Protestant Church Availability and Accessibility by the NAM
29 Table-5. Protestant Church Accessibility in the Six Cities by the NAM (30 minutes)
12km
(30minute) Accumulated Area (km2) Protestant Area Coverage (km2)
Percentage of Protestant Can't Reach the Nearest Church
Number of Protestant Who
Can’t Reach Ranking
Taipei 946.169 182,397 36.73% 105,887 1
Hangzhou 1,562.837 20,909 37.76% 12,685 2
Fuzhou 1,417.048 856.525 39.56% 6,497 3
Shanghai 1,964.430 1,138.450 42.05% 97,869 4
Nanjing 1,864.611 1,058.757 43.22% 24,680 5
Guangzhou 3,717.82 1,991.308 46.44% 21,040 6
As a result, Table 5above summarizes the rankings among the six cities in terms of their church accessibility. Given the fact that 36.73% of the Protestants in Taipei can reach their nearest church within the designated time and distance, Taipei is ranked the best area again for its church accessibility. By contrast, 46.44% of the Protestants in Guangzhou are unable to get the nearest church within 30 minutes and 12 km, it is ranked as the worst area of accessibility relatively.
Furthermore, it may provide added value through utilizing the Location Analysis Method (LAM) as additional supplement to address the spatial study of church availability and accessibility in the six cities. Given the limited scope of mapping and virtualization, the designated driving time and distance have to be limited to 3 km and 15 minutes. As long as all six cities utilize the same measurement through a specific spatial method, it should be consistent and acceptable although it is not ideal.
The center of yellow circle on the Map 5below represents the location of each church, while the circle itself covers the area that each Protestant can reach the nearest church within 3 km and 10 minutes of driving.
30 Table-6. Protestant Church Availability and Accessibility in the Six Cities by the LAM (10 minutes and 3 km)
3 km (10 min.) Number of People in the City Percentage of Protestants who can't arrive in the nearest church Ranking
Taipei 2,618,383 0.00% 1
Shanghai 6,181,683 0.00% 2
Nanjing 2,430,729 3.46% 3
Hangzhou 2,239,600 7.88% 4
Guangzhou 6,285,000 32.30% 5
Fuzhou 2,921,763 48.56% 6
The Table 6 above demonstrates that all Protestants in both Taipei and Shanghai can reach their nearest churches within 10 minutes within 3 km of distance. By contrast, more than thirty percent of Protestants in Guangzhou and Fuzhou are unable to make it with the same time and distance while both Nanjing and Hangzhou stay in the middle as the rankings of Protestant church availability and accessibility.
After studying the Protestant church availability and accessibility in the six cities through statistical and three spatial methods (2SFCA, NAM and LAM), it is essential to provide a general picture by means of comparing their averaged rankings based on the different research methods. Table 7 below indicates that Taipei consistently has the best ranking of Protestant church accessibility, as demonstrated by the digital density and spatial 2SFCA, NAM and LAM. Meanwhile, Fuzhou and Guangzhou are ranked at the bottom of church accessibility, while Hangzhou, Shanghai and Nanjing stay in the middle rankings among the six cities.
Table-7. The Combined Rankings of Protestant Church Accessibility in the Six Cities
Density
Rankings Rankings LAM by Rankings NAM by Rankings 2SFCA by Combined Rankings
Taipei 1 1 1 1 1.00
Hangzhou 2 4 2 5 3.25
Shanghai 6 2 4 3 3.75
Nanjing 5 3 5 2 3.75
Fuzhou 4 6 3 6 4.75
Guangzhou 3 5 6 4 4.75
4. Conclusion
This spatial study has explored various new research fields that the conventional quantitative research is unable to address. However, given the incomplete and inaccurate data about the Protestant church and Protestants in the mainland, scholars could not expect the full picture of the Chinese Protestant market. In addition, the spatial methods cannot totally replace the traditional empirical survey, interview and participant observation, which may provide micro pictures and qualitative interpretations in depth.
Meanwhile, after comparing the different Protestant situations in the six capital cities by the digital and spatial studies, it is obvious that Taipei, as a democratic society, demonstrates that the religious freedom matters to the healthy Protestant market indicated by better church density, accessibility and availability. However, there may be more reasons for the better Protestant market in Taipei. The bottom line is that the information concerning the number of Protestant churches and members of Protestants in Taipei is much more accurate, complete, reliable, and more importantly, much accessible and open to the public. It may deliver a clear message that any societies and countries in favor of the religious persecution and tough religious regulations may damage the supply-side and demand-side of Protestant market.
References
Amity Foundation, 2004. How many sheep are there in the Chinese flock? Amity News Services. Retrieved from http://www.amitynewsservice.org.
Baidu Map, 2015. Christian Churches in Fuzhou. Baidu Online Network Technology Co., Ltd. Retrieved from http://api.map.baidu.com/lbsapi/getpoint/index.html.
Bickers, R., 1999. Britain in China: Community, culture and colonialism, 1900-49. Manchester: Manchester University Press.
Chao, H.K., 2006. Conversion to protestantism among urban immigrants in Taiwan. Sociology of Religion, 67(2): 193-204. View at Google
Scholar | View at Publisher
China Census Bureau, 2005. The 2004 China’s economic census data with GIS Maps. Beijing: All China Market Research Co., Ltd. Dees, S., 1998. Foreign direct investment in China: Determinants and effects. Economics of Planning, 31(2-3): 175-194.View at Google Scholar
Dunch, R., 2001. Protestant Christianity in China today: Fragile, fragmented, flourishing. China and Christianity: Burdened Past, hopeful future. New York: M.E. Sharpe, Inc.
Goodman, D.S., 1997. China's provinces in reform: Class, community, and political culture. London: Taylor & Francis US.
Grim, B.J. and R. Finke, 2010. The price of freedom denied: Religious persecution and conflict in the twenty-first century. NY: Cambridge University Press.
Guangzhou Municipal Bureau of Ethnic and Religious Affairs, 2015. An overview of the Christian Church in Guangzhou. Guangzhou Municipal Bureau of Ethnic and Religious Affairs. Retrieved from http://www.gzmzzj.gov.cn/mzzjswj/zjgs/201512/c5cd71f0461b4280be1d039aa651d9b2.shtml.
Hangzhou Statistical Information Network, 2010. The population of Sub-regions with total population of Hangzhou. 2010 Yearbook of Hangzhou.
Hong, Z., J. Yan and L. Cao, 2014. Spatial and statistical perspectives on the protestant Church shortage in China: Case studies in Hangzhou, Zhengzhou, Hefei and Fuzhou Cities. Journal of Third World Studies, 31(1): 23-31.View at Google Scholar
Johnson, G.E., 1992. The political economy of Chinese urbanization: Guangdong and the pearl River Delta Region. Westport: Greenwood Press.
Katz, P.R., 2003. Religion and the State in post-War Taiwan. China Quarterly, 174(1): 395-341.View at Google Scholar | View at Publisher
Keating, J.C.W., 2012. A protestant Church in communist China: Moore memorial Church Shanghai, 1949-1989. Bethlehem: Lehigh University Press; Lanham, Md: Co-Published with Rowman & Littlefield Pub. Group.
Lee, M.L. and T.H. Sun, 1995. The family and demography in contemporary Taiwan. Journal of Comparative Family Studies, 26(1): 101-115.
View at Google Scholar
31 Madsen, R., 2007. Democracy's dharma: Religious renaissance and political development in Taiwan. California: University of California
Press.
Mitchell, R., 2015. Taiwan Church growth report 2015. One Challenge’s Global Research Team. Retrieved from http://www.ocresearch.info/sites/default/files/Taiwan%20Church%20Growth%20Report%202015.pdf.
Nanjing Bureau of Ethnic and Religious Affairs, 2015. An overview of the Christian Church in Nanjing. Nanjing Bureau of Ethnic and Religious Affairs. Retrieved from http://mzzjj.nanjing.gov.cn/33609/33628/njjdj/.
Research Project Team of the Institute of World Religious Studies in the Chinese Academy of Social Sciences, 2010. The survey Report on China’s Christians. (Zhongguo Jidujiao Ruhu Wenjuan Diaocha Baogao). Annual Report on China’s Religions, Ed. Jin Ze and Qiu Yonghui, Beijing: Shehui Kexue Wenxian Chubanshe. pp: 190-212.
Rubinstein, M.A., 1991. The protestant community on modern Taiwan: Mission, Seminary, and Church. New York: M.E. Sharpe.
Shanghai Bureau of Ethnic and Religious Affairs, 2014. An overview of the Christian Church in Shanghai. Shanghai Bureau of Ethnic and Religious Affairs. Retrieved from http://www.shmzw.gov.cn/gb/mzw/shzj/jdj/index.html.
Shen, D.P. and W.F. Zhu, 1998. Western missionary influence on the people's Republic of China: A survey of Chinese scholarly opinion between 1980 and 1990. International Bulletin of Missionary Research, 22(4): 154-158.View at Google Scholar | View at Publisher
Waley, A., 2013. The opium war through Chinese eyes. Oxfordshire: Routledge.
Wu, X.T., 2003. Religious reconstruction after 1949: A case study in Jiangsu. Journal of Southern Yangtze University Humanities & Social Edition, 4(1): 1-10.
Wu, Y.X., 2005. On the propagation of protestantism in Guangzhou. Journal of Hanshan Teachers College, 1(1): 0-5.
Xue, X.M., H. Zhu and X.Q. Tang, 2009. Spatial distribution and evolution of urban religious landscape--a case study of the protestant Churches in Guangzhou after 1842. Human Geography, 1(1): 1-13.View at Google Scholar