VOLUME 15 ISSUE 1 (2017), Page 229 - 234
PUBLIC BUS LEVEL OF SERVICE PERFORMANCE IN PENINSULAR MALAYSIA: CORRELATION ANALYSES ON LEVEL OF SERVICE
(LOS) AND PASSENGERS’ SATISFACTION LEVEL
Zakiah Ponrahono¹, Syahriah Bachok², Mariana Mohamed Osman³, Mansor Ibrahim4, & Muhammad Faris Abdullah5
¹ Faculty of Environmental Studies UNIVERSITI PUTRA MALAYSIA
2,3,4,5Kulliyyah of Architecture and Environmental Design
INTERNATIONAL ISLAMIC UNIVERSITY MALAYSIA
Abstract
This study explore the stage bus performance of 48 routes within selected urban and regional settlements in Peninsula Malaysia, using a quantitative traffic engineering measure known as Level of Service standards or LOS and validated through the evaluation of passengers’ satisfaction level. The findings on the level of service (LOS) highlight the poor performance of the urban and rural bus service with the tolerable threshold below D. There are clear disparities on LOS and passenger satisfaction level between the urban and rural bus operation systems in terms of frequency, operation hour, bus speed, and passengers’ load threshold
Keyword: Level of Service (LOS), stage bus, passengers’ satisfaction
Date Received: 30th April 2016
Public Bus Level of Service Performances in P. Malaysia: Correlation Analyses on LOS and Passengers’ Satisfaction Level INTRODUCTION
Assessing bus service performance is important to improve the quality, reliability, efficiency and effectiveness of the system. Service quality is not only can be measured from the aspect of operation and management but also through the perception and expectation of the passengers. The level of service (LOS) assessment is a tool to measure the quality of service based on specific attributes. The passengers’ satisfaction assessment can help to improve the level of service, the quality and performance (Zakaria et al., 2010).
The objective of this paper is to assess bus performance of 48 routes within selected urban and regional settlements in Peninsula Malaysia, using LOS and validated the findings through the evaluation of passengers’ satisfaction level.
LITERATURE REVIEW
Passengers’ satisfaction survey is a tool to measure the performance and quality of bus service that sequentially useful as a benchmark or indicator to enhance the efficiency and effectiveness of bus service delivery and operations (Dell’Olio, Ibeas & Cecin, 2011; Rojo et al., 2015). It is also defined as a judgment from the passengers that relates to the pleasurable level of consumption (Ismail et al., 2012; Lai & Chen, 2011).
Research on service quality and passengers’ satisfaction identified attributes that usually be measured such as waiting time, reliability, service information, comfort, travel time, convenience, safety, security, affordability and frequency of service (Ismail et al., 2012; Nakanishi, 1997). According to Parasuraman, Zeithaml and Berry (1985), service quality lies around the aspect of intangibility, heterogeneity and inseparability, and can be defined as the degree and direction of discrepancy between consumers’ perceptions and expectations (Parasuraman, Zeithaml & Berry, 1988). It is the key component in measuring the bus services from the view point of passenger (Transportation Research Board, 2013). Even though there exist no specific standard to measure bus service quality, the attributes in LOS and passengers’ satisfaction study are considered as sufficient for service quality assessment (Ismail et al., 2012; Nakanishi, 1997).
METHODOLOGY
Sampling Size
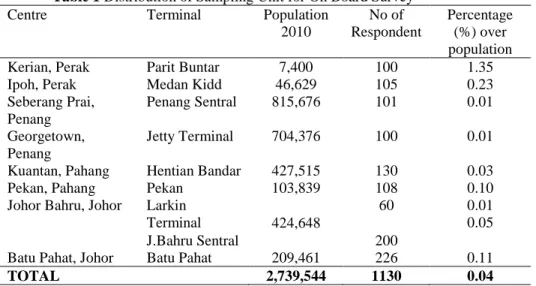
Adopting Yamane (1967) algorithm, given the confidence level = 95%, and P = 0.05, with the total population of selected areas were 2,739,544 (Department of Statistic Malaysia, 2014), thus, the sample size was estimated to be a minimum of 400 bus riders living in the selected urban and rural settlements. However, after considering the probability of non-sampling errors in coverage and non-response as well as bias in data (Phung et al., 2015), 1,200 samples were collected for the overall study. Only 1,130 survey forms were analysed for generalisation purposes based on data cleaning process. Some terminals have more than proportionate samples due to the higher number of riders and greater concentration of route coverage. Target respondents were passengers on-board within the range age of 15 to above 55 years old and have commuted routinely using public bus services (Ismail et al., 2012). The distribution of respondent according to an urban-rural centre is shown in Table 1.
Table 1 Distribution of Sampling Unit for On Board Survey
Centre Terminal Population
2010
No of Respondent
Percentage (%) over population
Kerian, Perak Parit Buntar 7,400 100 1.35
Ipoh, Perak Medan Kidd 46,629 105 0.23
Seberang Prai, Penang
Penang Sentral 815,676 101 0.01
Georgetown, Penang
Jetty Terminal 704,376 100 0.01
Kuantan, Pahang Hentian Bandar 427,515 130 0.03
Pekan, Pahang Pekan 103,839 108 0.10
Johor Bahru, Johor Larkin
Terminal 424,648
60 0.01
0.05
J.Bahru Sentral 200
Batu Pahat, Johor Batu Pahat 209,461 226 0.11
TOTAL 2,739,544 1130 0.04
Source: Department of Statistic Malaysia (2014) and primary data collection.
FINDINGS AND DISCUSSION
Overall LOS of Stage Bus Services
Public Bus Level of Service Performances in P. Malaysia: Correlation Analyses on LOS and Passengers’ Satisfaction Level
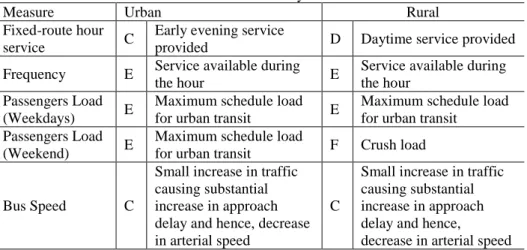
achievements were LOS D, E, E, and F respectively. Passenger loads during the weekend were in the worst condition (LOS F). The crush load situation (Level F, more than 1.5 capacity factors) has created uncomfortable and inconvenient riding experience for the passengers. A very mild gap was also observed in terms of bus service hour, trip frequency, service hours, passengers load and bus speed suggesting that different geographical location does influence the services provided.
Table 2 Summary of Overall Scores for LOS of Selected Urban-Rural Bus Services in Peninsular Malaysia
Measure Urban Rural
Fixed-route hour
service C
Early evening service
provided D Daytime service provided
Frequency E Service available during
the hour E
Service available during the hour
Passengers Load (Weekdays) E
Maximum schedule load for urban transit E
Maximum schedule load for urban transit
Passengers Load (Weekend) E
Maximum schedule load
for urban transit F Crush load
Bus Speed C
Small increase in traffic causing substantial increase in approach delay and hence, decrease in arterial speed
C
Small increase in traffic causing substantial increase in approach delay and hence,
decrease in arterial speed
Correlating the LOS Bus Services and Passengers’ Satisfaction Level
The level of satisfaction survey was carried out to verify the level of service (LOS) identified and to assist in the improvement of the bus services. From the 1,130 respondents surveyed, three in five (60.4%) were dissatisfied with the current public bus service (Table 3). About one in five (18.2%) were satisfied, and the remaining 21.4% were undecided or feel indifferent regarding the performance of the bus service. The mean value for overall passengers’ satisfaction level was 1.58, indicating the greater number of the dissatisfied respondents.
Table 3 Passengers’ Satisfaction Level Distribution
Satisfaction Level Frequency % Mean
Dissatisfied 682 60.4
1.58 Between Satisfied and
Dissatisfied 242 21.4
Satisfied 206 18.2
Based on the findings observed in the Table 3, the LOS variables were then tested using Spearman Rho correlations. A Spearman’s correlation was employed to determine the relationship between passengers’ satisfaction level and the LOS of bus service. The hypotheses developed were:
H0: There is no relationship between passengers’ satisfaction level and the bus
service quality.
H1: There is a significant relationship between passengers’ satisfaction level and
the bus service quality.
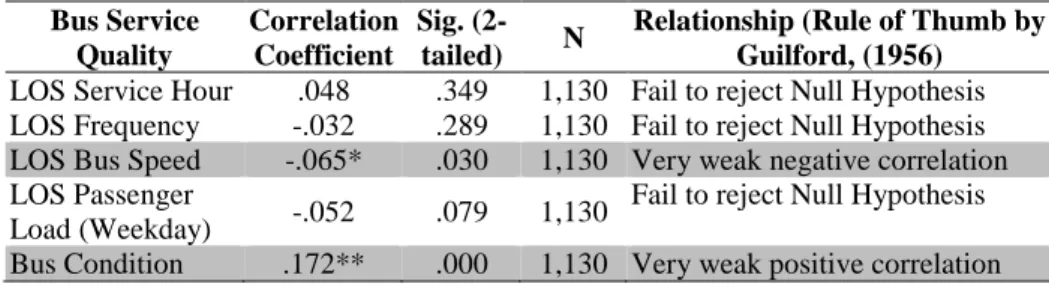
Based on the results in Table 4, since the significant values of LOS measurements such as bus speed and bus condition were lower than the critical value of 0.05 and the r value is less than 0.20, the null hypothesis can therefore be rejected. The results above shows that the significant value of LOS of bus speed was r < 0.20, suggesting a very weak, negative correlation; where satisfaction level was increased even the LOS of bus speed was poor. Meanwhile the significant value of LOS of bus condition was r < 0.20 indicating a very weak, positive correlation. When the bus condition was better, the level of satisfaction increased. Based on the observed significant value, it can be concluded that the variables of LOS confirm the association between the values of LOS with passengers’ satisfaction level. Thus, H1 can be accepted.
Table 4 Spearman Rho Correlations: Passengers’ Satisfaction Level and Bus Service Quality
Bus Service Quality
Correlation Coefficient
Sig. (2-tailed) N
Relationship (Rule of Thumb by Guilford, (1956)
LOS Service Hour .048 .349 1,130 Fail to reject Null Hypothesis LOS Frequency -.032 .289 1,130 Fail to reject Null Hypothesis LOS Bus Speed -.065* .030 1,130 Very weak negative correlation LOS Passenger
Load (Weekday) -.052 .079 1,130
Fail to reject Null Hypothesis
Bus Condition .172** .000 1,130 Very weak positive correlation **. Correlation is significant at the 0.01 level (2-tailed).
*. Correlation is significant at the 0.05 level (2-tailed). CONCLUSION
Public Bus Level of Service Performances in P. Malaysia: Correlation Analyses on LOS and Passengers’ Satisfaction Level
reliability, comfort, cleanliness, and crew behaviour–were indeed affected by the passengers’ satisfactory level. In short, the sustainability of public buses in Malaysia can be achieved first by implementing a comprehensive systems assessment through LOS identification and passengers’ satisfaction survey.
REFERENCES
Dell’Olio, L., Ibeas, A., & Cecin, P. (2011). The quality of service desired by public transport users. Transport Policy, 18(1), 217–227. http://doi.org/10.1016/j.tranpol.2010.08.005 Department of Statistic Malaysia. (2014). Intercensal mid-year population estimates.
Retrieved from http://www.statistics.gov.my/portal/download_Population/files/ Anggaran_Penduduk_Pertengahan_Tahun_Antara_Banci2001_2009.pdf
Ismail, R., Hafezi, M. H., Nor, R. M., & Ambak, K. (2012). Passengers preference and satisfaction of public transport in Malaysia. Australian Journal of Basic and Applied Sciences, 6(8), 410-416.
Lai, W.-T., & Chen, C.-F. (2011). Behavioral intentions of public transit passengers - the roles of service quality, perceived value, satisfaction and involvement. Transport Policy, 18(2), 318-325. http://doi.org/10.1016/ j.tranpol.2010.09.003
Nakanishi, Y. J. (1997). Bus performance indicators on-time performance and service regularity. Transportation Research Record, 1571(August), 3-13.
Parasuraman, A., Zeithaml, V. a, & Berry, L. L. (1985). A conceptual model of service quality and its implications for future research. Journal of Marketing, 49(1979), 41-50. http://doi.org/10.2307/1251430
Parasuraman, A., Zeithaml, V. a, & Berry, L. L. (1988). SERVQUAL: a multiple-item scale for measuring consumer perceptions of service quality. Journal of Retailing, 54(2), 161-166. http://doi.org/10.1016/S0148-2963(99)00084-3
Phung, T. D., Hardeweg, B., Praneetvatakul, S., & Waibel, H. (2015). Non-sampling error and data quality: what can we learn from surveys to collect data for vulnerability
measurements? World Development, 71, 25-35.
http://doi.org/10.1016/j.worlddev.2013.11.008
Rojo, M., dell’Olio, L., Gonzalo-Orden, H., & Ibeas, Á. (2015). Inclusion of quality criteria in public bus service contracts in metropolitan areas. Transport Policy, 42, 52-63. http://doi.org/10.1016/j.tranpol.2015.05.002
Transportation Research Board (2003). Part 3 quality of service contents. In Transit Capacity and Quality of Service Manual 2nd Edition (pp. 3-i to 3-94).
Transportation Research Board (2013). Part 2 bus transit capacity. In Transit Capacity and Quality of Service Manual Third Edition (pp. 2-1 to 2-96). Retrieved from http://www.trb.org/main/blurbs/169437.aspx
Yamane, T. (1967). An Introductory Analysis (Second). New York: Harper and Row. Zakaria, Z., Hussin, Z. H., Batau, M. F. A., & Zakaria, Z. (2010). Service quality of Malaysian