Relationship between stability and variability of
the core in dynamic reaching tasks
Ola Eriksrud
1, *, Jan Cabri
1,2& Peter Federolf
31 Norwegian School of Sport Sciences, P.O. box 4014 Ullevaal Stadion, 0806 Oslo, Norway
2 Department of Gerontology, Faculty of Medicine and Pharmacy, Vrije Universiteit Brussel, Belgium 3 Department of Sport Science, University of Innsbruck, Innsbruck, Austria
* Corresponding author: Ola Eriksrud, Department of Physical Performance, Norwegian School of Sport Sciences, PO Box 4014, 0806 Oslo, Norway
E-Mail: [email protected]
TARGE T AR TICLE
Article History:
Submitted 10th November 2018
Accepted 27th February 2019
Published 7th May 2019
Handling Editor: Markus Tilp,
University of Graz, Austria
Editor-in-Chief: Martin Kopp
University of Innsbruck, Austria
Reviewers:
Reviewer 1: Gaspar Epro, London South Bank University, Great Britain Reviewer 2: Anonymous
ABSTR AC T
Core stability is important to many functional and athletic tasks. Motion variability has been proposed as a measure to characterize core stability. Based on motor learning theories, the current study hypothesized that variability and stability of core movements show a U-shaped relationship and further investigated whether functional range of motion (“mobility”) or speed of motion affect this relationship. Twenty-four healthy subjects performed 20 cycles of two different unilateral hand reaching tasks for both the left and right hand under stable and unstable conditions. Reach targets were positioned to trigger large core movements. Specifically, the anterior target was positioned midsagittal at arm length´s distance and hip height. Two posterior targets (60 degrees posterior to neutral stance frontal plane) on both the left and right side were high (at arm length distance and height with accrued 10 cm) and low (arm length distance at hip height). Kinematic data were recorded and three-dimensional angles between pelvis and thorax (core) were calculated. Pearson correlation coefficients and paired T-tests were calculated to assess variability, mobility and speed of the core movements. A parabolic function was fitted to the variability data and the quality of the fit was assessed by calculating adjusted R-squared values. In the sagittal plane, variability could be modeled with a U-shaped distribution; in the other planes of motion this was the case in 2 of 4 reaching tests. In two tests, movement speed changed between the stable and unstable conditions. Mobility did not appear to affect variability in the stable condition, but some correlations were observed in the unstable condition. The relationship between mobility and variability, and the change in variability were task-specific.
Keywords:
Sensory and motor testing – Mobility – Kinematic analysis – Core stability – Movement variability
Citation:
Introduction
Many medical practitioners, scientists, physiotherapists and sports coaches would agree that core stability is essential for any type of whole-body movement (Kibler, Press, & Sciascia, 2006) and that impaired core stability may play a role in the development of injuries (De Blaiser et al., 2018). Nonetheless, core stability is not a well-defined variable, and the assessment of core stability remains somewhat elusive. Core stability can be defined as “the ability to control the position and motion of the trunk over the pelvis” (Kibler et al., 2006). The musculo-skeletal structures between pelvis and thorax function as “core” and thus “core motions” represent movements in sagittal, fron-tal and transverse planes between pelvis and thorax. Current measures of core stability are mostly static muscular endurance measures (McGill, 2001), with some exceptions that measure strength and power in dynamic situations (Cowley & Swens-en, 2008), or in planked (McGill, 2001), quadruped (Liemohn, Baumgartner, Fordham, & Srivatsan, 2010) or seated positions (Cowley & Swensen, 2008). Other studies quantified core stabil-ity during dynamic movements such as repeated flexion and extension, (Granata & England, 2006) lateral flexion and rota-tion (Cholewicki & VanVliet, 2002) or lifting (Graham, Sadler, & Stevenson, 2011; Laudner et al., 2013).
In dynamic movements variability has been used to quantify stability in joint or regional movements (Granata & England, 2006) to locomotion (Hausdorff, Rios, & Edelberg, 2001). The re-lationship between these variables can take different forms and consequently is a subject of debate. Increased variability (stride time) has been found to be correlated with decreased balance and predict future falls (Hausdorff et al., 2001), while more ro-bust systems exhibited reduced system variability (Granata & England, 2006). However, increased movement variability has been interpreted as a resource of the biological system to pro-duce a variety of solutions (Newell, 1985). Increasing variability then indicates adaptability to changing boundary conditions (Hamill, van Emmerik, Heiderscheit, & Li, 1999; van Emmerik & van Wegen, 2000; van Emmerik & van Wegen, 2002) and there-fore improved stability (Dingwell & Marin, 2006). Thus, vari-ability could be viewed as a resource in counteracting external perturbations (Stergiou, Harbourne, & Cavanaugh, 2006). These studies hypothesize a linear or at least monotonous relation-ship between stability and variability, which would predict ei-ther an increase or a decrease in variability in all subjects when standing on unstable surfaces (e.g. on a foam mat) (Hamill et al., 1999; van Emmerik & van Wegen, 2000; van Emmerik & van Wegen, 2002).
Motor learning theories suggest another relationship between movement variability and skill in controlling a movement: a U-shaped function (Figure 1). Movement variability decreases as skill improves from beginner to advanced level and then increases from advanced to expert level as more options (i.e. more strategies) for executing the same movement become available (Huys, Daffertshofer, & Beek, 2003; Krampe, Kliegl, Mayr, Engbert, & Vorberg, 2000; Seifert, Leblanc, Chollet, &
Del-ignieres, 2010; Sternad, 1999; Wilson, Simpson, van Emmerik, & Hamill, 2008; Yang & Scholz, 2005). In the current study, we considered the hypothesis that core movement variability and the “ability to control core motion” might exhibit a similar U-shaped relationship (Figure 1). Standing on foam increases the difficulty of controlling the motion in a standardized way. If a U-shaped relationship exists, then individual responses of either an increase or decrease in variability in response to an unsta-ble surface should be observed. Based on a U-shaped model an individual with good core stability (Figure 1, Person B) is expected to show a decrease in variability from the stable to unstable condition, whereas an individual with poor core sta-bility (Figure 1, Person A) would have an increase in variasta-bility from the stable to unstable condition. Thus, the change in vari-ability (slope) between the stable and the unstable standing conditions might serve as a measure to compare core stability (defined as the “ability to control core motion”) between sub-jects (Figure 1).
How much variability an individual shows in a specific move-ment task is likely to be dependent on the range of motion (ROM) used as well as the velocity of motion. The variable core mobility will be used in the remainder of this article to describe functional ROM (McGinnis, 2005), i.e. the core ROM utilized for given hand reaches. A second research question was therefore to determine movement frequency and core mobility and to investigate whether and how these variables affected the vari-ability of the core movements.
was expected that individuals exhibiting large (or small) vari-ability or mobility compared to their peers in one test would show similar characteristics in the corresponding tests using other targets.
In summary, the current study explores core movement vari-ability changes in response to changes of surface (stable and unstable) while performing hand reaches. In addition, the con-sistency of change in core movement variability between the hand reaches, as well as the influence core mobility and move-ment frequency on core movemove-ment variability were observed.
Methods
Participants
Twenty-four healthy male subjects (age 22.5 ± 0.5 years, height 1.81 ± 0.06 m, weight = 76.8 ± 8.3 kg) volunteered for this study. All subjects gave informed written consent and the study was approved by the Regional Ethics Committee (2012/1736) and Norwegian Data Protection Agency (34752) approved the study, and it was carried out according to the rules of the Dec-laration of Helsinki.
Experimental setup and procedures
Anthropometric measures of height, leg length (greater tro-chanter to floor in standing with knees extended) and arm length (acromion to middle finger with shoulder abducted to 90 degrees) were obtained. Following marker placement, each subject performed 8 hand-reaching tasks consisting of 20 cy-cles of alternately touching the common anterior and a pos-terior target (Figure 2). All reach targets were defined through reflective markers placed on vertical poles. The anterior reach target, common to all reaches, was positioned in the midsagit-tal plane, at one arm length in front of the participant at the height of one leg length. Four different posterior reach targets were used: one high and one low on both the left (L) and the right side (R). They were positioned in a plane angled 60 deg posterior to the neutral-stance frontal plane. The low posterior target was placed one arm length away from the participant’s heel at the height of one leg length. The high posterior reach target was at the same distance to the heel at one body height accrued with 10 cm. Unstable condition was offered standing on an Airex Balance Pad (50x41x6 cm; Alcan Airex AG, CH-5643 Sin, Switzerland) (“foam”). When standing on foam, five cm were added to the vertical position of all reach targets to com-pensate for the change in stance height.
All reaches were performed in bilateral stance with the feet hip wide apart. The hand not performing the reach was kept on the ipsilateral iliac crest. The subjects were instructed to: 1) reach and tap the anterior target, 2) reach and tap one of the posterior targets (high or low, left or right) and 3) reach to the anterior target again and repeat for a total of 20 consecutive cycles at a self-determined speed. Reaches were performed in
the following order for all subjects; (1) R hand, R posterior tar-get high, no-foam; (2) R hand, R posterior tartar-get high, foam; (3) R hand, R posterior target low, no-foam; (4) R hand, R posterior target low, foam; (5) L hand, L posterior target high, no-foam; (6) L hand, L posterior target high, foam; (7) L hand, L poste-rior target low, no-foam; and (8) L hand, L posteposte-rior target low, foam. No specific instructions concerning the execution of the hand reaches were given, except for targets to reach and that both feet should remain in contact with the ground and ori-ented in the anterior direction.
Kinematic data for all reaches were obtained using fifteen in-frared cameras (ProReflex®, Qualisys Inc., Gothenburg, Sweden) recording at 400 Hz. The movements of the participants were captured using a total of 75 markers attached over anatomical landmarks and segments (Figure 2), however, for the current study only a two-segment trunk model and the metacarpal markers on the reaching hand were further analysed.
Dependent variables
Core motion and position were quantified using a two-seg-ment model. The thorax segtwo-seg-ment was defined by four reflec-tive markers attached on the jugular notch, seventh cervical spinous process, xiphosternal joint and tenth thoracic spinous process. Four markers attached to the right and left anterior and posterior superior iliac spines defined the pelvic segment. Marker data were not filtered. Data analysis was performed us-ing Visual 3D® (C-Motion Inc., Rockville, MD, USA). Local coordi-nate systems of both the thorax and pelvis were created based on the static calibration trial.
All dependent variables were determined over 15 of the 20 reach cycles, from cycles 5 to 20. The movement frequency, f, at which the subjects executed the reaches, was calculated by dividing 15 by the time difference between the start of cycle 5 and the end of cycle 20: ƒ=15/(t20-t5). Core mobility and dynamic core variability for all hand reaches were calculated in the sag-ittal (flexion and extension), frontal (lateral flexion) and trans-verse (rotation) planes using the Cardan sequence (x,y,z) with the pelvis as the reference segment.
Data analysis and statistics
For each participant, 24 variables (8 reach tasks x 3 planes of motion) characterized each of mobility and variability, 8 variab-les quantified the movement frequency, and 12 variables quan-tified the change in mobility and change in variability. Standard descriptive statistics (mean values and standard deviations) were calculated to present the results. Pearson correlation co-efficients were calculated to evaluate whether the participants’ results were consistent between different planes of motion. To compare mobility between different planes of motion, ratios were calculated for the individual subjects and then averaged over all subjects. Paired t-tests were used to test whether move-ment frequency changed between stable and unstable condi-tions. P-values smaller than 0.05 were considered significant. To determine whether the variability data suggested a U-shaped relationship, the variability results on stable ground (σno-foam)and on foam (σfoam) were plotted against the change in variability, Δσ. If the underlying relationship can be described by a U-shaped model, then one would expect that the data should fit reasonably well to a parabolic function. A quadratic polynomial was therefore fitted to the mean variability (Equa-tion 5) and adjusted R2 values were calculated to assess how well the data could be modeled with this function.
σmean = 1/2*[σno-foam + σfoam] (5)
One concern regarding this approach to test for a U-shaped re-lationship, could be that plotting the mean variability as a func-tion of the difference in variability may automatically produce a U-shaped relationship. Therefore, we tested the hypothesis that U-shaped relationships occur as an artefact of the data analysis procedure by performing a surrogate analysis: adjusted R2 were calculated for 10,000 pairs of random numbers generated from the same interval as the variability, σ, observed in the 24 sub-jects. This calculation was conducted using Matlab® (Version 8.3, R2014a, MathWorks Inc., Natick, MA, USA). The likelihood for adjusted R2 > 0.1 was smaller than 0.03 in all intervals. In the 12 datasets we would therefore expect a maximum of one coincidental adjusted R2 bigger than 0.1. Using a Chi-squared – test we could thus calculate the probability for observed U-shaped distributions being coincidental observations. Core mobility, θ, was calculated as the difference between the
core angles in posterior (φmax) and anterior (φmin) reach end positions (Equation 1). For each of the 8 reach tasks, core mo-bility was quantified by 3 variables: θsag, θfront, and θtrans. Ratios of core mobility were then calculated as θsag/θfront, θsag/θtransand θsag/ θtrans. Change in mobility, Δθ, from the no-foam to foam condition, was calculated (Equation 2) for the three mobility measures (Δθsag, Δθfront, and Δθtrans).
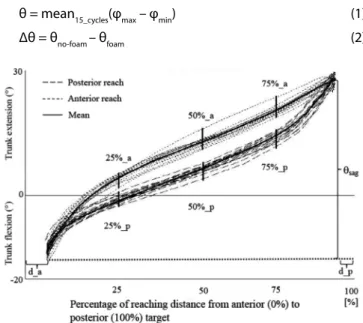
θ = mean15_cycles(φmax – φmin) (1)
Δθ = θno-foam – θfoam (2)
Dynamic core variability was characterized by assessing the var-iability of the core movement trajectory at six points within the reach cycles (Figure 3). The metacarpal marker on the reaching hand was taken as the reference (abscissa) for the movement. The anterior and posterior targets defined 0% and 100% of the reach distance, respectively. In each cycle, core angles were de-termined at 25%, 50% and 75% of the posterior (“p”) and of the anterior (“a”) reaching distance. Then, the standard deviations sij (i = sag, front, trans; j = 25%_p, 50%_p, 75%_p, 75%_a, 50%_a, 25%_a) over the 15 reach cycles were calculated for each plane of motion. These six standard deviations were summed to ob-tain a variable characterizing the dynamic variability of the core movements, as exemplified by the calculation of variability of core sagittal plane motion (Equation 3).
Then, Changes in variability, Δσ, from no-foam to foam were calculated (Equation 4) for all core variability measures (Δσsag, Δσfront, Δσtrans).
Δσsag= ∑jσsag (Figure 3) (3)
Δσi = σ i,no-foam – σ i,foam (4)
Figure 3: Determination of variability and mobility in the current study: the standard deviation over 15 cycles was determined for 6 positions of the sagittal plane trajectory (25%, 50% and 75%). Their sum was denoted as σsag. The mobility θsag quantified the average range of motion of the 15 cycles.
jects with large mobility were likely to increase their mobility when standing on unstable ground. Subjects who exhibited a low mobility were less likely to increase their ROM when cop-ing with the unstable condition (Table 2, lower rows). Such a subject-specific difference was not observed in the reaches to the high targets.
Results
Variability
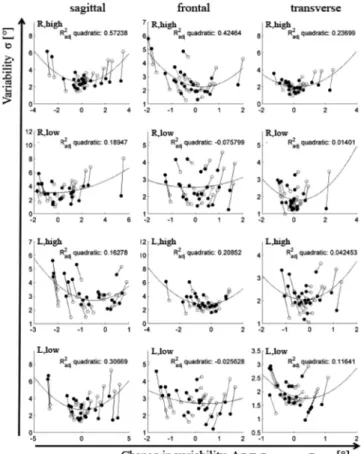
The participants in this study exhibited substantial differences in variability. Variability results were consistent between planes of motion in the sense that subjects exhibiting a relatively large (small) variability in one plane of motion were likely to also exhibit large (small) variability in the other planes (Table 1, top rows). Three exceptions were observed in the sagittal and the transverse planes when standing on foam (Table 1, top rows). In none of the reaching tasks the results fit a hypothesized line-ar or continuous relationships between vline-ariability and stability: in all tests approximately half of the subjects showed increased whereas the other half decreased core variability when chang-ing from the stable to the unstable support surface. However, in all sagittal plane movements we observed that variability could be reasonably well fitted to a U-shaped relationship (Figure 4). In the other planes of motion, the results were ambiguous: in the first test completed (reaching to the right high target) a parabolic function fitted all three planes of motion (adjusted R2 values between 0.57 and 0.24). However, in the three following reaching tasks there was at least one plane of motion where the observed variability distribution did not match a parabolic function (adjusted R2 < 0.1). In total, for 8 of the 12 datasets adjusted R2 bigger than 0.1 were found. The likelihood for this being a coincidental observation is p = 0.0094.
Mobility
Averaged over all high reaches, functional mobility ranged from 15.2° to 44.4° in the sagittal plane, from 7.6° to 26.3° in the frontal plane, and from 26.5° to 42.5° in the transverse plane. The reaches to the high target triggered sagittal and transverse plane motions equally. The average ratio of mobility between sagittal and frontal plane was 2.5 ± 1.0 and between trans-verse and frontal plane 2.5 ± 0.9. When reaching to the lower target, individual ROMs were found to vary from 2.9° to 28.1°, from 8.4° to 31.6°, and from 11.4° to 40.7° in the sagittal, frontal, and transverse planes, respectively. On average, reaches to the lower target triggered predominantly transverse plane motion, while the sagittal plane motion showed on average the lowest mobility (ratios sagittal/frontal: 0.6 ± 0.2, sagittal/transverse: 0.4 ± 0.2).
No significant between-plane correlations were found for the subjects’ core mobility results in the reaches to the high target; however, in the reaches to the lower targets, significant cor-relations between different planes were observed in 10 of 12 comparisons (Table 1, lower rows). When comparing the mo-bility results between stable and unstable conditions, (Table 2, top rows) subjects exhibiting large (small) mobility in the sta-ble condition were likely to also show large (small) mobility in the unstable condition. Another difference between reaches to high and low targets was observed when correlating mobility θ with change in mobility Δθ: In the low reach condition,
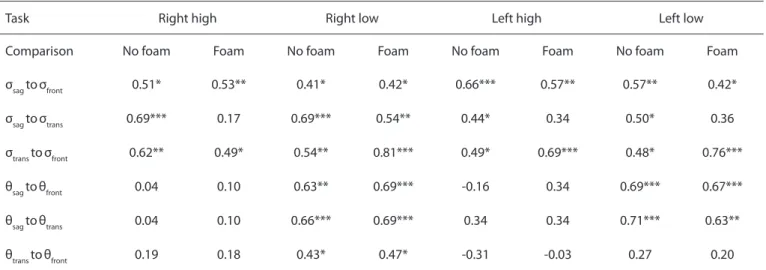
ability observed in the same plane of motion: only 1 significant correlation was found in the 12 comparisons between mobility and variability (Table 3, top left). The variability in one plane of motion also seemed to be independent of the mobility in other planes of motion: considering that 24 correlations were calculated, 2 significant correlations might be a coincidental re-sult (Table 3, top right). When standing on the unstable surface, more correlations between mobility and variability variables were observed. Particularly when reaching to the lower targets, 4 of the 6 within-plane comparisons and 7 of the 12 between-plane comparisons yielded a significant correlation (Table 3, lower rows).
Movement frequency
Movement frequency did not change between stable and unstable conditions for the right high (p=0.55) and left low (p=0.91) reach conditions. However, a significant difference in movement frequency between stable and unstable support was found in the left high (p<0.05) and a statistical trend was found in the reach to the right low target (p=0.07).
Effects of mobility or movement frequency on variability
When standing on the stable surface, there appeared to be lit-tle or no influence of mobility in one plane of motion on
vari-Task Right high Right low Left high Left low
Comparison No foam Foam No foam Foam No foam Foam No foam Foam
σsag toσfront 0.51* 0.53** 0.41* 0.42* 0.66*** 0.57** 0.57** 0.42*
σsag toσtrans 0.69*** 0.17 0.69*** 0.54** 0.44* 0.34 0.50* 0.36
σtrans toσfront 0.62** 0.49* 0.54** 0.81*** 0.49* 0.69*** 0.48* 0.76***
θsag toθfront 0.04 0.10 0.63** 0.69*** -0.16 0.34 0.69*** 0.67***
θsag toθtrans 0.04 0.10 0.66*** 0.69*** 0.34 0.34 0.71*** 0.63**
θtrans toθfront 0.19 0.18 0.43* 0.47* -0.31 -0.03 0.27 0.20
Table 1: Correlation coefficients for between-plane correlations of core variability (rows 1-3) and core mobility (rows 4-6).
Note. σsag=variability sagittal plane; σfront=variability frontal plane; σtrans=variability transverse plane; θsag=mobility sagittal plane; θfront=mobility frontal plane; θtrans=mobility transverse plane.
*p<.05. **p<.01. ***p<.001
Table 2: Correlation coefficients calculated for within-plane comparisons of core mobility observed when standing on a stable surface compared to an unstable surface (foam).
Comparisons Right high Right low Left high Left low
θsag no foam toθsag foam 0.86*** 0.82*** 0.86*** 0.92***
θfront no foam toθfront foam 0.90*** 0.91*** 0.68*** 0.85***
θtrans no foam toθtrans foam 0,87*** 0,91*** 0,81*** 0,95***
θsag no foam toΔθsag 0.45* 0.71*** 0.36 0.85***
θfront no foam toΔθfront 0.19 0.42* 0.05 0.42*
θtrans no foam toΔθtrans -0.17 0.57** 0.40 0.64***
Note. θsag no foam=mobility sagittal plane no foam; θsag foam=mobility sagittal plane foam; θfront no foam=mobility frontal plane no foam; θfront foam=mobility frontal plane foam; θtrans no foam=mobility transverse plane no foam; θtrans foam=mobility transverse plane foam; Δθsag=change in mobility sagittal plane; Δθfront=change in mobility frontal plane; Δθtrans=change in mobility transverse plane.
right hand high reach unstable condition (r=0.41; p<0.05). Fur-thermore, change in variability and change in movement fre-quency were not found to be significantly correlated, except in the sagittal plane for the right hand high reach condition (r= -0.44; p<0.05).
Variability of mobility was affected only in a small way when changing from stable to unstable condition. Significant corre-lations between change in mobility and change in variability were found in 5 of 36 comparisons.
Movement frequency was not found to be correlated with vari-ability, with one exception: transverse plane variability in the
Table 3: Correlation coefficients for the comparison of core variability and core mobility.
Reach Condition Same plane comparisons Between plane comparisons
Reach Condition θsag to
σsag
θfront to σfront
θtrans to σtrans
θsag to σfront
θsag to σtrans
θfront to σsag
θfront to σstrans
θtrans to σsag
θtrans to σfront
Right high No foam 0.20 0.16 -0.13 0.29 0.00 -0.15 -0.25 -0.10 -0.02
Right low No foam 0.05 0.52** 0.25 0.35 0.17 0.02 0.20 -0.21 0.15
Left high No foam 0.30 0.36 0.19 0.42* 0.09 0.27 0.04 0.16 -0.04
Left low No foam -0.02 -0.01 0.21 -0.05 0.49* -0.01 0.20 -0.39 0.21
Right high Foam 0.21 0.22 0.19 0.33 0.11 0.61** 0.62*** 0.11 0.45*
Right low Foam 0.25 0.48* 0.61** 0.46* 0.55** 0.41* 0.58** 0.29 0.58**
Left high Foam 0.18 0.56** 0.32 0.44** 0.26 0.45** 0.35 -0.22 0.02
Left low Foam -0.02 0.55** 0.51* 0.36 0.57** 0.10 0.45* -0.15 0.15
Note. θsag=mobility sagittal plane; θfront=mobility frontal plane; θtrans=mobility transverse plane; σsag=variability sagittal plane; σfront=variability frontal plane; σtrans=variability transverse plane.
*p<.05. **p<.01. ***p<.001
Mobility (θ) and Variability (σ)
R high to R low
R high to L high
R high to L low
R low to L high
R low to L low
L high to L low
σsag 0,16 0,45* 0,06 0,19 0,23 0,38
σfront 0,23 0,70*** 0,04 0,50* 0,37 0,00
σtrans -0,04 0,23 -0,06 0,39 0,46* 0,34
f 0.84*** 0.83*** 0.73*** 0.89*** 0.92*** 0.87***
θsag 0,02 0,78*** -0,09 -0,04 0,67*** -0,19
θfront -0,32 0,37 -0,25 0,29 0,63*** 0,15
θtrans 0,25 0,58** 0,23 0,29 0,71*** 0,33
Table 4: Correlation coefficients obtained for the comparison between different reach conditions on a stable surface for variability (σ), frequency (f), and mobility (θ).
Note. θsag=mobility sagittal plane; θfront=mobility frontal plane; θtrans=mobility transverse plane; f=frequency; σsag=variability sagittal plane; σfront=variability frontal plane; σtrans=variability transverse plane.
Consistency of results between tasks
Comparisons of the individual variability results for the reaches to the right and left high targets indicated low to moderate cor-relations in the sagittal and frontal planes, but no significant correlation in the transverse plane (Table 4). Conversely, in the comparison of the variability observed in the two reaches to the lower targets, only the results in the frontal plane were significant. The comparisons between reaches to high and low targets yielded only one significant correlation coefficient in the 12 comparisons explored.
The movement frequency results were consistent between tests: subjects showing high movement frequency in one test were also likely to show high frequencies in the other tests. The correlation coefficients ranged between r=0.73 and r=0.98. When comparing the mobility results between different tests, significant correlations were observed between reaches to the left and right high targets in the sagittal and transversal planes (Table 4). In the frontal plane the correlation did not reach the level of statistical significance (r= 0.37; p=0.075). Comparison of the results between the reaches to the lower targets resulted in significant correlations in all three planes. None of the compari-sons between reaches to a high and to a low target resulted in a significant correlation.
Discussion
The results of the current study demonstrated that challenging stability by means of an unstable ground surface did not lead to a consistent increase or decrease of core motion variability in this group of subjects. The hypothesis of a monotonous re-lationship between stability and motion variability therefore has to be rejected. In all tests, both increases and decreases in movement variability were observed. This is consistent with the proposed U-shaped relationship between stability and variabil-ity. Furthermore, specifically in the first test (right high target) and in all other tests of the sagittal plane, the distribution of the core movement variability could be modeled by a parabol-ic function, where higher adjusted R2 values were found than would be expected by coincidence. However, with the excep-tion of the first test, all other tests also showed distribuexcep-tions of variability in the frontal and transverse planes of motion that were not consistent with a parabolic distribution. Thus, the cur-rent study provides some support for the proposed U-shaped relationship, but not all results agreed with this hypothesis. Change in variability from the no-foam to foam condition could be used to determine where on the U-shaped model the sub-ject is located. A decrease or increase in variability could iden-tify the individual on either the descending or ascending limb of the U-shaped model, respectively (Figure 1). Similar to how the U-shaped model is described in motor learning (Wilson et al., 2008), being placed on the ascending limb is indicative of being more skilled. Consequently, a more skilled response to a perturbation (foam) could therefore be interpreted as being
more stable. Being placed on the ascending limb would sug-gest that the subject had difficulties with adapting to the per-turbation and would thus be considered less stable.
Alternatively, our results could be interpreted according to the inverted U-shaped model described by Stergiou and co-work-ers (Stergiou & Decker, 2011; Stergiou et al., 2006). Their model does not describe stability, but rather an optimal range of vari-ability that has a highly complex and chaotic structure based upon complexity (y-axis) and predictability (x-axis). They argue that both decreased variability, indicative of a more predictable and rigid biological system of lower complexity, and increased variability, indicative of a noisier or less complex biological system, imply reduced capability to adapt to external pertur-bations. According to this model, subjects showing minimal changes have an optimal range of variability, whereas subjects showing marked decreases or increases are considered more rigid or noisier in their behavior, respectively.
This study also examined the relationship between variability and mobility in core movements. In the stable standing condi-tion these two variables appeared to be largely independent. However, when stability was challenged, some correlations be-tween these variables were observed, particularly in the frontal and transverse planes. This suggests that mobility is one factor that has to be considered when deriving a model for core sta-bility based on variasta-bility measures. Movement frequency also appeared to have an effect on the variability: in two reaching tasks in the current study, R high and L low, the movement fre-quency did not change between stable and foam conditions. In these reaches the highest adjusted R2 values were observed, particularly in the sagittal plane (Figure 4). In the reach tests, where movement frequency changed, a U-shaped relationship was more difficult to detect.
Another observation in the assessment of core mobility was the wide spread of results between subjects. Placing the reach targets beyond arm´s length ensured that the volunteers had to engage core movements (Kaminski, Bock, & Gentile, 1995). However, in aiming for high external validity, no specific guide-lines were given how the reaches had to be executed. As a result, some participants remained relatively stiff in the core and accomplished the task by using rotations and translations of the pelvis. Other participants showed large rotations in the core and less of the pelvis. It may be speculated that these dif-ferences in chosen movement strategy not only have affected mobility, but also core movement variability and its response to the change of provided ground (in)stability (foam inter-vention).
References
Cholewicki, J., & VanVliet, J. J. t. (2002). Relative contribution of trunk muscles to the stability of the lumbar spine during isometric exertions. Clinical biomechanics, 17(2), 99-105. Cowley, P. M., & Swensen, T. C. (2008). Development and
reliabil-ity of two core stabilreliabil-ity field tests. Journal of strength and con-ditioning research / National Strength & Concon-ditioning Asso-ciation, 22(2), 619-624. doi:10.1519/JSC.0b013e3181634cb4 De Blaiser, C., Roosen, P., Willems, T., Danneels, L., Bossche, L. V.,
& De Ridder, R. (2018). Is core stability a risk factor for lower extremity injuries in an athletic population? A systematic review. Physical Therapy in Sport, 30, 48-56.
Dingwell, J. B., & Marin, L. C. (2006). Kinematic variability and lo-cal dynamic stability of upper body motions when walking at different speeds. J.Biomech., 39(3), 444-452.
Graham, R. B., Sadler, E. M., & Stevenson, J. M. (2011). Local dy-namic stability of trunk movements during the repetitive lifting of loads. Human movement science. doi:10.1016/j.hu-mov.2011.06.009
Granata, K. P., & England, S. A. (2006). Stability of dynamic trunk movement. Spine, 31(10), E271-276. doi:10.1097/01. brs.0000216445.28943.d1
Hamill, J., van Emmerik, R. E., Heiderscheit, B. C., & Li, L. (1999). A dynamical systems approach to lower extremity running injuries. Clinical biomechanics, 14(5), 297-308.
Hausdorff, J. M., Rios, D. A., & Edelberg, H. K. (2001). Gait variabil-ity and fall risk in communvariabil-ity-living older adults: a 1-year prospective study. Archives of physical medicine and rehabili-tation, 82(8), 1050-1056. doi:10.1053/apmr.2001.24893 Huys, R., Daffertshofer, A., & Beek, P. J. (2003). Learning to
jug-gle: on the assembly of functional subsystems into a task-specific dynamical organization. Biological cybernetics, 88(4), 302-318. doi:10.1007/s00422-002-0379-1
Kaminski, T. R., Bock, C., & Gentile, A. M. (1995). The coordina-tion between trunk and arm mocoordina-tion during pointing move-ments. Experimental brain research. Experimentelle Hirn-forschung. Experimentation cerebrale, 106(3), 457-466. Kibler, W. B., Press, J., & Sciascia, A. (2006). The role of core
stabil-ity in athletic function. Sports medicine, 36(3), 189-198. Krampe, R. T., Kliegl, R., Mayr, U., Engbert, R., & Vorberg, D.
(2000). The fast and the slow of skilled bimanual rhythm production: parallel versus integrated timing. Journal of ex-perimental psychology. Human perception and performance, 26(1), 206-233.
Laudner, K., Lynall, R., Williams, J. G., Wong, R., Onuki, T., & Meister, K. (2013). Thoracolumbar range of motion in base-ball pitchers and position players. International journal of sports physical therapy, 8(6), 777-783.
Liemohn, W. P., Baumgartner, T. A., Fordham, S. R., & Srivatsan, A. (2010). Quantifying core stability: a technical report. Jour-nal of strength and conditioning research / NatioJour-nal Strength & Conditioning Association, 24(2), 575-579. doi:10.1519/ JSC.0b013e3181cbab14
One important limitation of the current study was that the way a change in the support surface’s stability affects subjects might be subject-specific. Further research is therefore neces-sary to determine whether a scaling of the “change in variabil-ity” to an appropriate reference value that, for instance, scales the change in core variability to a subject’s overall response, is necessary and possible. Furthermore, the current study did not address the possibility that other variables or phenomena may influence the hypothesized relationship. Such variables in-clude learning effects, fatigue, and changes in movement strat-egy, which are described by an increase in variability prior to a transition into a new movement strategy (van Emmerik & van Wegen, 2000).
Conclusions
In the current study we challenged the sensorimotor control system using a standardized intervention (standing on foam) and investigated whether changes in core motion variability might serve as a measure for an individual’s ability to control core motion. Our results rule out a linear or monotonous re-lationship but provide some support for a hypothesized U-shaped relationship. However, we also observed that execution movement frequency and mobility in the core influence mo-tion variability in some but not all situamo-tions. We believe that the results obtained are a promising start for further investiga-tions into the complex relainvestiga-tionship between core stability and movement variability.
Acknowledgements
We gratefully acknowledge the help of Vidar Jakobsen, Adrien Cerito, Even Granerud, Frederik Sæland, Stavros Litsos, Eirik An-dreassen, Patrick Anderson in collecting the data, Jens Bojsen-Møller and Olivier Seynnes for input in preparing the manu-script and Judy McDonald for language editing.
Funding
No external funding was received for this study.
Competing Interests
The authors have declared that no competing interests exist.
Data Availability Statement
McGill, S. M. (2001). Low back stability: from formal description to issues for performance and rehabilitation. Exerc.Sport Sci. Rev., 29(1), 26-31.
McGinnis, P. M. (2005). Biomechanics of sport and exercise. Second edition. Champaign, IL: Human Kinetics.
Newell, K. M. (1985). Coordination, control and skill. In D. W. Goodman, R.B.; Franks, I.M. (Ed.), Differing perspectives in motor learning, memory and control. Amsterdam: North Holland.
Seifert, L., Leblanc, H., Chollet, D., & Delignieres, D. (2010). Inter-limb coordination in swimming: effect of speed and skill level. Human movement science, 29(1), 103-113. doi:10.1016/ j.humov.2009.05.003
Stergiou, N., & Decker, L. M. (2011). Human movement vari-ability, nonlinear dynamics, and pathology: is there a connection? Human movement science, 30(5), 869-888. doi:10.1016/j.humov.2011.06.002
Stergiou, N., Harbourne, R., & Cavanaugh, J. (2006). Opti-mal movement variability: a new theoretical perspective for neurologic physical therapy. J Neurol Phys Ther, 30(3), 120-129.
Sternad, D. (1999). Juggeling and bouncing balls: parallels and differences in dynamic concepts and tools. Int J Sports Psychol, 30, 462-489.
van Emmerik, R. E., & van Wegen, E. E. (2000). On variability and stability in human movement. J Appl Biomech, 16(4), 394-406.
van Emmerik, R. E., & van Wegen, E. E. (2002). On the functional aspects of variability in postural control. Exercise and sport sciences reviews, 30(4), 177-183.
Wilson, C., Simpson, S. E., van Emmerik, R. E., & Hamill, J. (2008). Coordination variability and skill development in expert triple jumpers. Sports biomechanics / Inter-national Society of Biomechanics in Sports, 7(1), 2-9. doi:10.1080/14763140701682983