A peer-reviewed version of this preprint was published in PeerJ on 4 March 2019.
View the peer-reviewed version (peerj.com/articles/cs-182), which is the
preferred citable publication unless you specifically need to cite this preprint.
Kong X, Liu L, Yu S, Yang A, Bai X, Xu B. 2019. Skill ranking of researchers via hypergraph. PeerJ Computer Science 5:e182
Skill ranking of researchers via hypergraph
Xiangjie Kong 1 , Lei Liu 1 , Shuo Yu 1 , Andong Yang 1 , Xiaomei BaiCorresp., 2 , Bo Xu 1
1
School of Software, Dalian University of Technology, Key Laboratory for Ubiquitous Network and Service Software of Liaoning Province, Dalian, China
2Anshan Normal University, Computing Center, Anshan, China
Corresponding Author: Xiaomei BaiEmail address: [email protected]
Researchers use various skills in their work, such as writing, data analyzing and
experiments design. These research skills have greatly influenced quality of their research
outputs, as well as their scientific impact. Although there are many indicators having been
proposed to quantify the impact of researchers, studies of evaluating their scientific
research skills are very rare. In this paper, we analyze the factors affecting researchers'
skill ranking and propose a new model based on hypergraph theory to evaluate the
scientific research skills. To validate our skill ranking model, we perform experiments on
PLoS One dataset and compare the rank of researchers' skills with their papers citation
counts and h-index. Finally, we analyze the patterns about how researchers' skill ranking
increased over time. Our studies also show the change patterns of researchers between
different skills.
Skill Ranking of Researchers via
1Hypergraph
2Xiangjie Kong
1, Lei Liu
1, Shuo Yu
1, Andong Yang
1, Xiaomei Bai
2, and Bo
3Xu
1 41Key Laboratory for Ubiquitous Network and Service Software of Liaoning Province, 5
School of Software, Dalian University of Technology, Dalian, 116620 China
6
2Computing Center, Anshan Normal University, Anshan 114007, China 7
Corresponding author:
8
Xiaomei Bai2
9
Email address: [email protected]
10
ABSTRACT
11Researchers use various skills in their work, such as writing, data analyzing and experiments design. These research skills have greatly influenced quality of their research outputs, as well as their scientific impact. Although there are many indicators having been proposed to quantify the impact of researchers, studies of evaluating their scientific research skills are very rare. In this paper, we analyze the factors affecting researchers’ skill ranking and propose a new model based on hypergraph theory to evaluate the scientific research skills. To validate our skill ranking model, we perform experiments on PLoS One dataset and compare the rank of researchers’ skills with their papers citation counts and h-index. Finally, we analyze the patterns about how researchers’ skill ranking increased over time. Our studies also show the change patterns of researchers between different skills.
12 13 14 15 16 17 18 19 20
INTRODUCTION
21The burst of development in science contributes to an expansion of knowledge and technology. It also leads
22
to many new disciplines and interdisciplines emerging in universities (Lee et al., 2017). Scientific
cross-23
disciplinary collaboration brings positive effects to improve the productivity and quality of researchers’
24
outputs. Collaboration has become a common phenomenon in people’s daily life for a long time. More
25
and more works are finished with the form of collaboration, such as project and assignment, patent,
26
software development and scientific paper. The patterns of collaboration and teamwork have attracted
27
interests of researchers in many disciplines (Kong et al., 2017). Organizations like funding agency,
28
university, enterprise, etc. are also concerned about team-based issues to improve the productivity and
29
boost the profits. Many state-of-art works have been proposed to analyze the pattern of collaboration
30
and optimize the team structure. Many efforts have been made to analyze and optimize team in terms of
31
its topology structure (Milojevi´c, 2014; Kong et al., 2018; Wang et al., 2017), which have made great
32
contributions. However, team effectiveness not only depends on the appropriate team topology structure,
33
but also depends upon their function component, such as the abilities and skill distributions of team
34
members (Li et al., 2017). Some works built, evaluated and refined teams in consideration of both skills
35
of team members and the team topology structure (Li et al., 2017; Wang et al., 2016).
36
Quantifying individual’s ability and impact is a key point for solving the problems of team building,
37
evaluation and refinement. It is also needed in many other practical applications, for example, awards
38
granting, score assessment and scholarship awarding. However, how to evaluate researcher’s ability with
39
limited resources in the diverse academic circumstance is still under exploration.
40
Under the scenario of big scholarly data, a large number of data-driven indices and measures were
41
proposed to evaluate the impact of researchers reliably (Xia et al., 2017). In the early years, h-index (Hirsch,
42
2005) was proposed to evaluate both the publication quantity and quality of researchers based on the
43
number of papers and the citations of the highly cited paper. A researcher with an indexhmeans that
44
he/she hashpublished papers and each of them has been cited at leasthtimes. The index has been proved
to be a simple but valid measure in evaluating scholars’ scientific impact (Bornmann and Daniel, 2005).
46
The h-index has become a frequently used index and has been applied to solve many problems by scholars.
47
Besides, many other indices are proposed to evaluate the performance and impact of researchers, such
48
as g-index (Egghe, 2006), S-index (Sawilowsky, 2012) and AIF (Pan and Fortunato, 2013). Another
49
frequently used measure is Q parameter (Sinatra et al., 2016), which is a unique parameter to capture
50
the ability and the impact evaluation of a scientist. In recent work, methods of ranking authors in a
51
heterogeneous network have been proposed (Meng and Kennedy, 2013; Liu et al., 2014), in which multi
52
types of vertices and relationships are taken into consideration. However, these measures are proposed to
53
evaluate researchers’ abilities and impact on the macro level. They cannot reflect a researcher’s proficiency
54
with a particular skill. Using these measures to solve some practical problems may influence the accuracy
55
of the results.
56
Researchers’ skill sets have been used in solving many problems, such as team formation, team
57
member replacement and team refinement (Kong et al., 2016). Many researchers use terms extracted
58
from paper’s keywords and title or conference and journal name as authors’ skills (Li et al., 2017). They
59
only consider a binary relationship between researchers and skills, that is, whether or not a researcher
60
has a particular skill. However, in real-life practice, the relationship between researcher and skill is more
61
complicated. The skillfulness of expert should be taken into consideration according to his previous
62
experience. Farhadi et al. (2011) proposed a skill grading method in team formation problem. They
63
proposed a complex formula based on the similarity between scholars and their possessed skills to
64
calculate the skillfulness level. Many works used authors’ contribution information to measure their
65
impact and analyzed collaboration patterns of authors (Persson, 2017; Paul-Hus et al., 2017; Rahman et al.,
66
2017; Jr et al., 2017; Biswal, 2013). The contribution information can also be used in credit allocation
67
and ranking authors (Sekercioglu, 2008; Dance, 2012). The contributions are mainly extracted from
68
acknowledgements of papers, or contribution information in journals like PLoS journals, the British
69
Medical Journal, FEBS journal. Other skill evaluation methods are proposed for measuring workers’ skills,
70
where the skills are extracted from job seekers’ resumes in online job market (Zhou et al., 2017; Anderson,
71
2017) and online social platform (Alvarez-Rodr´ıguez and Colomo-Palacios, 2014). For example, in
72
economic issues, skills are extracted for analyzing the relationship between skill and wage (Anderson,
73
2017) and reducing the skills gap (Zhou et al., 2017). However, these methods are mainly proposed to
74
solve problems in labor economics, but cannot be used to evaluate the skills for students and researchers.
75
Despite their success in evaluating a researcher’s impact and ability to some extent, a fine-grained
76
method that quantifies researchers’ skill level is still needed now. In this paper, we analyze the factors
77
affecting scientific skill ranking, and construct a heterogeneous network for mapping them into hypergraph.
78
We present measures to calculate the weights of the edges in heterogeneous network. The degree of
79
skillfulness for a researcher is denoted as the weight of the hyperedge, which is calculated by method
80
inspired from the Laplace kernel function. Our contributions are summarized as follows:
81
• Model establishment. We carry out data and empirical analysis on the features that influence the
82
proficiency of researchers’ skills, and then we establish a Skill Ranking Model to evaluate the
83
skillfulness of researchers via hypergraph.
84
• Dataset construction. We construct a dataset by crawling information from PloS One journal website,
85
including 164,543 papers authored by 684,844 researchers with 10 kinds of skills aggregated by
86
contributions.
87
• Skill ranking analysis. We perform our model on the PloS One journal dataset to validate the
88
effectiveness of the model and the pattern how scholars’ skill ranking increased over time.
89
BACKGROUND
90Facing the highly competitive academic society, researchers have to master a wider variety of skills and
91
knowledge to improve personal strength. Besides, the discipline integration and the researcher’s skill
92
migration have become a trend in academia with the rapid development of science and technology. It
93
is a great challenge to rank skills of researchers under such complex conditions. In this part, we aim at
94
figuring out what influence the researchers’ skill ranking according to data analysis and empirical analysis.
95
We use data collected from PLoS One journal website to make an investigation and carry out our analysis.
96
The PLoS One dataset contains over 170,000 articles collected from the journal website, ranging from
2006 to June 2017. The dataset includes paper title, publish year, authors, number of citations, disciplines
98
and more specifically, authors’ contributions. More details will be introduced in Experiment Setting
99
section.
100
Science and technology are playing important roles in promoting the growth of productivity owing
101
to the unprecedented achievement the researchers have made recently. This development tendency also
102
leads to a burst of complex tasks that need to be solved by working together among experts in different
103
fields. The disciplinary collaboration has reduced the boundaries between disciplines and resulted in a
104
sharp emergence of many marginal disciplines. It is clear that collaboration cross discipline becomes a
105
trend and this will be more frequent in the future. Take PLoS One journal for example, we extracted the
106
disciplines of the PLoS One paper on their website, and the statistics of those 177,147 papers are shown
107
in Fig. 1. There are only 1,843 papers in a single field, and a great amount of papers cross 2-4 fields.
108
Figure 1. The distribution of number of fields for all the papers.
It has been found that collaborations cross disciplines have brought many competitive and high quality
109
outputs (Yegros-Yegros et al., 2015; Nicolini et al., 2012). First, the development of the collaborative
110
relationships between multi-disciplines makes researchers realize the advantages of resource sharing,
111
which can make a better data and knowledge utilization either within a team or in the whole society.
112
The efficiency and outputs of the team are also improved under cross-disciplinary scenario. Second,
113
cross-disciplinary collaboration can bring creative ideas to researchers and produce more novel outputs
114
for teams. Researchers from different fields get strong support from other disciplines during collaboration
115
and discussion. They are more likely to discover valuable problems and create significant innovations
116
because they have less limitation than those who collaborate with researchers in same field.
117
As cross-disciplinary cooperation has become a trend in academia, discipline is one of the most
118
important factors when considering team-related problems. Researchers may learn and use skills of
119
several disciplines in a cross-disciplinary work, which involves knowledge of more than one discipline.
120
However, scientific research varies in different fields, and skills required by each field are diverse. One
121
kind of skill can be different in different fields or disciplines. For example, the skill “experiment” in
122
computer science is totally different from that in biology and chemistry, while another skill “paper writing”
123
is similar between various disciplines or fields. Thus, the skill in different fields has both common features
124
and uniqueness. Diversity of fields and disciplines should be taken into consideration while evaluating
125
researchers’ skills.
126
After taking discipline as an important factor in skill ranking problem, we have two questions: (i) in
127
what aspects it may influence the skill ranking and (ii) how can we quantify a skill’s ranking? Firstly,
128
we consider the importance of a skill in a field, which indicates the relevance of skills in each field. As
129
discussed above, the significance of the same skill in different fields varies, which is caused by discipline
130
diversity and speciality. Here we suppose that the more frequently a skill is used in a field, the more
131
important it is in that field. Thus, we use the rank of times that a skill has been used in a field to quantify
132
its importance in that field.
133
Secondly, a researcher always masters multiple skills, and the proficiency of each skill is not equal as
134
well. As a common sense, the more frequently people use a skill, the more proficient they are in it, that is
“Skill comes from practice”. This indicates that the times a researcher use a skill in works are correlated
136
to the skill’s ranking. In a similar way, we use the rank of times that researchers use a given skill in their
137
works to denote skill’s importance to researchers.
138
Besides, the familiarity of researchers with a certain research field is also vital for ranking skills of
139
researchers in different fields. This feature is quantified by the rank of numbers of papers that researcher
140
published in a given field. The more papers a researcher has published in a field, the more familiar he/she
141
is with that field. Thus, they can perform better and show a higher skill proficiency more easily.
142
According to the above analysis, in order to rank researchers’ skill, field information need to be
143
taken into consideration. Importance of a skill in a field, a researcher’s proficiency of each skill, and the
144
familiarity of a researcher in certain field can influence the ranking level of a skill. Considering those
145
factors, we propose a novel model to rank researchers’ skill.
146
MODEL
147This section describes the definition of skill ranking and the concept of hypergraph. We describe our Skill
148
Ranking Model (SRModel) based on hypergraph in detail.
149
Problem Definition
150
We define the skill ranking problem as follow: Given a complex networkH= (V,E,w), whereV denotes
151
the vertices, including researchers, fields and skills in our model,Edenotes different types of edges, and
152
wdenotes weight of the edges. Skills indicate the ability a researcher got when he/she took part in some
153
real works. Skill ranking problem is to evaluate researchers’ specific skill in specific field by ranking
154
method.
155
We argue that considering pairwise relationship between researcher and the corresponding skill is
156
unconvincing in skill ranking problem. It would be more convincing to take account of three factors.
157
These three factors can be integrated into three kinds of relationships, including relationship between
158
researchers and skills, researchers and fields, fields and skills. In this paper, we use the hypergraph to
159
represent a high order relationship, which is a generation of simple network. Hypergraph can be used
160
to represent the relationship and interaction of two or more nodes. For example, in citation network, a
161
paper and its reference papers can compose a hyperedge. In music recommendation problem (Theodoridis
162
et al., 2013; Bu et al., 2010), a user and music he/she listened along with the music lists compose a
163
hyperedge. Similar problem, such as movie recommendation, interest recommendation (Yao et al., 2016),
164
news recommendation (Liu and Dolan, 2010; Li and Li, 2013), image retrieval (Huang et al., 2010; Yu
165
et al., 2012), user rating (Suo et al., 2015), scientific ranking (Liang and Jiang, 2016), can be solved based
166
on hypergraph framework. Experiments show hypergraph method is powerful and efficient to model
167
multi-relationship systems. In hypergraph, an edge, called hyperedge, contains arbitrary number of nodes,
168
rather than pair of nodes in ordinary graphs (Huang et al., 2010). A hypergraph is a group ofH= (X,E)
169
whereXis a set of vertices, hyperedgeEis a set of non-empty subsets ofX. In our study, node setXis
170
consisted of researcher setR, field setFand skill setS. Each hyperedge includes a researcher, a field and
171
a skill, denoting the ternary relation among them.
172
SRModel
173
Our Skill Ranking Model (SRModel) aims at ranking individual’s different skills using hypergraph model.
174
We consider three kinds of objects and their relations in the model. The objects include researchers, fields
175
and skills, forming the vertices set of the heterogeneous network. In this network, there are three-ary
176
relations between skills, researchers and fields so that normal network structure cannot provide efficient
177
representation of this system. In this paper, we use hypergraph to model the three-ary relations.
178
To construct the hypergraph model, we build a weighted heterogeneous network to calculate the
179
weights of edges first, denoted asH= (V,E,w), whereV =R∪F∪S denotes the set of vertices and
180
E={e|(vi,vj),i6=j}denotes the edge set. A simple example of a part of our heterogeneous network is
181
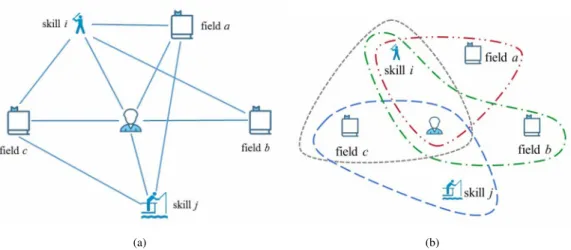
showed in Fig. 2(a). Vertex set includes three kinds of vertices, researchervr, fieldvf and skillvs. Edge
182
setEincludes three kinds of edges, that is, edges between researchers and fields, researchers and skills,
183
fields and skills. In fact, to understand the network clearly, the heterogeneous network can be regard as a
184
“tripartite network”, whose vertices can be divided into three independent and unconnected node setsR,F
185
andS. And each edgee(i,j)in network connect verticesiand jin different node sets.
(a) (b)
Figure 2.Example of our model. (a) A simple example of heterogeneous network containing 6 vertices and 10 hybrid edges. (b) Example of our SRModel, we build this model based on hypergraph, containing 4 hyperedges. For the relationships between researcher, field and skill, a hyperedge exists only if the researcher process the skill in this field.
There are three types of edges indicating pair-wise relationship between different types of nodes. To
187
quantify the importance of the pair-wise relationship, we set each kind of edge a weight to express the
188
importance of the node to the other, which is calculated by the rank of node’s attribute among the others
189
in the same set.
190
One of the three types of edges ise(vsj,vif)between fieldiand skill j. The weight between a skill and a field is calculated by the percentile rank of the skill in the field:
W1(vsj,v f i) =1−γ s f ji/L s f i (1)
whereγs fji denotes the rank of skill jthat used in fieldi, which is calculated by ranking skills according to
191
the times they are used in a field. AndLs fi is the number of skills that used in fieldi. We use the percentile
192
rank is a normalization to eliminate the influence of different number of skills in different fields. Besides,
193
we subtract 1 fromγs fji to make the minimum weight not equal to zero. For example, suppose there are 4
194
skills in a field and their ranks are 1, 2, 3 and 4. The weights between those 4 skills in this field are 1.0,
195 0.75, 0.5 and 0.25, respectively. 196 Weight of edgee(vr k,v f
i)between researcherkand fieldican be regarded as the importance of the researcher in the field, which is calculated by:
W2(vrk,v f i) =1−
q
(γkir f−1)/Lr fi , (2)
whereγkir f denotes the rank of researcherkin fieldi, which is calculated by ranking researchers according
197
to the numbers of previous works they participated in a field. AndLr fi is the total number of researchers in
198
fieldi. Researchers get experience and knowledge of a field when they take part in works in this field. The
199
more works they have done, the more they learned. We perform a normalization by using the percentile
200
rank to eliminate the influence of different number of researchers in different fields, like in Equation 1.
201
There are differences between Equation 2 and Equation 1 because we use the square root to re-scale the
202
weight. The re-scaling operation is to make the distribution of the weight wider because there are many
203
researchers rank in the tail (a large amount of beginners). For example, suppose a fieldmhas five experts,
204
and they have published 5, 3, 3, 1, 1 papers in this field respectively. Thus, the weights between those five
205
experts and fieldmare 1.0, 0.553, 0.553, 0.225, 0.225, respectively.
206
Similarly ,weight of edgee(vrk,vsj) between researcherkand skill j represents how important a researcher is in a given skill, computed by:
W3(vrk,vsj) =1− q
whereγk jrsdenotes the rank of researcherkwith skill j, which is calculated by ranking researchers according
207
to the times they used this skill in their previous work. AndLrs
j denotes the number of researchers with
208
skillj.
209
A hypergraphHh= (X,Eh,wh)is built after constructing the heterogeneous network and calculating the weight of edges. A hypergraph built on the heterogeneous network in Fig. 2(a) is demonstrated in Fig. 2(b). InHh,X is a set of hybrid nodes, composed by researcher, skill and field.Ehis hyperedge on X, andwhis a weight function of hyperedge. For the relationships between researcher, field and skill, a hyperedge exists only if the researcher process the skill in this field. We define the weight function of hyperedge inspired of the Laplace kernel function, and the distance calculation method in (Huang et al., 2010). The weight function is:
W(vrk,vif,vsj) =eΘ,and (4) Θ=W1(v s j,v f i) 2·W1 +W2(v r k,v f i) 2·W2 +W3(v r k,vsj) 2·W3 , (5)
whereW1,W2 andW3are the average edge weights between fields and skills, researchers and fields, 210
researchers and skills, respectively.
211
Based on the above definition and introduction, our Skill Ranking Model has been formulated. The
212
value of skill ranking of a researcher is calculated by the weight of the hyperedge in hypergraph.
213
EXPERIMENT SETTING
214In this section, we introduce the dataset we used in our experience. Then we construct the hypergraph and
215
get the skill sets as well as the skill ranking of researchers.
216
Dataset Construction
217
Previous studies on researchers evaluation usually use datasets of publications to evaluate their methods.
218
These datasets include Digital Bibliography & Library Project (DBLP), American Physical Society (APS),
219
Microsoft Academic Graph (MAG). However, authors’ skills are unavailable in those prevalent datasets. In
220
the previous work where skills are required, such as team formation problem, team member replacement,
221
collaborators recommendation, researchers usually use terms extracted from keywords, title (Farhadi
222
et al., 2011) or conference and journal name (Li et al., 2017) instead of authors’ real skills. Either terms
223
in titles or journal names have limitations to reflect skills of a researcher, because the division of the
224
work is not clear. However, there are several journals providing authors’ contribution statement, such as
225
the British Medical Journal, Nature, Lancet. Besides, journals such as FEBS journal and PLoS journals
226
require authors to declare their contributions in a specified format while submitting the paper.
227
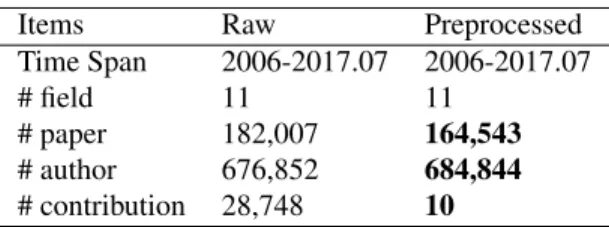
Table 1. Selected PLoS One dataset
Items Raw Preprocessed
Time Span 2006-2017.07 2006-2017.07
# field 11 11
# paper 182,007 164,543 # author 676,852 684,844 # contribution 28,748 10
We create a dataset by crawling papers’ information together with their research fields and authors
228
individual contributions from the PLoS One journal website to validate our model, as we mentioned in
229
Background section. PloS One journal is an open-access journal, so we can extract information from their
230
website by parsing their HTML pages of each paper with Python. The contribution information of this
231
journal has been used to analyze the authors contribution pattern recently (Jr et al., 2017; Sauermann
232
and Haeussler, 2017). The details of our dataset is shown in Table 1. At first, we remove papers with
233
incomplete information. In the raw dataset, 28,748 kinds of contributions are found, and most of them
234
have similar meaning. PLoS journals recently adopted the CRediT Taxonomy providing standardized
235
and fine-grained information of authors’ contribution (Atkins, 2016), but there are no standard rules for
naming paper’s contributions in the early years. Using the raw contribution directly may bring inaccuracy.
237
There are 100 items appearing more than 40 times accounting for the vast majority (about 96%). Thus we
238
cluster 100 kinds of contributions that appear frequently into 10 categories manually. The categories are
239
shown in Table 2. Here, we regard these 10 categories of contributions as skills of researchers.
240
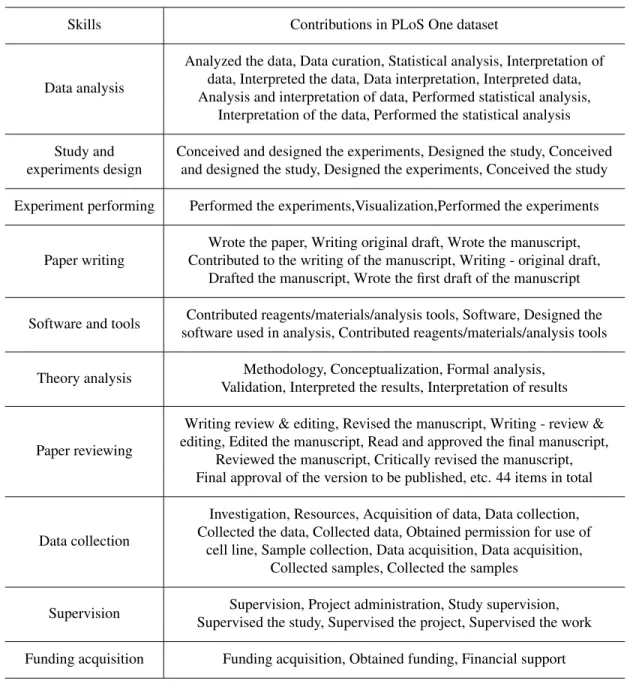
Table 2.The 10 skills and their composed contributions. Skills Contributions in PLoS One dataset
Data analysis
Analyzed the data, Data curation, Statistical analysis, Interpretation of data, Interpreted the data, Data interpretation, Interpreted data, Analysis and interpretation of data, Performed statistical analysis,
Interpretation of the data, Performed the statistical analysis Study and
experiments design
Conceived and designed the experiments, Designed the study, Conceived and designed the study, Designed the experiments, Conceived the study Experiment performing Performed the experiments,Visualization,Performed the experiments
Paper writing
Wrote the paper, Writing original draft, Wrote the manuscript, Contributed to the writing of the manuscript, Writing - original draft,
Drafted the manuscript, Wrote the first draft of the manuscript Software and tools Contributed reagents/materials/analysis tools, Software, Designed the
software used in analysis, Contributed reagents/materials/analysis tools Theory analysis Methodology, Conceptualization, Formal analysis,
Validation, Interpreted the results, Interpretation of results
Paper reviewing
Writing review & editing, Revised the manuscript, Writing - review & editing, Edited the manuscript, Read and approved the final manuscript,
Reviewed the manuscript, Critically revised the manuscript, Final approval of the version to be published, etc. 44 items in total
Data collection
Investigation, Resources, Acquisition of data, Data collection, Collected the data, Collected data, Obtained permission for use of
cell line, Sample collection, Data acquisition, Data acquisition, Collected samples, Collected the samples
Supervision Supervision, Project administration, Study supervision, Supervised the study, Supervised the project, Supervised the work Funding acquisition Funding acquisition, Obtained funding, Financial support
The acronyms of authors’ name followed the contributions on the PLoS One web pages. We match
241
the acronyms up with authors’ full name in author list of each paper. Then we get the authors’ skills in
242
every paper.
243
Another vital step is name disambiguation. Multiple authors may share the same name, and there is
244
no unique identifier for each author in PLoS One journal. It can cause confusion and even fault if we
245
regard those authors with the same name as one person. Many researches have employed a variety of
246
features to distinguish authors sharing the same name, such as affiliations, coauthors, topics or research
247
interests (Kang et al., 2009; Ferreira et al., 2012). To distinguish authors in PLoS One dataset, the
248
following features are adopted:(i)Affiliation: Authors with the same name and the same affiliation are
249
regarded as the same authors;(ii)Coauthor: If two authorsM1andM2with the same name coauthored 250
one or more papers with a third authorN, it is likely thatM1andM2are the same author namedM. We 251
combine these two features to disambiguate the authors’ name. There are 676,852 authors in the raw
252
dataset, and 684,844 authors after naming disambiguation.
253
Network Construction
254
To construct the SRModel framework using PLoS One dataset, our experiment consists of four main parts
255
as follows.
256
1. Construct a heterogeneous network with three kinds of vertices and three kinds of edges.
257
2. Compute the edge weight according to Eq. (1), Eq. (2) and Eq. (3).
258
3. Build hypergraphHh= (X,Eh,wh)and compute the hyperedge weight using Eq. (4).
259
4. Calculate the researchers’ yearly skill rankingWifrom 2006 to 2016 respectively.
260
In the first step, we construct a heterogeneous network including three kinds of vertices and three
261
kinds of relationships. Edge between researcher and field/skill exists only if he/she published paper in
262
this field or used this skill at least once. A vertex denoting fieldvif and a vertex denoting skillvs jare
263
connected if one or more papers in fieldiuse skill j. There are 684,844 authors, 11 fields and 10 skills in
264
the heterogeneous network, forming 2,758,522 edges in total.
265
In the second step, we compute the weights of edges in the constructed network. We compute the
266
weights of field-skill, researcher-field and researcher-skill by Eq. (1), Eq. (2) and Eq. (3), respectively.
267
We rank the skills in fieldiby the numbers of papers in fieldithat using the skills, and for each skill j
268
the rank is denoted asγs fji. AndLs fi is the total number skills in fieldi. When calculating the weights
269
between researchers and fields, we assume the more paper a researcher published in a field, the more
270
he/she is familiar with the field. Thus, we rank the researchers according to the numbers of papers they
271
published in fieldi, and for researcherkthe rank is denoted asγkir f. And let the total number of researchers
272
in fieldiasLr fi in Eq. (2). Similarly,γk jrsis the rank of researcherkusing skill jby the number of paper he
273
published using this the skill, andLrsj is the total number of researchers that using skill jin Eq. (3).
274
Algorithm 1:Algorithm to calculate the skill ranking of researchers Input: Weight of edges; paper information
Output: Hyperedge weights 1 W1=AV G(skills,f ields); 2 W2=AV G(researchers,f ields); 3 W3=AV G(researchers,skills); 4 hyperedges=list();
5 hyperWeight=dict(); 6 forpaper in datasetdo
7 add (researcher, field, skill) tohyperedges; 8 for(r,f,s)in hyperedgesdo 9 Θ=w1[s,f] 2·W1 + w2[r,f] 2·W2 + w3[r,s] 2·W3 ; 10 weight=eΘ; 11 hyperWeight[r,f,s] =weight; 12 returnhyperWeight;
In the third step, we construct the hypergraph and calculate the skill proficiency of authors. A
275
hyperedge connects a researcher, field and skill if the researcher published paper in this field using this
276
skill. There are 9,501,866 hyperedges in the constructed hypergraph in total. And the weight of hyperedge
277
is calculate by Eq. (4), representing a researcher’s skill proficiency in a field. The pseudo code of the
278
algorithm to calculate the skill ranking is shown in Algorithm 1. LetEdenote the number of hyperedges,
279
so the time complexity of constructing a heterogeneous network of skill, field and researcher isO(E).
280
Then, building hypergraph based on the network and calculating weight of hyperedges can be performed
together. The time complexity of these two steps are alsoO(E). So the over all time complexity of our
282
skill ranking method isO(E).
283
In fact, the skill ranking that we calculate in the third step is a snapshot at the time when the data are
284
collected. In the last step, we take a snapshot every year to construct a series of hypergraphs and calculate
285
the weights of the hyperedges to represent the researchers’ skill rankings at different time, denoted asWi,
286
wherei∈[2006,2016]. That is, the skill ranking of the researcher in a field at yeariis calculated by all
287
the papers he published until yeari. We use the yearly skill ranking information to analyze the dynamic
288
of researchers’ skill proficiency. And we can also get the researchers’ abilities in the year when paper was
289
published.
290
RESULT
291We construct the hypergraph model and then calculate the weight of the hyperedge using it. Based on the
292
hyperedge weight, we can calculate the skill rank of a researcher in a field. In this section, we validate the
293
effectiveness of the SRModel and carry out several analyses on the ranking results.
294
Validation of SRModel
295
We computed the correlation coefficient between researchers’ skill ranking and their h-index and performed
296
hypothesis test to validate our model’s performance.
297
Correlation Between Skill Ranking and h-index
298
Table 3.Correlation coefficient of skill ranking and h-index Skill Correlation coefficient Experiment performing 0.7717 Data analysis 0.8036 Paper reviewing 0.7013 Paper writing 0.801 Supervision 0.5561 Theory analysis 0.5177 Funding acquisition 0.7582 Software and tools 0.7822 Study and experiments design 0.8155 Data collection 0.6173
To verify the validity of the method, and explore the potential relationship between skill ranking
299
and h-index, we analyze how skill ranking changes with the increase of h-index. PLoS One is a journal
300
mainly focusing on biology. Among the 182,007 papers that we obtained in their website, more than
301
169,150 papers are in the field of biology. Thus, we use the papers and authors in biology to perform
302
the verification. Researchers’ skill ranking are calculated by the data in PLoS One. But only a fraction
303
of researchers’ papers are published in this journal. It is not reasonable to use authors’ real h-indices to
304
analyze the relationship with their skill ranking. Thus, we calculate the h-indices of all the authors in
305
PLoS One dataset according to the papers they published in this journal and their citation counts. The
306
h-indices of authors in PLoS One dataset ranges from 0 to 32. Pearson correlation coefficient quantifies
307
the linear correlation between two groups of continuous variables (Pearson, 1895). Thus, we calculate
308
the correlation coefficient between skill ranking and h-index, shown in Table 3. We notice that all the
309
correlation coefficient is lager than 0.5, especially for the skill “Data analysis”, “Paper writing” and
310
“Study and experiments design”, of which the correlation coefficients are lager than 0.8, which indicates a
311
high correlation. This result means that a researcher with a higher h-index often has a higher skill ranking,
312
which suggests that if a researcher is more skillful with academic skills, they can obtain outcomes with
313
higher quality.
314
Then we analyze the distribution of skill ranking to prove the rationality of the model. The result
315
is shown in Fig. 3. Both of two distribution curves subject to exponential distribution of function
316
y=ea+bx+cx2, and the R-square of these two fitting functions is close to 1, which indicates the fitting
317
degree is high. It means that the distribution of researchers’ h-index and skill ranking have the same kind
(a) (b)
Figure 3.Distributions and fitted lines of h-index (R2=0.99) and skill ranking (R2=0.97). The x axes denote the value of h-index and skill ranking, and y axes denote the numbers. Both h-index and skill ranking are subject to exponential distribution.
of distribution, which also explains the high correlation coefficient between them and the rationality of
319
the skill ranking model.
320
Relationship Between Skill Ranking and Citation
321
To validate whether the skill ranking computed by our model is significant for the quality of scholar’s
322
research outputs, we defined a hypothesis that there are differences between the citation counts of papers
323
whose authors’ average skill ranking are different. We use the single side t-test, which is also known
324
as “student test” (Gosset, 1908), to test the hypothesis we made. In our experiments, we use papers in
325
biology from 2009 to 2015 as the sample set. Here, firstly we group all papers by their publish years
326
because the citation is highly influenced by paper’s age and we just have the citation counts of paper in
327
2017. We remove the first three years because we don’t have enough papers and researchers in our dataset,
328
and we remove the last two year because the citation counts of paper are still growing. Then, we calculate
329
the average skill ranking of paper’s authors in the year they wrote it for each paper. We split every group
330
into two parts to perform our test. The one consists of papers with authors average skill ranking less than
331
the median value of the group. The other contains the rest of papers. We denote the part of papers with
332
higher authors’ skill ranking as random variableX1and the lower papers asX2. 333
We perform a t-test with the settings mentioned before. Thenull hypothesisfor testing isH0:µ1=µ2
andalternative hypothesisasH1:µ1>µ2, whereµ1andµ2are the mean value of the population of the
two groups of random variables we defined above. We use the SciPy module in Python to do the test (Jones et al., 01 ), which can compute both the statistical value andp−valueof the t-test together by function
scipy.stats.ttest ind(X1,X2,equal var=True).
If thep−valueis less than some significance level (typically 0.05), we can reject the null hypothesis and
334
hold the alternative hypothesisH1:µ1>µ2, which means the average citation of papers with higher skill 335
rank authors are more than papers with authors lower skill rank. But the result of t-test is sensitive to the
336
equality of samples variance. If variances of two groups of samples are not equal, the result needs to be
337
corrected. So before performing the t-test on samples, we do a Levene’s test to assess the equality of two
338
groups of variances. If thep−valueof Levene’s test is bigger than 0.05, which means the variances of
339
two variables are not equal, we need to set the parameterequal val=Falsein the t-test function to avoid
340
deviation.
341
The average citation counts of two groups of samples are shown in Table 4. Paper written by authors
342
with relatively low skill ranking have lower average citation counts. And all the p-value in t-test is lower
343
than 0.05, which indicates there are significant differences in sample mean values. Thus, the skill ranking
344
of authors influence the citation counts of outputs.
Table 4.Average citation counts of two groups of samples and their p-value. year avg-low avg-high p-value
2009 37.5 42.0 7.2×10⁻⁴ 2010 31.2 36.0 7.0×10⁻⁵ 2011 24.8 27.5 2.3×10⁻⁶ 2012 18.5 20.4 1.6×10⁻¹¹ 2013 13.3 14.7 1.9×10⁻¹⁴ 2014 9.0 9.9 1.2×10⁻¹³ 2015 4.8 5.3 7.7×10⁻¹³
Analysis of Skill Ranking Increase
346
We define the researcher’s academic age in PLoS One dataset as the number of years between his first
347
paper and the last paper in this dataset. Although PLoS One is a comprehensive journal with large amount
348
of papers, it cannot include all the papers published by every researcher. There still exist many researchers
349
that published many papers but only one or two in this journal. Analyzing the skill rankings of those
350
researchers is meaningless. In order to avoid the defect of the dataset as much as possible, we choose
351
researchers whose both academic ages and numbers of published papers ranked at top 10% respectively,
352
named as “top researchers”, including 26,978 researchers, to carry out the analysis.
353
Figure 4.Yearly change rate of top researchers’ skills. The x axis is the number of researcher-field-skill pairs and the y axis is the change rate. Red and green bars denote the number of increase and decrease sets with the corresponding change rate in y axis, respectively.
We first calculate the yearly change rate of researchers’ skill ranking. The yearly change rate indicates
354
that how much the skill ranking of a researcher increased or decreased compared to that in one year
355
before, defined as∆i=Wi−Wi−1
Wi−1 , whereWiis the value of skill ranking in yeariandWi−16=0. We show
356
the distribution of yearly change rate between 0 to 100% in Fig 4. The change rate of most researchers’
357
skills are less than 20%. The green bar demonstrates a slight decrease existing in the researchers’ skill
358
ranking, because the progress of other researchers decrease the rank of them. Observing the curve of
359
researchers’ skills, we found the skills of most researchers are fluctuating upward, but the rising pattern is
360
different. Then, we explore the commonalities and differences of the changes for researchers’ different
361
skills.
362
First, we analyze the rising stages of skills. When a researcher’s skill ranking increased more than
363
20% in a year, we call this year a fast increase year for his skill. The distribution of the longest continuous
364
rapid growth years of each set of researcher-field-skill is presented in Fig. 5. In Fig. 5, we count the total
365
number of researcher-field-skill sets for different length of time. About 434 thousand researcher-field-skill
366
sets experience one-year rapid growth, and the number of that for two years reduced to around 220
367
thousand. A few skill sets rise continuously more than five years, including 1,254 sets for 5 years and 53
368
sets for 6 years. The average fast-growing years among the 730,789 researcher-field-skill sets for 26,798
369
researchers is 1.5 years. That is, it is generally for researchers to spend one or two years putting their
370
energy on one skill and having a good command of it, and then they may focus on other disciplines or
other skills. Several reasons account for this phenomenon. First, researchers usually change their research
372
fields in their research career, especially for those interdisciplinary researchers. The transformation of the
373
field can brings researchers more inspiration and creativity. Second, for a researcher, as he becomes more
374
and more skillful, the work he undertakes in the team may change. We then explore the skill transfer of
375
researchers.
376
Figure 5.Continuous rapid growth years of researchers’ skills. The x axis denotes the continuous rapid growth years and y axis denotes the number of researchers’ skills. There are 730,789 pairs of (researcher, field, skill) for the 26,978 top researchers in total.
Changing Patterns of Skill Ranking
377
Then, we explore the changing patterns of different skills. To investigate how skill ranking changes over
378
time, we propose a method to count the average ranking for each skill in different periods. There are
379
three problems needing to be considered. (1) Researchers’ academic ages are different, and the time when
380
they enroll in a skill or field varies. (2) There are many researchers who didn’t publish paper on PLoS
381
One at the beginning of their academic career. Studying the skill transfer of them is unconvincing. (3)
382
Many researchers didn’t publish paper every year in PLoS One and the numbers of paper published by
383
researchers are totally different. To solve these problems, we define a researcher’s “academic stage” as the
384
period between years he have published papers. For example, a researchermpublished 2, 5 and 1 papers
385
in 2013, 2015 and 2016, respectively, so he has three academic stages, which are 2013-2014, 2015-2015,
386
2016-2016. The skill ranking of each stage is indicated by the skill ranking in the first year of the stage.
387
After we got the skill ranking of all the stages for all the top researchers, we calculate the average
388
value in each stage for different skills, and show the result in Fig. 6. We divide the skills into four
389
groups according to their trend. In Fig. 6(a) we noticed that there were five skills of which the rank kept
390
increasing through out all academic stage, and the increase rate is higher than other groups, including
391
“paper writing”, “data analysis”, “study and experiments design”, “experiment performing” and “software
392
and tools”. It suggests that these five skills are the basic academic skills so that they are important for
393
many researchers through out their academic career. The second group, as shown in Fig. 6(b), has two
394
skills, “supervision” and “theory analysis”. The rankings of these two skills change slowly in the early
395
stages and have a sharp increase at the latter academic stages, which indicates that these two skills need
396
more experience in academia and are harder to develop. Fig. 6(c) is the third group of skills, including
397
“paper reviewing” and “data collection”. These two skills are rising in the early stage and finally falling
398
down slightly, especially the skill “data collection”, whose increase rate is very small after the fourth stage.
399
We assume that these two skills are easy to get started, and when researchers have more experience they
400
will not use these skills frequently. There is one skill in Fig. 6(d), the trend of which is not so obvious.
401
We think “funding acquisition” has little correlation with time in our dataset. Maybe the time span is not
402
long enough to find its changing law.
403
Thus, we find the changing patterns of different skills vary. Some skills are easy to get started. When
404
researchers have more experience, they will transfer their interests to other skills. Some skills are harder
405
to develop, researchers with these skills need to develop other skills first, thus they develop these skills in
406
their latter academic stage. There are also some basic skills and they are important for many researchers
407
through out their academic career.
(a) (b) (c) (d)
Figure 6.Average skill ranking in different periods. The x axis is the stage, and y axis is the researchers’ average skill ranking in each stage. We divide the skills into four groups according their trend.
CONCLUSION AND FUTURE WORK
409In this paper, we make both empirical analysis and data analysis to figure out factors affecting the result
410
of skill ranking. Then we construct a model named SRModel based on hypergraph to describe the
411
relationships among researchers, skills and fields. This model can be used to rank researcher’s scientific
412
skills. We apply our model on PLoS One dataset, which is extracted from the journal website. We got the
413
weighted field-skill sets for each researcher. We validate our method by correlation analysis with h-index
414
and hypothesis test. Then we use the results to analyze the increase of skill ranking and patterns of skill
415
ranking change.
416
Skill ranking can be applied to many practical problems, such as collaborators recommendation, team
417
formation, team member replacement and team refinement. In problems where skill similarity is required,
418
the researcher’s proficiency in each skill can make the results more precise. In other problems where skill
419
grading are needed, a fine-grained method can lead to a better result. In the future work, we will use our
420
model to solve some practical problems and examine its reliability and effectiveness. Datasets of other
421
disciplines like software engineering and physics can be taken into consideration to verify the validity of
422
the model. Besides, more factors and relationships will be taken into consideration to rank skills.
423
ACKNOWLEDGMENTS
424REFERENCES
425Alvarez-Rodr´ıguez, J. M. and Colomo-Palacios, R. (2014). Assessing professional skills in a multi-scale
426
environment by means of graph-based algorithms. InEuropean Network Intelligence Conference, pages
427
106–113.
428
Anderson, K. A. (2017). Skill networks and measures of complex human capital. Proceedings of the
429
National Academy of Sciences of the United States of America, 114(48):12720–12724.
430
Atkins, H. (2016). Author credit: Plos and credit update. https://blogs.plos.org/plos/
431
2016/07/author-credit-plos-and-credit-update/. The Official PLOS Blog.
432
Biswal, A. K. (2013). An absolute index (ab-index) to measure a researcher’s useful contributions and
433
productivity.PLOS ONE, 8(12).
434
Bornmann, L. and Daniel, H. D. (2005). Does the h-index for ranking of scientists really work?
435
Scientometrics, 65(3):391–392.
436
Bu, J., Tan, S., Chen, C., Wang, C., Wu, H., Zhang, L., and He, X. (2010). Music recommendation by
437
unified hypergraph: combining social media information and music content. InACM International
438
Conference on Multimedia, pages 391–400.
439
Dance, A. (2012). Authorship: Who’s on first? Nature, 489(7417):591–593.
440
Egghe, L. (2006). Theory and practise of the g-index.Scientometrics, 69(1):131–152.
441
Farhadi, F., Sorkhi, M., Hashemi, S., and Hamzeh, A. (2011). An effective expert team formation in
442
social networks based on skill grading. InIEEE International Conference on Data Mining Workshops,
443
pages 366–372.
444
Ferreira, A. A., Gonc¸alves, M. A., and Laender, A. H. (2012). A brief survey of automatic methods for
445
author name disambiguation.Acm Sigmod Record, 41(2):15–26.
446
Gosset, W. S. (1908). The probable error of a mean.Biometrika, 6(1):1–25.
Hirsch, J. E. (2005). An index to quantify an individual’s scientific research output.Proceedings of the
448
National Academy of Sciences of the United States of America, 102(46):16569–16572.
449
Huang, Y., Liu, Q., Zhang, S., and Metaxas, D. N. (2010). Image retrieval via probabilistic hypergraph
450
ranking. InComputer Vision and Pattern Recognition, pages 3376–3383.
451
Jones, E., Oliphant, T., and Peterson, P. (2001–). SciPy: Open source scientific tools for Python. [Online;
452
accessed 2018-11-11].
453
Jr, E. A. C., Silva, F. N., Costa, L. D. F., and Amancio, D. R. (2017). Patterns of authors contribution in
454
scientific manuscripts.Journal of Informetrics, 11(2):498–510.
455
Kang, I. S., Na, S. H., Lee, S., Jung, H., Kim, P., Sung, W. K., and Lee, J. H. (2009). On co-authorship
456
for author disambiguation.Information Processing & Management, 45(1):84–97.
457
Kong, X., Jiang, H., Wang, W., Bekele, T. M., Xu, Z., and Wang, M. (2017). Exploring dynamic
458
research interest and academic influence for scientific collaborator recommendation.Scientometrics,
459
113(1):369–385.
460
Kong, X., Jiang, H., Yang, Z., Xu, Z., Feng, X., and Tolba, A. (2016). Exploiting publication contents and
461
collaboration networks for collaborator recommendation.Plos One, 11(2):e0148492.
462
Kong, X., Mao, M., Wang, W., Liu, J., and Xu, B. (2018). Voprec: Vector representation learning of papers
463
with text information and structural identity for recommendation. IEEE Transactions on Emerging
464
Topics in Computing, DOI: 10.1109/TETC.2018.2830698.
465
Lee, I., Xia, F., and Roos, G. (2017). An observation of research complexity in top universities based on
466
research publications. InInternational World Wide Web Conference, pages 1259–1265.
467
Li, L. and Li, T. (2013). News recommendation via hypergraph learning: encapsulation of user behavior
468
and news content. InProceedings of the sixth ACM international conference on Web search and data
469
mining, pages 305–314. ACM.
470
Li, L., Tong, H., Cao, N., Ehrlich, K., Lin, Y.-R., and Buchler, N. (2017). Enhancing team composition in
471
professional networks: Problem definitions and fast solutions.IEEE transactions on knowledge and
472
data engineering, 29(3):613–626.
473
Liang, R. and Jiang, X. (2016). Scientific ranking over heterogeneous academic hypernetwork. In
474
Thirtieth AAAI Conference on Artificial Intelligence, pages 20–26.
475
Liu, J. and Dolan, P. (2010). Personalized news recommendation based on click behavior. InInternational
476
Conference on Intelligent User Interfaces, pages 31–40.
477
Liu, Z., Huang, H., Wei, X., and Mao, X. (2014). Tri-rank: An authority ranking framework in
478
heterogeneous academic networks by mutual reinforce. pages 493–500.
479
Meng, Q. and Kennedy, P. J. (2013). Discovering influential authors in heterogeneous academic networks
480
by a co-ranking method. InACM International Conference on Conference on Information & Knowledge
481
Management, pages 1029–1036.
482
Milojevi´c, S. (2014). Principles of scientific research team formation and evolution.Proceedings of the
483
National Academy of Sciences, 111(11):3984–3989.
484
Nicolini, D., Mengis, J., and Swan, J. (2012). Understanding the role of objects in cross-disciplinary
485
collaboration.Organization science, 23(3):612–629.
486
Pan, R. K. and Fortunato, S. (2013). Author impact factor: tracking the dynamics of individual scientific
487
impact.Scientific Reports, 4:4880.
488
Paul-Hus, A., Mongeon, P., Sainte-Marie, M., and Larivi`ere, V. (2017). The sum of it all: revealing
489
collaboration patterns by combining authorship and acknowledgements. Journal of Informetrics,
490
11(1):80–87.
491
Pearson, K. (1895). Note on regression and inheritance in the case of two parents.Proceedings of the
492
Royal Society of London, 58:240–242.
493
Persson, R. A. (2017). Bibliometric author evaluation through linear regression on the coauthor network.
494
Journal of Informetrics, 11(1):299–306.
495
Rahman, M. T., Mac Regenstein, J., Kassim, N. L. A., and Haque, N. (2017). The need to quantify authors’
496
relative intellectual contributions in a multi-author paper.Journal of Informetrics, 11(1):275–281.
497
Sauermann, H. and Haeussler, C. (2017). Authorship and contribution disclosures.Science Advances,
498
3(11).
499
Sawilowsky, S. S. (2012). S-index : A comprehensive scholar impact index. International Review of
500
Social Sciences & Humanities.
501
Sekercioglu, C. H. (2008). Quantifying coauthor contributions.Science, 322(5900):371–371.
Sinatra, R., Wang, D., Deville, P., Song, C., and Barab´asi, A. L. (2016). Quantifying the evolution of
503
individual scientific impact.Science, 354(6312):aaf5239–aaf5239.
504
Suo, Q., Sun, S., Hajli, N., and Love, P. E. D. (2015). User ratings analysis in social networks through a
505
hypernetwork method.Expert Systems with Applications, 42(21):7317–7325.
506
Theodoridis, A., Kotropoulos, C., and Panagakis, Y. (2013). Music recommendation using hypergraphs
507
and group sparsity. InAcoustics, Speech and Signal Processing (ICASSP), 2013 IEEE International
508
Conference on, pages 56–60. IEEE.
509
Wang, W., Yu, S., Bekele, T. M., Kong, X., and Xia, F. (2017). Scientific collaboration patterns vary with
510
scholars’ academic ages.Scientometrics, 112(1):329–343.
511
Wang, X., Zhao, Z., and Ng, W. (2016). USTF: A unified system of team formation.IEEE Transactions
512
on Big Data, 2(1):70–84.
513
Xia, F., Wang, W., Bekele, T. M., and Liu, H. (2017). Big scholarly data: A survey.IEEE Transactions on
514
Big Data, 3(1):18–35.
515
Yao, L., Sheng, Q. Z., Ngu, A. H., and Li, X. (2016). Things of interest recommendation by leveraging
516
heterogeneous relations in the internet of things.ACM Transactions on Internet Technology (TOIT),
517
16(2):9.
518
Yegros-Yegros, A., Rafols, I., and D’Este, P. (2015). Does interdisciplinary research lead to higher citation
519
impact? the different effect of proximal and distal interdisciplinarity.PloS one, 10(8):e0135095.
520
Yu, J., Tao, D., and Wang, M. (2012). Adaptive hypergraph learning and its application in image
521
classification.IEEE Transactions on Image Processing A Publication of the IEEE Signal Processing
522
Society, 21(7):3262.
523
Zhou, W., Zhu, Y., Javed, F., Rahman, M., Balaji, J., and Mcnair, M. (2017). Quantifying skill relevance
524
to job titles. InIEEE International Conference on Big Data, pages 1532–1541.