This content has been downloaded from IOPscience. Please scroll down to see the full text.
Download details:
IP Address: 128.41.61.111
This content was downloaded on 25/08/2016 at 18:51
Please note that terms and conditions apply.
You may also be interested in:
The effect of the spatial sampling rate on quantitative phase information extracted from planar and tomographic edge illumination x-ray phase contrast images
C K Hagen, P C Diemoz, M Endrizzi et al.
Proof-of-concept demonstration of edge-illumination x-ray phase contrast imaging combined with tomosynthesis
Magdalena B Szafraniec, Thomas P Millard, Konstantin Ignatyev et al.
Applications of a non-interferometric x-ray phase contrast imaging method with both synchrotron and conventional sources
M Endrizzi, P C Diemoz, P R T Munro et al.
Absorption, refraction and scattering retrieval with an edge-illumination-based imaging setup Marco Endrizzi and Alessandro Olivo
Comparison of different numerical treatments for x-ray phase tomography of soft tissue from differential phase projections
Daniele Pelliccia, Raquel Vaz, Imants Svalbe et al.
Advantages of phase retrieval for fast x-ray tomographic microscopy R Mokso, F Marone, S Irvine et al.
Reverse projection retrieval in edge illumination x-ray phase contrast computed tomography
View the table of contents for this issue, or go to the journal homepage for more 2016 J. Phys. D: Appl. Phys. 49 255501
(http://iopscience.iop.org/0022-3727/49/25/255501)
1. Introduction
X-ray phase contrast computed tomography (CT) exploits phase shifts (refraction) in addition to attenuation for con-trast generation. Specifically, this imaging modality can provide three-dimensional maps of both the real and imagi-nary parts of the complex refractive index within a sample:
( )= −δ( )+ β( )
n x y z k, , ; 1 x y z k, , ; i x y z k, , ; , where δ and β denote local phase shift (refraction) and attenuation
properties, respectively, (x, y, z) are the sample coordinates and k is the wave number. Such bimodal imaging can provide additional information for samples exhibiting weak attenua-tion contrast [1]. Until now, several x-ray phase contrast CT techniques have been developed [18]; the one we use here is based on the edge illumination (EI) principle [14]. By illumi-nating only the edges of a row of pixels with a narrow (typi-cally <20 μm) laminar beam, sensitivity to refraction, i.e. the local manifestation of phase shifts, is achieved: beamlets refracted towards/away from the pixels’ active areas cause an increase/decrease in the measured intensity. When combined with conventional x-ray sources, EI is often implemented in full-field mode [15] (figure 1(a)). In this setup, a mask in
Journal of Physics D: Applied Physics
Reverse projection retrieval in edge
illumination x-ray phase contrast computed
tomography
Charlotte K Hagen, Marco Endrizzi, Paul C Diemoz and Alessandro Olivo Department of Medical Physics and Biomedical Engineering, University College London, Malet Place, London WC1E 6BT, UK
E-mail: [email protected]
Received 8 February 2016, revised 20 April 2016 Accepted for publication 3 May 2016
Published 25 May 2016
Abstract
Edge illumination (EI) x-ray phase contrast computed tomography (CT) can provide three-dimensional distributions of the real and imaginary parts of the complex refractive index (n= − +1 δ iβ) of the sample. Phase retrieval, i.e. the separation of attenuation and
refraction data from projections that contain a combination of both, is a key step in the image reconstruction process. In EI-based x-ray phase contrast CT, this is conventionally performed on the basis of two projections acquired in opposite illumination configurations (i.e. with different positions of the pre-sample mask) at each CT angle. Displacing the pre-sample mask at each projection makes the scan susceptible to motor-induced misalignment and prevents a continuous sample rotation. We present an alternative method for the retrieval of attenuation and refraction data that does not require repositioning the pre-sample mask. The method is based on the reverse projection relation published by Zhu et al (2010 Proc. Natl Acad. Sci. USA 107 13576–81) for grating interferometry-based x-ray phase contrast CT. We use this relation to derive a simplified acquisition strategy that allows acquiring data with a continuous sample rotation, which can reduce scan time when combined with a fast read-out detector. Besides discussing the theory and the necessary alignment of the experimental setup, we present tomograms obtained with reverse projection retrieval and demonstrate their agreement with those obtained with the conventional EI retrieval.
Keywords: phase contrast imaging, computed tomography, phase retrieval, x-ray imaging (Some figures may appear in colour only in the online journal)
C K Hagen et al
Reverse projection retrieval in edge illumination x-ray phase contrast computed tomography
Printed in the UK 255501 JPAPBE © 2016 IOP Publishing Ltd 2016 49
J. Phys. D: Appl. Phys.
JPD
0022-3727
10.1088/0022-3727/49/25/255501
Paper
25
Journal of Physics D: Applied Physics IOP
Original content from this work may be used under the terms of the Creative Commons Attribution 3.0 licence. Any further distribution of this work must maintain attribution to the author(s) and the title of the work, journal citation and DOI.
doi:10.1088/0022-3727/49/25/255501
C K Hagen et al
2
front of the sample (‘pre-sample mask’) splits the beam into an array of physically separated beamlets, and a second mask in front of an area detector (‘detector mask’) creates insen-sitive areas (‘edges’) between the pixels. By positioning the pre-sample mask such that each individual beamlet falls par-tially on a pixel and parpar-tially on an absorbing detector mask septum, the EI principle is replicated over the entire field of view (FOV). The requirement to keep the beamlets spatially separated imposes an upper limit on the tolerable source blur, which depends on the mask design and the system dimensions [16]. Ultimately, the blur also determines the phase sensitivity of the setup [3].
Assuming beamlets of unit intensity, a projection (P) acquired with such a setup can be described by [2, 11]:
( ) ( ) ⎜⎛ ( )⎟ ⎝ α ⎞⎠ = ⋅ + P Mx My C x z x y M , eA x y , , m , 3 (1) where A x y( ), = −2k
∫
β(x y z z, , d) and α( ) ( / )x y, = ∂ ∂x∫
δ(x y z z, , d) are the sample-induced attenuation and refrac-tion, z3 is the sample-to-detector distance and M is themagni-fication between the pre-sample mask and the detector. Note that only refraction in the x-direction is considered since this is the system’s direction of sensitivity as determined by the orientation of the mask apertures. The symbol C denotes the illumination curve which can be measured in the absence of a sample by step-scanning the pre-sample mask along the x-direction and recording the intensity at each step (figure 1(b)); xm is the pre-sample mask position used for imaging.
Equation (1) is based on the fact that a refraction by angle ( )
αx y, causes a beamlet shift of z3α( )/x y M, , which is
equivalent to a shift introduced by a displacement of the pre-sample mask. In the derivation of equation (1), small-angle scattering has been neglected, although the model can easily be extended to scattering samples [5, 6].
Both half slopes of the illumination curve correspond to a partial illumination of the detector mask septa, yet opposite septa are illuminated (figure 1(b)). Previous work has shown that A(x, y) and α( )x y, can be retrieved when two projections are acquired, one on each half slope [2, 11]. In CT mode, i.e. when the sample is rotated and two projections are acquired at each CT angle, this yields attenuation and refraction sino-grams for each transverse sample slice ( y=const.):
∫
θ = − β ′ ′ S xA( ), 2k (x z, )dz (2)∫
θ = ∂ δ ∂ ′ ′ α S x x x z z , , d . ( ) ( ) (3) In the above, θ denotes the CT angle, and (x z′ ′, ) (= xcosθ−θ θ+ θ
zsin , sinx zcos ) are the coordinates of the rotating sample. When θ covers a range of at least 180°, tomographic maps of kβ (‘attenuation tomograms’) and δ (‘phase tomo-grams’) can be reconstructed through standard methods, e.g. filtered back projection (FBP). Note that, for polychromatic radiation, tomograms refer to effective energies [12]. The deriv-ative in the refraction sinogram makes EI belong to the class of differential phase contrast (DPC) techniques, and implies that an additional integration step or the use of a dedicated filter function in the FBP is required in the reconstruction [13].
The necessity to acquire projections in opposite illumina-tion configuraillumina-tions at each CT angle has two major drawbacks. First, the displacement of the pre-sample mask from xm1 to xm2
can cause inaccurate mask alignment due to a limited motor precision. Second, each displacement requires an interruption of the sample rotation, thus preventing a continuous sample rotation. In this paper, we present an alternative retrieval method based on the concept of reverse projection, which was first published by Zhu et al (2010) and later analysed in more detail by Wu et al (2015) for grating interferometry-based x-ray phase contrast CT [20, 21], but which has not yet been applied to EI-based x-ray phase contrast CT nor implemented with a conventional x-ray source. This concept relies on the fact that, after a 180 degree rotation of the sample, refraction occurs in the opposite direction, while the magnitude of the refraction angle and the total attenuation remain the same. As shown in the following, when applied to EI-based PC-CT, these relations allow extracting A(x, y) and α( )x y, from two projections acquired in the same illumination configuration (i.e. with the pre-sample mask located in the same position), but with a rotation offset of 180° between them. This implies that a complete CT dataset can be collected by rotating the sample over 360° instead of 180°, without the need to dis-place the pre-sample mask. While the total number of images remains the same, reverse projection retrieval simplifies the acquisition protocol and eliminates the potential for motor-induced misalignment. Moreover, it allows the sample to be rotated continuously. For fast read-out detectors, this typically leads to reduced scan times.
Figure 1. (a) Full-field implementation of EI x-ray phase contrast CT (not to scale). (b) Illumination curve as a function of the pre-sample mask position along the x-direction (one period); the left and right half slopes correspond to opposite illumination configurations, which are achieved for different pre-sample mask positions (xm1, xm2).
In the following, we describe the theory of reverse pro-jection retrieval for EI-based x-ray phase contrast CT. Moreover, we discuss a necessary experimental requirement, namely a specific alignment condition of the imaging setup. Experiments with a laboratory-based x-ray tube demonstrate that reverse projection retrieval leads to images in agreement with those obtained with the previously used, conventional EI retrieval. Finally, tomograms acquired with a continuous sample rotation and reconstructed using the reverse projection retrieval are shown to provide quantitative accuracy.
2. Theoretical and experimental bases
2.1. Reverse projection retrieval
As was mentioned above, conventionally in EI-based phase contrast CT the retrieval of attenuation and refraction data is performed on the basis of two projections acquired with dif-ferent pre-sample mask positions at each CT angle [2, 11]. Assuming a parallel beam, this retrieval requires a 180° rota-tion of the sample for a complete CT dataset. Let us assume instead that only one projection is acquired at each CT angle (with the pre-sample mask positioned at xm1, for example), but
that the rotation is performed over 360°. Let us consider two projections acquired with a 180° rotation offset between them, with the rotation axis located at x = 0:
( ) ( ) ⎜⎛ ( )⎟ ⎝ ⎞⎠ θ = θ ⋅ + α θ P Mx C x z x M , eA x , m , 1 3 (4) ( ) ( ) ⎜⎛ ( )⎟ ⎝ ⎞⎠ θ π+ = θ π+ ⋅ + α θ π+ P Mx C x z x M , eA x , . m , 1 3 (5) Here, y=const. has been assumed. As rotating the sample by 180° does not change the total amount of attenuation, we can write A x( ,θ π+ )=A(−x,θ). The same holds for the refrac-tion angle; however, since the refracrefrac-tion angle is a direcrefrac-tional quantity, its sign changes:
( ) ( { } { } { } { }) ( ) ( ) ( ) ( )
∫
∫
∫
α θ π δ θ π θ π θ π θ π δ θ θ θ θ δ θ θ θ θ α θ + = ∂ ∂ + − + + + + = ∂ ∂ − + − − = − ∂ ∂ − − + − − = − − x x x z x z z x x z x z z x x z x z z x, cos sin , sin
cos d
cos sin , sin cos d
cos sin , sin cos d
, . (6)
Equation (6) is the so-called reverse projection relation [21]. The above enables equation (5) to be rewritten as:
( ) ( ) ⎜⎛ ( )⎟ ⎝ ⎞⎠ θ π α θ − + = θ ⋅ − P Mx C x z x M , eA x , . m , 1 3 (7) Dividing the left and right hand side terms of equations (4) and (7), i.e. the projections acquired with a rotation offset of 180 degrees between them, yields:
( ) ( ) (( ( )/ )( )/ ) θ θ π α θ α θ − + = + − P Mx P Mx C x z x M C x z x M , , , , . m m 1 3 1 3 (8)
This can be expressed as:
( ) ( ) ( ( )) θ θ π α θ − + = P Mx P Mx F x , , , , (9) where: ( )α (( α/ )/ ) α = + − F C x z M C x z M : m m 1 3 1 3 (10) is a function that can be calculated from the illumination curve (C), the position of the pre-sample mask (xm1), the
sample-to-detector distance (z3) and the magnification (M). The
refrac-tion angle α( )x,θ can now be extracted by applying the inverse of F to the ratio of the projections:
( ) ⎛⎝⎜ ( ( ) )⎞⎠⎟ α θ θ θ π = − + − x F P Mx P Mx , , , . 1 (11) It should be noted that for the calculation of F and its inverse no linear approximation of the illumination curve is required, allowing relatively large refraction angles to be retrieved (typ-ically up to tens of μrad). Moreover, equation (11) tolerates non-uniformities of the pre-sample and detector masks as the function F can be calculated on a pixel-by-pixel basis. The retrieval of α( )x,θ is only constrained by the fact that F has to be restricted to its injective part (i.e. where it describes a one-to-one mapping) [11].
Following the extraction of the refraction angle, the attenu-ation can be retrieved via:
( ) ( ) ( ( )/ ) ⎛ ⎝⎜ ⎞ ⎠⎟ θ θ α θ = + A x P Mx C x z x M , ln , , . m1 3 (12) The application of equations (11) and (12) to projections acquired over 360° yields sinograms like those described by equations (2) and (3), which enable the reconstruction of tomograms of kβ and δ.
The reverse projection relation holds for parallel beam geometries only, a criterion which is either satisfied at syn-chrotrons or when the fan angle produced by conventional x-ray sources is sufficiently small (i.e. when the distortion introduced by the fan is smaller than or of the same order as the spatial resolution of the imaging system). A generalization of the reverse projection relation to fan beam geometries is suggested in [19].
2.2. Sampling and alignment of the experimental setup In the above equations, the x-coordinate was assumed to be a continuous variable. However, in practice, projections are sampled at discrete locations x0, ...,xn. If no additional sample movement is applied except rotation, the sampling step in the projections is given by the period of the pre-sample mask ( p ), i.e. xk=x0+kp. This can be artificially increased through
‘dithering’; during this procedure, the sample is displaced multiple times by a fraction of p, projections are acquired at each displacement, and then combined into a single projec-tion that features a higher sampling rate [4, 10]. In the context of reverse projection retrieval, it is important to note that the extraction of A x( ),θ and α( )x,θ via equations (11) and (12)
C K Hagen et al
4
is only accurate if projections acquired with a 180° offset between them are sampled at the same locations xk. This is the
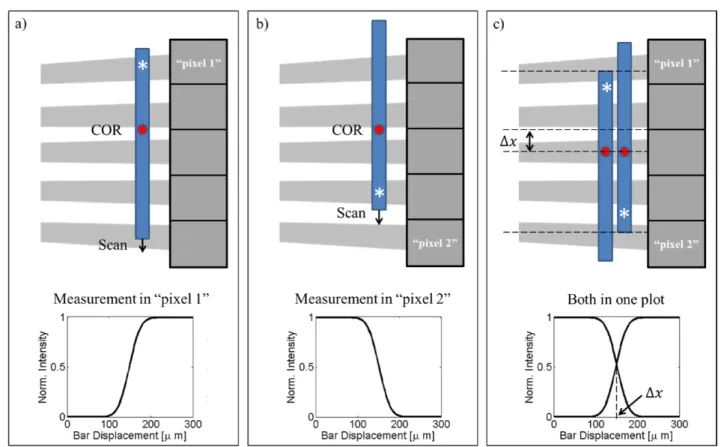
case when the centre of rotation (COR) of the sample stage is aligned with the centre of one of the beamlets. If such align-ment is not realized, data sampled at different locations are combined, resulting in a loss of accuracy in the retrieved atten-uation and refraction images. In the following, we present a simple procedure for the alignment of the COR of the sample stage with the centre of one of the beamlets. The procedure is schematically illustrated in figures 2(a)–(c).
(a) The pre-sample mask is placed at xm1 and the detector
mask is removed from the setup, such that the beam-lets impinge directly on the detector pixels. A highly absorbing bar is mounted on the sample stage. A single detector pixel (‘pixel 1’) that lies in the vicinity of the bar edge marked by the white asterisk, is selected. The bar is then scanned in sub-pixel steps until its edge has gone across all of ‘pixel 1’. The intensity measured in ‘pixel 1’
is plotted (figure 2(a)).
(b) The bar is moved back to its original position, and then the sample stage is rotated by 180° (note that the sketches in figure 2 are not to scale and that the sample stage can be rotated without the bar colliding with the detector in the real setup). A second detector pixel (‘pixel 2’) in the vicinity of the bar edge marked by the white asterisk, which now is in a different position, is selected. Importantly, ‘pixel 2’
must be selected such that it is separated from ‘pixel 1’ by an odd number of pixels. The bar is scanned again with sub-pixel steps until its edge crosses ‘pixel 2’. Again, the intensity curve is plotted (figure 2(b)).
(c) The bar displacement (∆x) which yields the same meas-ured intensity in ‘pixel 1’ and ‘pixel 2’ before and after the 180° rotation of the sample stage is the one for which the COR is located in the centre of one of the beamlets (figure 2(c)). The sample stage is displaced by ∆x from its original position, which completes the alignment.
2.3. Experimental setup
All experiments were performed with a Rigaku MicroMax 007 HF rotating anode (molybdenum) x-ray tube (Rigaku Corporation, Japan) operated at 40 kV and 25 mA. Previous work has shown that all spectral energies contribute to an EI projection, with the strongest contribution from the Mo K-alpha peak (around 17 keV) [8, 12]. The source’s focal spot size was measured to be approximately 70 μm (full width at half maximum). The Hamamatsu C9732DK flat panel (Hamamatsu, Japan), a passive-pixel CMOS sensor with a pixel size of 50×50 mµ 2, was used as detector. The dis-tances between source and pre-sample mask (z1), pre-sample
mask and sample (z2), and sample and detector (z3) were 1.6,
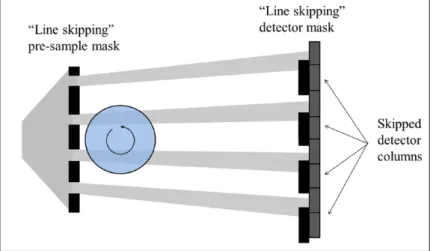
0.05 and 0.35 m, respectively. Both masks were fabricated by electroplating gold strips onto a graphite substrate (Creatv Microtech Inc., Potomac, MD). The masks’ periods were 79 μm (pre-sample mask) and 98 μm (detector mask), with apertures of 10 μm and 17 μm, respectively. In this setup, the detector mask apertures approximately match the source size projected onto the detector plane, but in general other aperture widths are also possible. With this mask design, only every
Figure 2. Schematic illustrating the alignment of the centre of rotation of the sample stage with the centre of one of the beamlets (not to scale).
other detector column is used for the acquisition (figure 3). This ‘line skipping’ configuration reduces the negative effect of pixel cross-talk on EI data [10]. Skipping every other detector column does not affect the intrinsic spatial resolution of the imaging system, but reduces the spatial sampling rate of the projections, which, if not compensated by dithering, can cause a reduced spatial resolution in the reconstructed tomo-grams. The position of the pre-sample mask (xm1) was chosen
such that 50% of each beamlet fell on a pixel and 50% on an absorbing septum of the detector mask.
3. Results
3.1. Centre of rotation alignment
Before imaging, the COR of the sample stage was aligned with the centre of one of the beamlets according to the proce-dure described above. Figure 4 shows the intensity curves that were measured by two selected detector pixels (‘pixel 1’ and
‘pixel 2’) while scanning an absorbing bar through the setup before and after the sample stage was rotated by 180°. Since the bar did not have a perfect edge, the measured intensity
curves have a different shape compared to the ones sketched in figure 2. The displacement for which the two curves over-lapped (∆x) was extracted and the sample stage was moved by this amount from its original position. Note that the step with which the bar is scanned ultimately determines the precision of the alignment. In this case, the bar was scanned with 0.5 μm steps, implying an alignment precision of 5% with respect to the spatial resolution of the imaging system (10 μm). As was shown by Diemoz et al (2014), when implemented with conventional x-ray sources, the spatial resolution of an EI imaging system is given by the smaller of the pre-sample mask aperture (in this case 10 μm) and the projected source size scaled to the sample plane (i.e. the penumbra-effect, in this case approximately 14 μm) [4].
3.2. Proof-of-principle scan
To obtain a proof-of-principle for the validity of the reverse projection approach, a chicken bone surrounded by adjacent soft tissue was scanned. The ‘fresh’ specimen (not fixed in for-malin) was placed in a plastic cylinder of approximately 8 mm diameter. This sample size justifies the assumption of a par-allel beam, since the distortion introduced by the fan beam is
Figure 3. Schematic showing EI x-ray phase contrast CT setup in ‘line skipping’ configuration.
Figure 4. Intensity curves measured by ‘pixel 1’ and ‘pixel 2’ during the alignment of the centre of rotation of the sample stage with the centre of one of the beamlets.
Figure 5. The function F, which is calculated from the illumination curve and used for the retrieval of the refraction angle α( )x,θ. The injective part of F is indicated by the thicker line.
C K Hagen et al
6
below 10 μm (according to geometrical arguments), matching the spatial resolution of the imaging system. Projections were acquired in both reverse projection (with a 360° rotation, in one illumination configuration) and conventional EI mode (with a 180° rotation, in two opposite illumination configura-tions). In both cases, the rotation was performed in a stepped manner with an angular step of 0.5°. The integration time per projection was 3 s. In order to increase the spatial sampling rate, dithering was performed by displacing the sample 8
times by an 8th of the pre-sample mask period at each CT angle. Projections were corrected for flat field inhomogene-ities and dark current before being processed according to equations (11) and (12) (reverse projection retrieval), and according to [2] (conventional retrieval). Attenuation and phase tomograms were reconstructed with FBP with the ramp and Hilbert filters, respectively.
Figure 5 shows the function F, which was calculated from the illumination curve and which relates the ratio of two
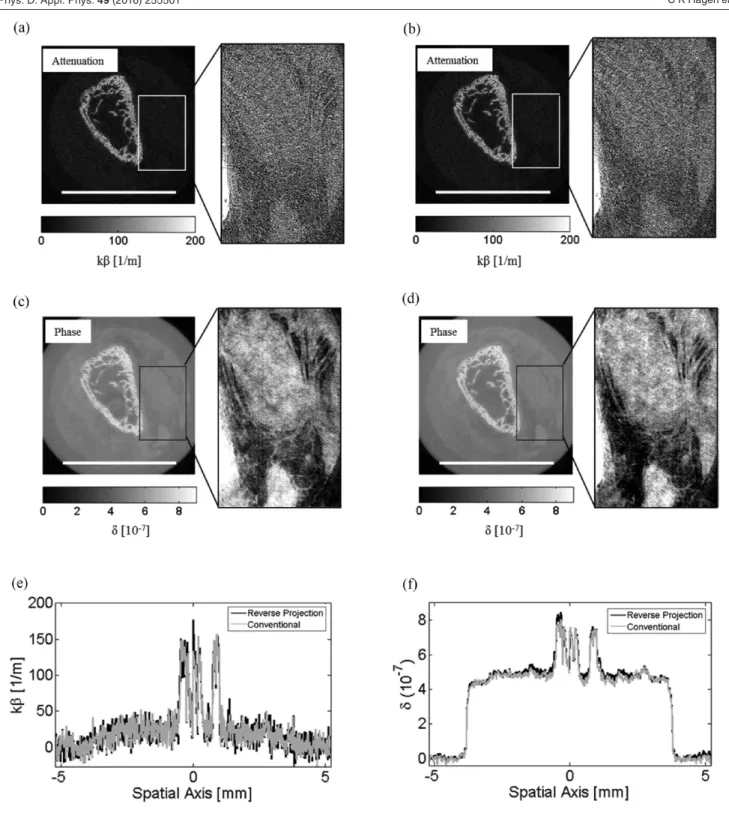
Figure 6. Attenuation (top row) and phase (middle row) tomograms of a chicken bone sample obtained with reverse projection ((a), (c)) and conventional EI retrieval ((b), (d)). Scale bars indicate 5 mm. Profiles extracted along the central horizontal lines in the respective tomograms (bottom row). (a) Reverse projection. (b) Conventional. (c) Reverse projection. (d) Conventional. (e) Horizontal profiles (attenuation). (f) Horizontal profiles (phase).
projections acquired with a 180° offset to the refraction angle. Its non-symmetric behavior is due to it being defined as the ratio of two shifted versions of the illumination curve that can be well-approximated by a Gaussian function (see figure 1(b)). F takes on the value 1 for α=0 since the input to it is the the ratio of two projections (P Mx( ,θ)/ (P Mx,θ π+ )) that are identical if no refraction occurs. The injective part of F, which allows a unique retrieval of α, is indicated by the thicker line. This shows that, for the used experimental setup, a range of up to 100 μrad can be retrieved, although this range may be smaller for noisy data.
The reconstructed attenuation and phase tomograms, as well as extracted line profiles, are shown in figure 6. Generally, it can be seen that the phase tomograms (middle row) clearly show the soft tissue surrounding the bone. Conversely, the soft tissue is hardly visible in the attenuation tomograms (top row). This is not the result of inadequate grey value windowing in the presence of a strong attenuator (bone), but is due to the fact that the weak soft tissue contrast is hidden in the noise floor, as apparent in the line profiles and the zoomed insets where the contrast is stretched. These results confirm the superiority
of phase over attenuation contrast for weakly attenuating specimens. With respect to the used retrieval methods, it can be appreciated that reverse projection (figures 6(a) and (c)) and conventional EI retrieval (figures 6(b) and (d)) yield matching results for both attenuation and phase, as the strong phase-based soft tissue contrast can be equally appreciated in both cases. This is also confirmed by the corresp onding line profiles.
3.3. Continuous scan
One advantage of reverse projection over conventional EI retrieval is that it removes the necessity to stop the sample rotation at every CT angle, thus allowing continuous scans. To demonstrate that the reverse projection retrieval in com-bination with a continuous rotation yields accurate results, a custom-built phantom consisting of three plastic tubes (diameter: approx. 3 mm) filled with olive oil, water and air was scanned. The total phantom diameter was approximately 8 mm, again justifying the use of the parallel beam approx-imation. First, a reverse projection scan was performed (over
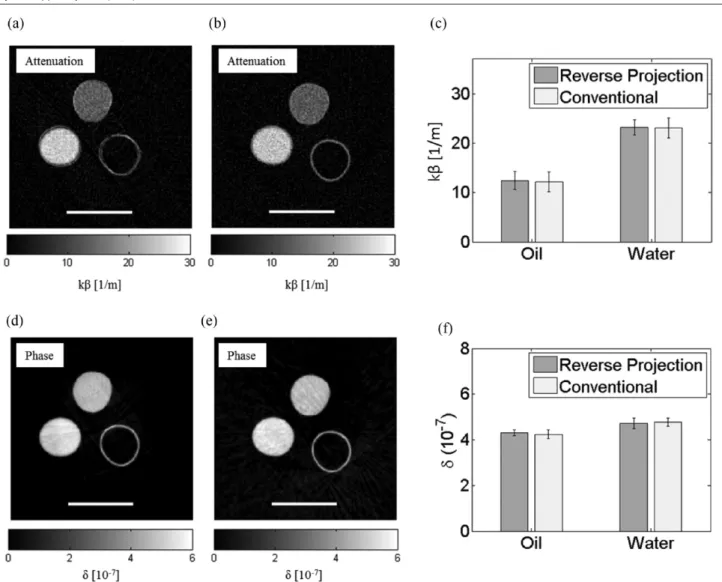
Figure 7. Attenuation (top row) and phase (bottom row) tomograms of a custom-built phantom obtained with continuous rotation reverse projection ((a), (d)) and stepped rotation conventional ((b), (e)) EI retrieval. Scale bars indicate 5 mm. Extracted effective kβ- and δ-values for oil and water ((c), (f)). (a) Reverse projection. (b) Conventional. (c) Extracted kβ-values. (d) Reverse projection. (e) Conventional. (f) Extracted δ-values.
C K Hagen et al
8
360°, one illumination configuration), while rotating the sample continuously with a speed of 0.25° per s, and with a detector integration time of 3 s per projection. Taking into account the time needed for detector read-out (1 s, in the used configuration of the detector), this corresponded to a 1° angular increment between projections. The rotation was briefly paused after the first half scan in order to avoid a pos-sible mismatch between projections with a 180° offset caused by a non-uniform motor speed during acceleration. Pausing the scan after the first 180° means that exactly the same ini-tial acceleration applies to both complementary halves of the scan. Projections were flat-fielded and dark current cor-rected, and processed according to equations (11) and (12). Attenuation and phase tomograms were reconstructed via FBP with a ramp and a Hilbert filter, respectively. For com-parison, the phantom was also scanned in conventional EI mode (over 180°, in two illumination configurations) with a stepped rotation, an angular step of 1° and 3 s integration time per step, attenuation and refraction projections were retrieved according to [2], and tomograms were reconstructed via FBP with a ramp and a Hilbert filter, respectively.
Figures 7(a)–(d) show the attenuation and phase tomograms of the phantom obtained from the reverse projection and con-ventional EI scans. Visually, the images are very similar. For a quantitative comparison, the reconstructed values inside the water and oil-filled tubes (left and top cylinders, respectively) were averaged over the central 15×15 pixels within the tubes. The results are shown in figures 7(e) and (f). Error bars repre-sent one standard deviation of the averaged pixel values. A good quantitative match between reverse projection and conventional EI scans can be seen for both attenuation and phase, proving the validity of the reverse projection approach when combined with a continuous sample rotation. Since a polychromatic x-ray beam was used, the reconstructed values correspond to effective energies that are determined by the sample material, the source spectrum and the spectral characteristics of the masks and the detector [12]. Although a comparison with theoretical values was not performed in this case, it has already been proven that, provided effective energies are correctly calculated according to the model by Munro and Olivo (2013), EI-based x-ray phase contrast CT yields reconstructed values which are in agreement with theoretical ones (see supplementary material of [9]). 4. Discussion and conclusion
An alternative method for the retrieval of attenuation and refraction data from EI x-ray phase contrast CT scans, based on the reverse projection relation [21], was presented. Besides providing the necessary theory, it was highlighted that a spe-cific alignment of the COR of the sample stage with the centre of one of the beamlets created by the pre-sample mask is essen-tial in order to realize this experimentally. A simple alignment procedure that allows this was described. Moreover, it was demonstrated that reverse projection retrieval yields results fully compatible with those obtained through the previously used, conventional EI retrieval, both in terms of soft tissue contrast and quantitative accuracy.
The main advantage of reverse projection over conven-tional EI retrieval is that the acquisition is simplified and less prone to motor-induced misalignment. Moreover, the requirement to stop the sample rotation in order to acquire projections in opposite illumination configurations is elimi-nated; hence, the reverse projection approach allows rotating the sample continuously. With a continuous rotation, scan time is determined by a combination of the desired angular increment, integration time per projection and detector read-out time, but it is no longer affected by additional movements of the pre-sample mask motor. Therefore, in the commonly encountered situation where the detector read-out is shorter than the time it takes to displace the pre-sample mask from xm1
to xm2, this leads to faster acquisitions. Generally speaking,
scan time could be further reduced if reverse projection scans were performed with upgraded experimental equipment, i.e. with a more powerful x-ray tube providing higher flux, and a detector featuring a higher frame rate, detection efficiency and noise performance. Upgrades in this sense are currently underway in our lab through the installation of a W target (instead of Mo) Rigaku Source, combined with the Pixirad single photon counting, direct conversion detector [7, 8]. With the current experimental setup, the continuous rota-tion reverse projecrota-tion scan of the cylinder phantom reported above took 25 min, but we envisage that such an upgraded system will allow approximately halving the acquisition times, although it remains to be seen how the energy spec-trum of the W source affects image quality in comparison to that of the Mo source.
As presented in this manuscript, reverse projection retrieval only holds for parallel or almost parallel beams, and therefore it is only applicable to samples of a few mm when an x-ray tube is used. An extension to fan beams has been suggested for grating-based x-ray phase contrast CT in [19], which could possibly be extended to EI-based x-ray phase contrast CT as part of future work. It should also be noted that reverse projec-tion retrieval in combinaprojec-tion with continuous sample rotaprojec-tion is not compatible with dithering (the procedure to artificially increase the sampling rate of the projections), although new sampling schemes will be explored in the future to allow dith-ering to be included. For example, the sample could be rotated over 720° with a single, half-pixel lateral step after the first 360°, and so forth for ‘denser’ spatial sampling. While this could be considered a downside when imaging samples that contain very small details, for many ‘real life’ applications the non-dithered sampling rate may be sufficiently high. For example, in the experimental setup described above, the non-dithered sampling rate is 1 data point per 79 μm. A second drawback of the approach is that a continuous rotation intro-duces a degree of blur to the tomograms. In fact, the recon-structed tomograms show the object functions (δ, kβ) with a
‘spin blur’ caused by the rotation of the sample by the angular increment ∆θ. However, this can be reduced by changing this parameter: the smaller ∆θ, the smaller the blur. Another option to quantify the introduced blur is to adapt the concept of ‘dynamic bias’, which is often used within the fluid-flow community [17].
Acknowledgments
This work was supported by the UK Engineering and Physical Sciences Research Council (Grant Nos. EP/L001381/1 and EP/I021884/1). PCD and ME are supported by Marie Curie Career Integration Grant Nos. PCIG12-GA-2012-333990 and PCIG12-GA-2012-334056 within the Seventh Framework Programme of the European Union.
References
[1] Bravin A, Coan P and Suortti P 2013 X-ray phase-contrast imaging: from pre-clinical applications towards clinics
Phys. Med. Biol.58 R1–35
[2] Diemoz P C, Endrizzi M, Zapata C E, Pesic Z D, Rau C, Bravin A, Robinson I K and Olivo A 2013 X-ray phase-contrast imaging with nanoradian angular resolution
Phys. Rev. Lett.110 138105
[3] Diemoz P C, Hagen C K, Endrizzi M and Olivo A 2013 Sensitivity of laboratory based implementations of edge illumination x-ray phase-contrast imaging Appl. Phys. Lett.
103 244104
[4] Diemoz P C, Vittoria F A and Olivo A 2014 Spatial resolution of edge illumination x-ray phase contrast imaging
Opt. Express22 15514–29
[5] Endrizzi M and Olivo A 2014 Absorption, refraction and scattering retrieval with an edge-illumination-based imaging setup J. Phys. D: Appl. Phys.
47 505102
[6] Endrizzi M, Diemoz P C, Millard T P, Jones J L, Speller R D, Robinson I K and Olivo A 2014 Hard x-ray dark-field imaging with incoherent sample illumination Appl. Phys.
Lett.104 024106
[7] Endrizzi M et al 2014 Edge-illumination x-ray phase contrast imaging: matching the imaging method to the detector technology J. Instrum. 9 C11004
[8] Endrizzi M, Vittoria F A, Kallon G, Basta D, Diemoz P C, Vincenzi A, Delogu P, Bellazzini R and Olivo A 2015 Achromatic approach to phase-based multi-modal imaging with conventional sources Opt. Express
23 16473–80
[9] Hagen C K, Munro P R T, Endrizzi M, Diemoz P C and Olivo A 2014 Low-dose phase contrast tomography with conventional x-ray sources Med. Phys. 41 070701 [10] Ignatyev K, Munro P R T, Speller R D and Olivo A 2011
Effects of signal diffusion on x-ray phase contrast images
Rev. Sci. Instrum.82 073702
[11] Munro P R T, Hagen C K, Szafraniec M B and Olivo A 2013 A simplified approach to coded aperture x-ray phase imaging Opt. Express 21 11187–201
[12] Munro P R T and Olivo A 2013 X-ray phase-contrast imaging with polychromatic sources and the concept of effective energy Phys. Rev. A 87 053838
[13] Noo F, Clackdoyle R and Pack J D 2004 A two-step Hilbert transform method for 2D image reconstruction Phys. Med.
Biol.49 3903–23
[14] Olivo A et al 2001 An innovative digital imaging set-up allowing a low-dose approach to phase contrast applications in the medical field Med. Phys. 28 1610–9
[15] Olivo A and Speller R 2007 A coded-aperture technique allowing x-ray phase contrast imaging with conventional sources Appl. Phys. Lett. 91 074106
[16] Olivo A and Speller R 2007 Modelling of a novel x-ray phase contrast imaging technique based on coded apertures
Phys. Med. Biol.52 6555–73
[17] Shakya S, Munshi P, Behling M, Luke A and Mewes D 2014 Analysis of dynamic bias error in x-ray tomographic reconstructions of a three-phase flow system Int. J. Multiph.
Flow58 57–71
[18] Wilkins S W, Nesterets Y A, Gureyev T E, Mayo S C, Pogany A and Stevenson A W 2014 2010 On the evolution and relative merits of hard x-ray phase contrast imaging methods Phil. Trans. R. Soc. A 372 1–19
[19] Wu Z, Gao G, Wang Z, Ge X, Chen J, Wang D, Pan Z, Zhang K, Zhu P and Wu Z 2013 A new method to retrieve phase information for equiangular fan beam differential phase contrast tomography Med. Phys. 40 031911 [20] Wu Z, Gao K, Chen J, Wang D, Wang S, Chen H, Bao Y,
Shao Q, Wang Z, Zhang K, Zhu P and Wu Z 2015 High sensitivity phase retrieval method in grating-based x-ray phase contrast imaging Med. Phys. 42 741–9
[21] Zhu P, Zhang K, Wang Z, Lui Y, Liu X, Wu Z, McDonald S A, Marone F and Stampanoni M 2010 Low-dose, simple, and fast grating-based x-ray phase-contrast imaging Proc. Natl