Delaware’s Energy Efficiency Potential and Program
Scenarios to Meet Its Energy Efficiency Resource Standard
prepared for the
Office of the Secretary
Department of Natural Resources and Environmental Control
State of Delaware
University of Delaware
May 2011
Mailing Address:
John Byrne Director
Center for Energy and Environmental Policy University of Delaware Newark, DE 19716-7381 Email: [email protected] Telephone: (302) 831-8405 Telefax: (302) 831-3098 Website: http://ceep.udel.edu
The Center for Energy and Environmental Policy conducts interdisciplinary and collaborative research and supports graduate instruction in energy, environmental, and sustainable development policy. The Center serves as a University-wide forum for the discussion and dissemination of faculty, staff, and graduate student research in these areas. In addition to its research and instructional activities, the Center also provides technical assistance to community, state, federal and international agencies and nonprofit organizations. The Center is composed of an internationally diverse faculty, professional staff, and graduate student body with backgrounds in a variety of disciplines including political science, economics, sociology, geography,
philosophy, urban planning, environmental studies, history, and engineering. Research programs currently organized in the Center include comparative energy and environmental policy, sustainable development, political economy of energy, environment and development, environmental justice, conservation and renewable energy options, integrated resource planning, and technology environment and society. Graduate areas of specialization in energy and environmental policy are supported at the master’s and doctoral levels.
Delaware’s Energy Efficiency Potential and Program
Scenarios to Meet Its Energy Efficiency Resource Standard
prepared for the
Office of the Secretary
Department of Natural Resources and Environmental Control
State of Delaware
R
ESEARCHT
EAMJohn Byrne (Ph.D., Distinguished Professor of Energy and Climate Policy, Director of CEEP) Lado Kurdgelashvili (Ph.D., CEEP Policy Fellow)
Jeremiah Couey (CEEP Ph.D. Candidate) Zachary Schafer (CEEP Master’s Candidate)
University of Delaware
May 2011
i
T
ABLE OFC
ONTENTS1 Introduction ... 1
1.1 Delaware’s Historical Energy Use and Growth Rates ... 2
2 Methodology ... 5
3 Scenarios ... 7
4 Baseline and Economic Potential ... 9
4.1 Establishing a Baseline ... 9
4.2 Technical Potential... 11
4.3 End-Use Sector Baseline and Economic Potential ... 12
4.3.1 Residential Energy Use and Economic Savings Potential ... 13
4.3.2 Commercial Energy Use and Economic Savings Potential ... 19
4.3.3 Industrial Energy End Use and Economic Savings Potential ... 25
4.3.4 Additional Energy Savings Potential for Delaware ... 32
4.4 Program Potential of Energy Savings from Efficiency Measures ... 34
4.4.1 Residential Potential (TI) ... 39
4.4.2 Commercial Potential (TI) ... 41
4.4.3 Industrial Potential (TI and Other Programs Only) ... 43
4.5 Energy Savings Potential: an SEU Framework of Green Financing (GF) ... 45
4.5.1 SEU Green Financing: Performance Contracting and Guaranteed Savings ... 46
4.5.2 Savings Potential of an SEU Administered GF Program ... 48
5 Demand Reduction Potential ... 55
6 Employment Benefits of EERS Implementation ... 59
7 Environmental Benefits of EERS Implementation ... 61
7.1 Avoided Carbon Dioxide Emissions from Target Implementation ... 61
8 Performance Comparison with Other State EE Programs ... 65
9 Summary of Program Potential: Electricity & Natural Gas ... 71
10 Conclusion ... 75
References ... 77
Appendix A: Residential Electrical & Natural Gas Savings Measures ... 81
Appendix B: Commercial Electrical & Natural Gas Savings Measures ... 85
Appendix C: Industrial Electrical & Natural Gas Savings Measures ... 87
Appendix D: EERS Target Scenarios Excluding Third Party Supply ... 89
ii
List of Figures
Figure 1. Electricity Consumption in Delaware by Providers 1990-2008 ... 3
Figure 2. Natural Gas Consumption in Delaware by Providers 2000-2008 ... 4
Figure 3. Implementation Scenarios ... 5
Figure 4. Aggregate Electricity Sales and Target Projections (Base Year 2007) ... 9
Figure 5. Aggregate Natural Gas Sales and Target Projections (Base Year 2007) ... 10
Figure 6. Residential Electricity Consumption by End Use ... 14
Figure 7. Residential Electricity-Economic Efficiency Potential by End-Use ... 16
Figure 8. Residential Natural Gas Consumption by End Use ... 17
Figure 9. Residential Natural Gas-Economic Efficiency Potential by End-Use ... 19
Figure 10. Commercial Electricity Consumption by End-Use ... 20
Figure 11. Commercial Electricity-Economic Efficiency Potential by End-Use ... 22
Figure 12. Commercial Natural Gas Consumption by End Use ... 23
Figure 13. Commercial Natural Gas Economic Efficiency Potential By End-use ... 24
Figure 14. Weighted Average of Total DE Industrial Electricity End-Uses ... 25
Figure 15. Industrial Electricity-Economic Efficiency Potential by End-Use ... 27
Figure 16. Industrial Natural Gas Consumption by End-use ... 30
Figure 17. Industrial Natural Gas-Economic Efficiency Potential by End-use ... 31
Figure 18. Breakdown of Project Cost Components ... 34
Figure 19. SEU Green Energy Saving Bonds (GESBs) ... 47
iii
List of Tables
Table 1. Calculated 2007 Energy Use and Historical Growth Rates 1990-2008 ... 2
Table 2. Scenario Definitions ... 7
Table 3. Technical Potential for Delaware Electricity & Natural Gas Efficiency Savings ... 11
Table 4. Residential Electricity-Economic Efficiency Potential and Costs by End-Use ... 15
Table 5. Residential Natural Gas-Economic Efficiency Potential and Costs by End-Use ... 18
Table 6. Commercial Sector Electricity Intensity (kWh per SF) ... 21
Table 7. Commercial Electricity Economic Efficiency Potential & End-Use Costs ... 22
Table 8. Commercial Natural Gas-Economic Efficiency Potential End-use & Costs ... 24
Table 9. Delaware 2007 Electricity Consumption by Industry ... 26
Table 10. Economic Potential of Industrial Sector Electricity Savings & Costs by End-Use ... 28
Table 11. Industrial Natural Gas Consumption by Type of Industry ... 29
Table 12. Economic Potential of Industrial Sector Natural Gas Savings & Costs by End-Use ... 31
Table 13. Comparison CHP Potential for MD & PA... 33
Table 14. Economic Potential for Delaware Electricity & Natural Gas Efficiency Savings ... 33
Table 15. Program Types and Costs ... 34
Table 16. Efficiency Potential per Year and Participation Rates ... 37
Table 17. Total Electricity Savings and Program Costs: All Sectors using TI approach ... 38
Table 18. Total Natural Gas Savings and Program Costs: All Sectors using TI approach... 39
Table 19. Meeting EERS Electricity Targets: Residential Sector TI Programs Savings ... 40
Table 20. Meeting EERS Natural Gas Targets: Residential Sector TI Programs Savings ... 41
Table 21. Meeting EERS Electricity Targets: Commercial Sector TI Programs Savings ... 42
Table 22. Meeting EERS Natural Gas Targets: Commercial Sector TI Programs Savings ... 42
Table 23. Meeting EERS Electricity Targets: Industrial Sector TI Programs Savings ... 44
Table 24. Meeting EERS Natural Gas Targets: Industrial Sector TI Programs Savings ... 45
Table 25. Meeting EERS Electricity Targets: GF Approach for Public, Non-Profit & Commercial Buildings ... 50
Table 26. Meeting EERS Natural Gas Targets: GF Approach for Public, Non-Profit & Commercial Buildings ... 51
Table 27. Meeting EERS Electricity Targets: GF Approach for Industrial Facilities ... 52
Table 28. Meeting EERS Natural Gas Targets: GF Approach for Industrial Facilities ... 53
Table 29. Observed Demand Savings by 13 Utility Efficiency Programs ... 57
Table 30. Demand Savings under Green Target Scenario ... 58
Table 31. Combined Jobs Impact from Energy Efficiency Scenarios ... 59
Table 32. Scenario Carbon Dioxide Emissions Savings: Electricity and Natural Gas ... 63
Table 33. Electricity Efficiency Program Savings and Spending in 14 Leading States ... 66
Table 34. Electricity Efficiency Program Savings by 14 Leading Utilities ... 67
Table 35. Share of Residential Electricity Savings by Principal End-use Technology ... 68
Table 36. Share of C&I Electricity Savings by Principal End-use Technology ... 68
Table 37. Natural Gas Efficiency Program Savings and Spending in Ten States ... 69
Table 38. Natural Gas Cost Saved & Savings Potential Comparison... 69
Table 39. Summary of Electricity Savings, Demand Savings, and CO2 Emissions Reductions .. 71
Table 40. Summary of Natural Gas Savings and Associated CO2 Emissions Reductions ... 72
Table 41. Summary of Electricity & Natural Gas Program Costs, Economic Savings, and Jobs Created ... 73
iv
A
BBREVIATIONSACEEE: American Council for an Energy-Efficient Economy billion cf: billion cubic feet, herein with regards to natural gas BAU: business as usual
CEEP: Center for Energy & Environmental Policy, University of Delaware CHP: combined heat and power
DEC: Delaware Electric Cooperative
DEMEC: Delaware Municipal Electric Corporation
DNREC: Department of Natural Resources and Environmental Control DOE: U.S. Department of Energy
DP&L: Delmarva Power & Light Company EE: energy efficiency
EERS: Energy Efficiency Resource Standard EIA: U.S. Energy Information Administration EPA: U.S. Environmental Protection Agency
GF: Green Financed approach for energy efficiency program implementation GWh: gigawatt hours, energy unit for electricity
kWh: kilowatt hour, energy unit for electricity LCOE: levelized cost of electricity
MMCF: million cubic feet of natural gas; MCF: thousand cubic feet
MUSH: municipal & state governments, universities and colleges, K-12 schools, and hospitals
MW: megawatts, power unit for electricity MWh: megawatt hour, energy unit for electricity NG: natural gas
SEU: Sustainable Energy Utility, Delaware’s sustainable energy services and renewable energy administration framework
SB 106: Delaware Senate Bill 106, establishes a policy framework for an EERS tMTCO2: thousand metric tons of carbon dioxide, a greenhouse gas
v
E
XECUTIVES
UMMARYThe 2009 enactment of Senate Bill (SB) 106 by the Delaware General Assembly created an Energy Efficiency Resource Standard (EERS), a least-cost energy efficiency policy mechanism requiring electricity and natural gas savings throughout the State. The legislation mandates a 15% reduction in Delaware electricity consumption and a 10% reduction in natural gas
consumption by 2015, relative to 2007 levels of energy use. The passage of the policy, in concert with a proven record of leadership in renewable energy and innovation in the provision of
sustainable energy services, establishes Delaware as an aggressive leader among states in achieving a cost-effective, secure, and environmentally responsible energy future.
This report presents the findings from research conducted by the Center for Energy & Environmental Policy (CEEP) for the Department of Natural Resources and Environmental Control (DNREC), evaluating EERS reduction targets and strategies to meet SB 106 program goals for energy savings.
The study estimates the technical, economic, and program potential for energy savings within the parameters established by SB 106.1 CEEP researchers, in consultation with the Office of the Secretary of DNREC, considered three implementation scenarios (Green, Blue, and Red) to achieve energy savings targets established by SB 106.2 CEEP’s analysis concludes that meeting the electricity and natural gas reduction targets legislated in SB 106 within the specified 5-year time-frame could require exceptionally high consumer participation rates previously unobserved in even the most aggressive state energy efficiency programs. However, if the most moderate implementation scenario, the Green Target3 (see Table 2, p. 6) is adopted, the EERS would have broad and deep impact on energy and financial savings, spur economic growth and job creation, and result in a significant reduction in emissions of greenhouse gases.
1 See Section 2 of the report for a detailed description of report methodology. 2
See Table 2, p. 6, for complete definitions of implementation scenarios. Empirical comparisons with other leading state energy efficiency programs - and their respective participation rates - resulted in CEEP concluding the Red Target is not achievable by 2015 and consequently this target was not included in the analysis of economic or program potential. The Blue Target, while technically and economically achievable, would demand program participation rates greater than 100%, making it impossible to achieve within the 5-year time frame of the EERS. While estimations of its impacts and savings potential have been conducted, these findings are not included in the executive summary.
3
Empirical analysis at CEEP suggests meeting this target would require a cumulative 53% program participation rate (10.6% per year) for electricity reduction and a 67% cumulative participation rate (13.4% per year) for natural gas reduction.
vi Green Target Impacts
To successfully meet the Green Target implementation scenario, Delawareans must reduce the state’s cumulative electricity consumption by 1,780 GWh and natural gas consumption by 3,464 MMCF. For electricity, the implementation of energy efficiency technologies and practices at this scale would have the concurrent impact of reducing peak consumption. Demand reduction for the Green Target scenario, through energy efficiency measures, is estimated to be as high as 392 MW. At this level of reduction, EERS
implementation would positively and materially impact economic growth, energy savings, and the environment. Applying the estimated Green Target savings to forecasted energy prices through 2015, CEEP researchers derived financial savings from avoided electricity costs at $1.9 billion by 2015, and savings from avoided natural gas costs at $546 million. Further economic benefits to the Delaware community will be realized by significant numbers of new jobs created to build the infrastructure and capacity to reach the target. Based on empirical analysis of the impacts of energy efficiency on job growth, CEEP researchers estimate the investment required to reach the Green Target would generate more than 7,000 new jobs in Delaware (see Section 6).
Energy efficiency and conservation, likewise, are the most effective and immediate tools to reduce greenhouse gas emissions in the attempt to curb further climate change. Required Green Target electricity reductions would mitigate between 1.5 and 1.6 million MTCO2 and natural gas reductions would mitigate 189 thousand MTCO2 by 2015.
These significant benefits, however, must be tempered by consideration of the program costs necessary to accelerate participation to meet the target within the 5-year scope of the current legislation. CEEP estimates that cumulative program costs to meet the EERS target for electricity to be $264 and $283 million.4 Program costs to meet the EERS target for natural gas are estimated to be between $73-$78 million. As noted previously, successfully meeting the Green Target within the specified five year time-frame will demand high participation rates that this analysis finds unlikely in the near future and within the context of current market conditions and fiscal constraints. DNREC may wish to consider modifications of the EERS, such as
adjusting the timeframe in which the ambitious 15% target is to be reached.
4
Including both TI and GF programs, but excluding other programs including weatherization, building code, and CHP funding.
vii Leading and Aggressive State Participation Rate Results
CEEP researchers conducted an empirical analysis of existing state energy efficiency programs to determine a more likely, but still aggressive, array of energy savings potential achievable within the five-year scope of the EERS. Based on empirical research and reported participation rates for energy efficiency programs in the 14 leadings states (see Table 33) and the most aggressive state’s energy efficiency program (Vermont), CEEP’s analysis generated likely program implementation scenarios and determined the annual and total target-year (2015) savings achieved through each strategy. Table ES-1 summarizes total estimated potential for electricity and natural gas savings across all sectors, as well as demand savings for electricity. CEEP estimates a likely 2015 electricity program savings potential to be between 797 GWh and 1,190 GWh, corresponding to a target-year electricity savings of between 6.7% and 10.0% below the 2007 baseline. The implementation of these measures would have the additional benefit of reducing peak electricity consumption, and could result in demand savings of between 175 MW and 262 MW. Annual savings for natural gas are estimated to fall between 996 MMCF and 1,750 MMCF, corresponding to a target-year savings of between 2.9% and 5.0% below the 2007 baseline.
Table ES-1 illustrates sector energy savings achieved by the combination of two program sources of energy savings: Traditional Incentives (TI), and a Sustainable Energy Utility administered Green Financing (GF) (see Tables 39-41, p. 71-73 of the report for a complete summary of savings by program type).5,6 The combination of these two approaches and with other existing energy efficiency programs will accelerate the deployment of energy efficiency technologies throughout the state and will develop a sustainable infrastructure and financing mechanism for realizing greater efficiency opportunities beyond the scope of the EERS.
In exploring the potential for energy savings through 2015, CEEP’s analysis also evaluated the savings potential of other energy efficiency programs, including the low-income home weatherization program, new building codes, and opportunities to expand the diffusion of combined heat and power (CHP) technologies. These programs offer additional savings, which
5 For a complete explanation of the components of TI and GF program design, see Table 15, p. 34, and Figure 18, p. 34. Sections 4.4 and 4.5 of the report provide a full evaluation of program savings from both TI and GF strategies. 6
It is noteworthy that Vermont, which has the most aggressive program participation rate in the country, utilizes an SEU-style mechanism, although it has yet to design a GF mechanism like the one available to Delaware’s SEU.
viii
vary by sector, and will, in conjunction with the EERS, be a strong engine for job growth and reductions of greenhouse gas emissions. Some discussion and analysis of these programs are included throughout the report, but neither the costs nor their impacts are included in the EERS, and savings from them should not be counted toward the targets established by SB 106.
Table ES-1: Summary of Implementation Pathway Energy Savings Potential
Annual and Cumulative Energy Savings and Demand Reduction for EERS Implementation Pathways
Estimated Annual Electricity Savings at 2015 EERS Target-Year Leading State Cumulative Participation Rate 15.8% Most Aggressive State Cumulative Participation Rate 30.5% GreenTarget Cumulative Participation Rate=52.6 % Total Annual Residential Savings (GWh)
Total Annual Commercial Savings (GWh) Total Annual Industrial Savings (GWh)
Total Annual Savings Achieved/Required (GWh)
208 + 479 + 110 = 797 401 + 607 + 182 = 1,190 670 648 462 1,780
Green Target-Year % Savings 6.7% 10.0% 15.0%
Annual Demand Savings (MW)
Demand Realized at Target-Savings (MW) 175 MW 262 MW 392 MW
Estimated Annual Natural Gas Savings at 2015 EERS Target-Year Leading State Cumulative Participation Rate 15.0% Most Aggressive State Cumulative Participation Rate 30.8% GreenTarget (Cumulative Participation Rate=66.7%) Total Annual Residential Savings (MMCF)
Total Annual Commercial Savings (MMCF) Total Annual Industrial Savings (MMCF)
Total Annual Savings Achieved/Required (MMCF)
277 + 422 + 297 = 996 570 + 594 + 586 = 1,750 1,000 863 1,601 3,464
Green Target-Year % Savings 2.9% 5.1% 10.0%
To reach the statute’s goal of a reduction of the equivalent of 15% in 2007 electricity sales, CEEP estimates that compliance can be reached between 2018 and 2021 (depending upon
whether the participation rate of Vermont or the 14 most aggressive states in the country is used). For natural gas, CEEP’s estimate of the compliance period is between 2020 and 2027 for a 10% reduction of sales based on 2007 consumption.
Table ES-2 summarizes financial impacts of EERS implementation at the leading-state and aggressive state levels of participation assessed by this report. EERS implementation, resulting in sustained statewide energy efficiency investments, will stimulate job growth throughout
ix
documented and outpace job creation rates of all conventional and even most renewable energy industries, adding well-paying trade and professional positions (see ASES, 2007). Job creation can help to reduce Delaware’s unemployment rate from over 8% currently (U.S. BLS 2010). EERS implementation is estimated to create 2,323-4,045 jobs if participation rates are similar to those experienced by leading states in achieving energy savings (during the five-year timeframe of SB 106; see ASES, 2007 for job creation multipliers). Because the technical and economic potential for energy savings remains considerably higher than savings targeted within the 5-year scope of the EERS, significant opportunities for sustained job growth exist further into the future. More detailed discussion of employment benefits of EERS implementation and the methodology used by CEEP can be found in Section 6 of the report.
The investment in energy efficiency and conservation has an additional economic benefit. Table ES-2 provides estimates of the dollar savings associated with investments at different participation rates for the cumulative 5-year scope of the program. These are more than $1.1 billion to $1.6 billion for electricity-focused investments and $175-$307 million for natural gas-focused investments.7 By lowering the cost of energy use, real incomes in all sectors of the Delaware economy are lifted. Estimated savings over the measure lifetime8 returned to the participants range from nearly $1.255 billion (at an achievable 16% participation rate) to almost $1.937 billion in 2010 dollars (at the most aggressive state participation rate of 30%).9 SEU-assisted Green Finance initiatives can produce a further economic advantage in attracting ongoing private sector investment in Delaware, as tax-exempt and taxable bond buyers can continually direct capital to the state’s economy. In this regard, EERS implementation represents an economic development policy, as well as an energy and environmental policy.
7
Based on likely to aggressive participation rates of 15%-16% and 30%-31%, and a typical measure life of 15 years. 8
In most cases, a fifteen year life expectancy for energy efficiency technologies and improvements is assumed. 9 See Table 41, p. 67.
x
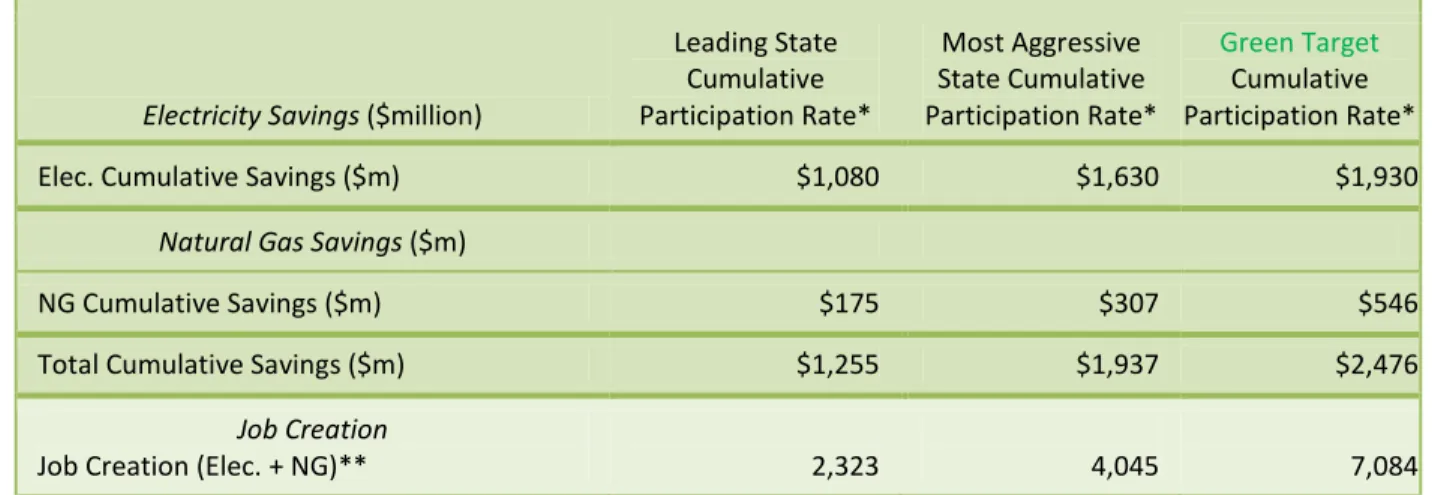
Table ES-2. Summary of EERS Impacts on Financial Energy Savings and Job Growth
Cumulative Program Savings ($million) and Employment Benefits of EERS Implementation Pathways
Electricity Savings ($million)
Leading State Cumulative Participation Rate* Most Aggressive State Cumulative Participation Rate* GreenTarget Cumulative Participation Rate* Elec. Cumulative Savings ($m) $1,080 $1,630 $1,930
Natural Gas Savings ($m)
NG Cumulative Savings ($m) $175 $307 $546 Total Cumulative Savings ($m) $1,255 $1,937 $2,476
Job Creation
Job Creation (Elec. + NG)** 2,323 4,045 7,084
* Participation rates vary for electricity and natural gas, likewise for all sectors. Estimated participation rates utilized are shown in ES1 based on energy savings, whose methodology is described in Section 4.4.
** Estimated jobs created include combined electricity & natural gas programs. All values are estimates for a five-year continuous investment effort.
Table ES-3 summarizes the environmental benefits of EERS implementation. While the environmental impacts of reducing energy consumption are broad and varied, the impact will be a significant reduction in emissions of greenhouse gases that contribute to climate change.
Delaware has made commitments in the past to address its emissions and contributions to climate change that threatens Delaware’s population, economy, shoreline and other ecosystems. Energy efficiency and conservation are the most cost-effective and immediate tools to curtail Delaware’s emissions. Under a best-case scenario, EERS implementation is anticipated to result in a
decrease of 0.7-1.1 million metric tons of carbon dioxide emissions (million MTCO2) from avoided marginal off-peak electricity generation. For similar levels of participation, annual savings of natural gas correspond to a direct reduction of CO2 emissions of 54-95 thousand MTCO2. A comprehensive discussion of the environmental impacts of EERS strategies and implementation can be found in Section 7 of the report.
xi
Table ES-3. Summary of Environmental Impacts of EERS Implementation
Annual Greenhouse Gas Reduction Impacts of EERS Implementation Pathways
Annual Electricity Emissions Reductions** (thousand MTCO2)
Leading State Cumulative Participation
Rate*
Most Aggressive State Cumulative Participation Rate* GreenTarget Cumulative Participation Rate* Marginal Power Gen. On-Peak Emissions Reduced
Marginal Power Gen. Off-Peak Emissions Reduced
Emissions Reductions at Target-Savings: On-Peak Emissions Reductions at Target-Savings: Off-Peak
691
732 1,032 1,092
1,543 1,634
Annual Natural Gas Emissions Reductions** (thousand MTCO2)
Annual CO2 Emissions Reduced
Emissions Reductions at Target-Savings 54 95 189
Total Emissions Reductions at Target Savings
(Off-Peak electricity + natural gas) 786 1,177 1,823
* Participation rates vary for electricity and natural gas, likewise for all sectors. Estimated participation rates utilized are shown in ES1 based on energy savings, whose methodology is described in Section 4.4
** Emissions reductions include reductions from TI and GF savings.
Tables ES-4 and ES-5 summarize the incremental investment costs and program costs respectively of each conservation strategy. These costs are associated with achieving the implementation scenarios and their associated participation rates. Investments in efficiency, while high in first cost, offer significant rates of return, which will only increase as energy prices continue to rise and political and economic instability threaten to make energy markets volatile and unpredictable in the near and distant future.10
10
The investment costs assessed here are the total incremental cost of energy efficiency, shared in the case of TI by the program administrator and the consumer, and in the case of GF by private sector capital investment.
xii
Table ES-4. Electricity and Natural Gas Efficiency Incremental Investment Costs
2015 Scenario Incremental Investment Cost by Sector ($million)
Electricity Incremental Investment Costs by Sector ($million)*
Leading State Cumulative Participation Rate** Most Aggressive State Cumulative Participation Rate** GreenTarget Cumulative Participation Rate** Elec. Residential Sector ($million) $83.6-$87.5 $161.4-$168.8 $267.9-$280.3 Elec. Commercial Sector ($million) $48.1-$49.0 $66.0-$67.8 $71.3-$73.3 Elec. Industrial Sector ($million) $28.2-$28.8 $45.5-$50.5 $129.7-$132.6 Elec. All Sector Investment ($million) $160.0-$165.3 $276.9-$287.1 $468.9-$486.2
Natural Gas Incremental Investment Costs by Sector ($million)
NG Residential Sector ($million) $22.9-$23.9 $46.9-$49.1 $81.6-$85.4 NG Commercial Sector ($million) $9.3-$9.5 $14.4-$14.9 $22.1-$22.9 NG Industrial Sector ($million) $5.4-$5.6 $10.9-$11.1 $29.6-$30.3 NG All Sector Investment ($million) $37.6-$39.0 $72.2-$75.1 $133.3-138.6 Elec. + NG Total
Incremental Investment ($million) $197.6-$204.3 $349.1-$362.2 $602.2-$624.8
* Investment costs include both TI and GF programs. For complete cost breakdown, see Table 41, p. 73
** Participation rates vary for electricity and natural gas, and by sector. Estimated participation rates utilized are shown in Table ES1. The methodology is described in Section 4.4.
xiii
Table ES-5. Electricity and Natural Gas Efficiency Program Costs
2015 Scenario Program Cost by Sector ($million)
Electricity Program Costs by Sector ($million)*
Leading State Cumulative Participation Rate** Most Aggressive State Cumulative Participation Rate** GreenTarget Cumulative Participation Rate** Elec. Residential Sector ($million) $44.3-$48.2 $85.5-$93.0 $142.4-$156.7 Elec. Commercial Sector ($million) $38.9-$39.8 $48.2-$49.9 $51.1-$53.2 Elec. Industrial Sector ($million) $17.2-$17.8 $28.3-$29.3 $70.3-$73.6 Elec. All Sector ($million) $100.4-$105.8 $162.0-$172.2 $263.8-$283.5
Natural Gas Program Costs by Sector ($million)
NG Residential Sector ($million) $12.1-$13.2 $24.9-$27.0 $43.7-$47.4 NG Commercial Sector ($million) $7.0-$7.2 $9.6-$10.1 $13.7-$14.5 NG Industrial Sector ($million) $3.0-$3.1 $5.5-$6.0 $15.6-$16.3 NG All Sector ($million) $22.1-$23.5 $40.0-$43.1 $73.0-78.2 Elec. + NG Total
Program ($million) $122.5-$129.3 $202.0-$215.3 $336.8-$361.7
* Program costs include incentives and program administration for TI and administration for GF.
** Participation rates vary for electricity and natural gas, likewise for all sectors. Estimated participation rates utilized are shown in ES1 based on energy savings, whose methodology is described in Section 4.4.
The Sustainable Energy Utility and Green Financing to Accelerate Energy Efficiency
While the implementation pathways examined for this report may seem aggressive given a history of relative inaction in Delaware,11 the state has a special advantage in meeting an ambitious EERS – its Sustainable Energy Utility (SEU). Delaware has the potential to leverage performance contracting that, through the SEU administered Green Financing (GF) program, can aggregate guaranteed energy savings and thereby significantly lift project and overall savings. A GF framework is already in place in the SEU to administer energy efficiency programs
comprehensively. The SEU can enlarge energy efficiency market share through securitized
11
In 2008, before the SEU was implemented, ACEEE ranked Delaware as tied for last place among 50 states in energy efficiency (ACEEE, 2008b).
xiv
Green Energy Saving Bonds12 by integrating capital intensive long-term projects with projects that have a short payback period through monetized guaranteed savings agreements. Estimated saving potentials through an SEU-administered GF framework point to the possibility of more closely approaching EERS savings goals, and in so doing would showcase Delaware’s recent leadership in the promotion and use of sustainable energy technologies and practices.
An important advantage of Green Financing is that it promises to lower the levelized cost of saved energy (LCOSE). For electricity, the State would enjoy a significant reduction, from the nearly 3 cents per kWh for TI efforts to less than 1 cent per kWh for GF (see Table ES-6). Similarly, a GF approach to natural gas savings is projected to cost only $1.63/MCF, while TI initiatives are expected to cost $4.51/MCF.13
Table ES-6. Levelized Cost of Saved Energy
(All Sectors)
Program LCOE Saved Electricity ($/kWh) Saved Natural Gas ($/MCF)
TI $0.03/kWh $4.51/MCF
GF $0.01/kWh $1.63/MCF
If the modeled pathways of this study are pursued, Delaware will rival the nation’s leading states in energy savings commitment on a per capita basis. Delaware’s aggressive energy efficiency goals complement its pioneering role in 21st century policy solutions, exemplified by the Sustainable Energy Utility’s special advantages in coordinating and delivering sustainable energy services, and establishing long-term market signals for citizens and businesses to invest in this cost-effective resource (Byrne & Martinez, 2009). As energy savings grow, economic development and environmental benefits will likewise multiply, further showcasing Delaware’s leadership role in building a green economy for a sustainable future.
12 See Transforming the National Energy Infrastructure: A Sustainable Energy Utility Strategy (2010), prepared by J. Byrne (CEEP, University of Delaware) and T. Allen (Citi). Available at:
http://www.seu-de.org/docs/minutes/US_2010_SEU_Green%20Energy%20Financing%20Primer_GESB_SEAB_RLF_SolarShare_ SustainableCommunities_May.pdf
13
Typical life span of energy efficiency measure was assumed at 15 years. LCOSE for TI are based on data reported in ACEEE (2008a and 2009). LCOSE values for GF are based on data from Citygroup (2009), LBNL (2010), and personal communications with selected ESCOs.
xv
Finally, as EERS implementation goes forward, it is important to note that Delaware has deregulated its electricity and natural gas markets, permitting the entry of third-party energy suppliers. These suppliers furnish 34% of the state’s total electricity and 48% of natural gas sales, and therefore are critical to long-term efficiency improvements. However, SB 106 is silent on the obligations of these suppliers to meet EERS targets. DNREC needs to consider how to address this issue.14
14
This report assumes EERS compliance for all users. Summary tables excluding consumers served by third party suppliers are included in Appendix D.
1
1
I
NTRODUCTIONDelaware’s enactment of Senate Bill (SB) 106 in 2009 establishes a policy framework for an Energy Efficiency Resource Standard (EERS), a policy mechanism to encourage energy
efficiency in electricity and natural gas consumption. SB 106 establishes a specific goal for energy savings (Section 1502):
1. For each affected Electric Energy Provider, Energy Savings that is equivalent to 2% of the Provider’s 2007 electricity consumption, and coincident peak
demand reduction that is equivalent to 2% of the Provider’s 2007 peak demand by 2011, with both of the foregoing increasing from 2% to 15% by 2015.
2. For each affected Natural Gas Distribution Company, Energy Savings that is equivalent to 1% of the Company’s 2007 natural gas consumption by 2011, increasing to 10% by 2015.
With the passage of SB 106, Delaware joins 22 other states that have adopted EERS targets as of April 2010.15 Because energy efficiency is the least-cost resource available to meet energy needs generally and in Delaware, EERS near-term impacts can have a positive co-benefit of job creation and economic stimulus (ACEEE, 2009a; ACEEE, 2008; SEU, 2008; ASES, 2007). According to the American Council for an Energy-Efficient Economy, “the EERS has proven to be an important policy tool to foster job growth in recession-battered industries like construction and manufacturing, all while reducing electricity demand and utility bills for consumers and businesses.”15
The EERS establishes a long-term market signal to promote access to this cost-effective resource, thereby reducing risk and improving investment opportunities in energy efficiency. This report presents the findings from research conducted by the Center for Energy &
Environmental Policy (CEEP) regarding Delaware’s EERS reduction targets and strategies to meet them. Consideration of several factors affecting energy use is required by the statute and were examined as part of this research effort. CEEP researchers undertook the task of
developing a scenario analysis of alternatives to meet the statute’s energy saving targets and to
15
ACEEE, 2010. The State Current: ACEEE State Network Update (April). Available online at http://www.aceee.org/energy/state/current.htm#EERS
2
estimate their state- and sector-wide impact. The data collected for this purpose and the model built by CEEP’s researchers to evaluate the State’s options are documented. It is hoped that the report can assist the state’s Sustainable Energy Utility (SEU), its investor-owned, municipally-owned and cooperatively municipally-owned utilities and its energy users in meeting the EERS goals of SB 106.
1.1 Delaware’s Historical Energy Use and Growth Rates
Electricity and natural gas consumption have increased at an average annual rate of 2.3% and 0.6%, respectively, since 1990. Table 1 notes that the residential and the commercial sectors in the state have witnessed annual growth in electricity use in excess of 3%. While the largest natural gas growth rate has been by the commercial sector (4.1% per year since 1990).
Table 1. Calculated 2007 Energy Use and Historical Growth Rates 1990-2008
2007 Electricity Use % Electricity Yearly Growth Rate 2007 NG Use % NG Yearly Growth Rate Residential 4,470 GWh 3.1% 10.0 billion cf 1.7% Commercial 4,321 GWh 3.7% 8.6 billion cf 4.1% Industrial 3,078 GWh 0.0% 16.0 billion cf -0.2%
Power Generation NA NA 13.4 billion cf -0.5%
Total 11,869 GWh 2.3% 48.0 billion cf 0.6%
Data Sources: EIA, 2010a; EIA, 2010b.
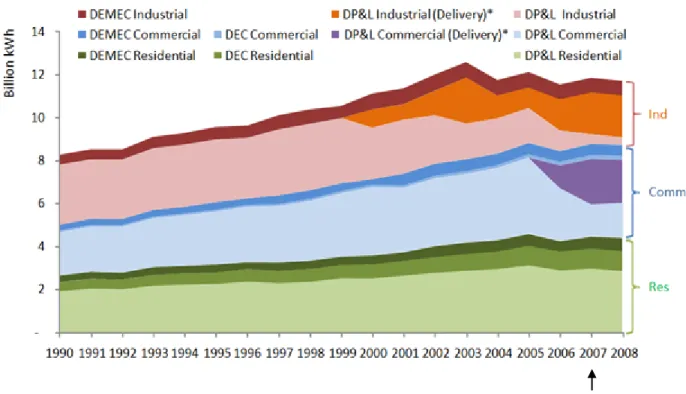
Historical electricity use is shown in Figure 1 and Figure 2 depicts recent trends in natural gas use by utility provider. Evident in both figures, Delmarva Power is the largest utility energy provider in the State, accounting for nearly 75% of the state’s delivered electricity, and nearly 70% of its delivered natural gas. Beginning in 1999, (the year following enactment of
Delaware’s deregulation statue), industrial and commercial electricity sales for Delmarva Power decreased as customers in both sectors migrated to new third-party providers.16
16
Figure 1 records the drop in electricity generation sales by Delmarva Power and the switch to delivery-service only. In this regard, third-party suppliers are important to any energy policy analysis in Delaware, and EERS implementation must consider whether this aspect of the market is subject to the SB 106 goals. However, the EERS Workgroup had not reached a decision regarding third-party supply when CEEP undertook its research. The main text of the report assumes EERS compliance for all suppliers, except the natural gas power sector. The alternative summary tables excluding third party suppliers are included in Appendix D.
3
Figure 1. Electricity Consumption in Delaware by Providers 1990-2008
* “Delivery” indicates that a utility is not responsible for securing generation; it is only responsible for the delivery of electricity service. Third party providers bear the responsibility of acquiring supply for this segment.
Data Source: EIA, 2010a
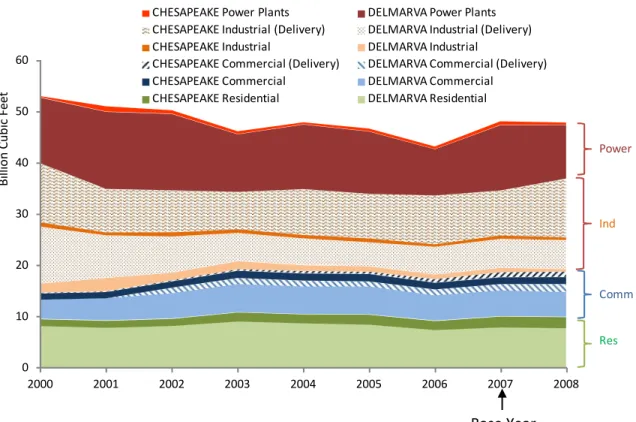
The natural gas market in the state is summarized in Figure 2. Commercial and Industrial users account for over 50% of sales and the power sector uses around 30% of annual natural gas deliveries. The residential sector accounts for 20% of this fuel’s use. 25.2% of commercial natural gas is third party supplied (4.5% of the total), and 90.2% the industrial natural gas is third party supplied (30.1% of the total).
4
Figure 2. Natural Gas Consumption in Delaware by Providers 2000-2008
Data Source: EIA, 2010b
0 10 20 30 40 50 60 2000 2001 2002 2003 2004 2005 2006 2007 2008
CHESAPEAKE Power Plants DELMARVA Power Plants CHESAPEAKE Industrial (Delivery)
CHESAPEAKE Industrial
DELMARVA Industrial (Delivery) DELMARVA Industrial
CHESAPEAKE Commercial (Delivery) CHESAPEAKE Commercial
DELMARVA Commercial (Delivery) DELMARVA Commercial
CHESAPEAKE Residential DELMARVA Residential
Res Comm Power Ind Base Year Bi lli on C ub ic F ee t
5
2
M
ETHODOLOGYThe research methodology used to assess energy efficiency potential and to select and evaluate implementation strategies is built upon the framework established by the U.S.
Department of Energy in collaboration with the U.S. Environmental Protection Agency. In their 2007 Guide for Conducting Energy Efficiency Potential Studies, these agencies discuss three measures of potential for the assessment of energy efficiency resources: technical, economic, and program potential (NAPEE 2007). As a generalized framework, these three categories represent the scope of any energy efficiency study for a given policy initiative. Figure 3
illustrates how these concepts are related, and defines their capacity for assessing various energy efficiency resources.
The categories of technical, economic and program potential are consistent with those used by other energy efficiency surveys (e.g., see Itron, 2006: Figure 3-2). It should be recognized that specific definitions vary depending on the economic and policy framework context, along with the timeframe of the analysis. The Delaware EERS timeframe for instance is five years. As a result, only a portion of Delaware’s appliances and equipment will reach their end of life, and only that subset may be economic to replace.
Figure 3. Implementation Scenarios
Technical Economic
Program
Technical:represents the theoretical maximum amount of energy efficiency. It disregards all non-engineering constraints such as cost, measure life/turnover rate, and end user participation.
Economic: includes the subset of the technical potential that is economically cost-effective as compared to conventional supply-side energy resources; with no regard for the gradual “ramping up” process of programs.
Program: measures the amount of energy that can be displaced based on specific program participation and funding levels for a specific timeframe, policy and measure life/turnover rate.
6
Using this conceptual framework, the research reported here then relied upon measure selection and assessment methods developed by the American Council for an Energy-Efficient Economy (ACEEE). According to the ACEEE, “cost-effectiveness of more efficient
technologies, compared to a standard baseline technology, is determined from the customer’s perspective, i.e., a measure is deemed cost-effective if its levelized cost of conserved energy (CCE) is less than the average retail energy price for a given customer class” (ACEEE, 2009).17 The evaluation of Delaware’s EERS implementation targets is based on this definition of cost effectiveness.
Program savings are measured in the same units used by ACEEE, namely savings per household, savings per square-foot (for commercial users), and savings per fixed value of shipments (for industrial customers). The EIA “value of shipments” definition was used for this analysis: “value of shipments and receipts consists of the total receipts for products
manufactured, services rendered, and the re-sales of products bought and sold without further manufacture. It is the dollar value received by the manufacturer for the products it sells” (EIA 1994).
Lastly, this assessment includes only existing technologies and practices available as of 2008.18 CEEP anticipates that new and emerging technologies and market learning will increase the cost-effective resource potential of energy efficiency in the coming decades. However, the study treats savings associated with technology improvements to affect post-2015 experience. In this respect, reported savings estimates are likely to understate actual results.
17 Levelized cost is defined as the present value of the total cost of building and operating a generating plant over its economic life, converted to equal annual payments. Costs are levelized in real dollars (i.e., adjusted to remove the impact of inflation). See http://www.eia.doe.gov/glossary/index.cfm?id=l
18
This is the latest year for which robust data sets are available. In this respect, the study is based on empirical rather than speculative methods.
7
3
S
CENARIOSIn consultation with the Office of the Secretary of the Department of Natural Resources and Environmental Control (DNREC), CEEP considered three implementation scenarios to achieve the energy savings targets established by SB 106. Each of the three scenarios, defined in Table 2, is based on a different interpretation of the legislated level of electricity and natural gas reduction found in the statute. These definitions were presented to the Working Group created by SB 106 and its suggestions were included in the final versions used for the analysis. The Working Group agreed that the red target was unachievable for the reasons discussed in Section 4 of this report. The Blue and Green Target scenarios provide the basis for all of scenario analyses reported in Sections 4 - 9.
Table 2. Scenario Definitions
Electricity Scenarios: Natural Gas Scenarios:
(Red) By 2015 electricity consumption will be
15% below the State’s 2007 level. (Red)below the State’s 2007 level. By 2015 NG consumption will be 10% (Blue) By 2015 electricity consumption will
equal 85% of projected 2015 consumption. (Blue) By 2015 NG consumption will equal 90% of projected 2015 consumption. (Green) By 2015 electricity consumption will
equal projected 2015 consumption MINUS 15% of 2007 consumption.
(Green) By 2015 NG consumption will equal projected 2015 consumption MINUS 10% of 2007 consumption.
9 9.0 9.5 10.0 10.5 11.0 11.5 12.0 12.5 13.0 2007 2008 2009 2010 2011 2012 2013 2014 2015 Billio n k Wh
Consumption without EERS (projected 2015 consumption)
Energy consumption equal projected 2015 consumption MINUS 15% of 2007 consumption
Energy consumption equal 85% of projected 2015 consumption Consumption 15% below 2007 Level
4
B
ASELINE ANDE
CONOMICP
OTENTIAL4.1 Establishing a Baseline
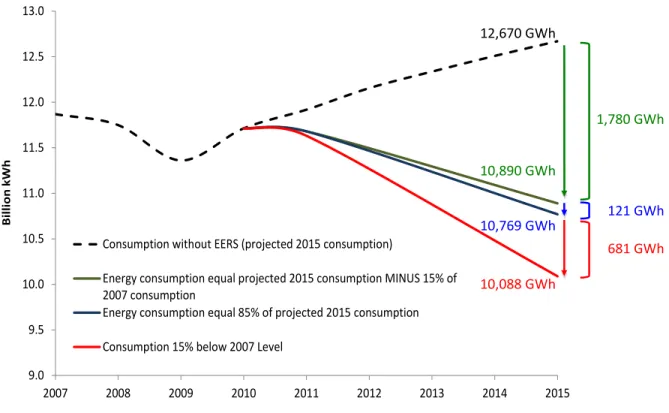
Accurate projection of baseline consumption is critical to evaluating each scenario definition. This report uses data provided by the utilities (i.e., DP&L, Chesapeake, Delaware Electric Cooperative, and Delaware Municipal Electric Corporation ) and the U.S. EIA (EIA: 2003; 2008; 2009; 2010; 2010a; 2010b). Figure 4 displays the projected electricity savings requirement for each scenario (Red, Blue & Green). As required by SB 106, the baseline year is 2007.
Figure 4. Aggregate Electricity Sales and Target Projections (Base Year 2007)
Although electricity consumption fell slightly from 2007 through 2010, as reported by each electricity provider, projections from the utilities and the 2009 Delaware Energy Plan estimate that without an EERS program, electricity consumption will climb to more than 12,600 GWh by 2015. The most conservative interpretation of the 15% reduction, the Green Target, projects a
12,670 GWh 10,890 GWh 10,769 GWh 10,088 GWh 681 GWh 121 GWh 1,780 GWh
10 28 29 30 31 32 33 34 35 36 37 38 39 40 41 2007 2008 2009 2010 2011 2012 2013 2014 2015 Billio n C ub ic F ee t
Consumption without EERS (projected 2015 consumption) Energy consumption equal projected 2015 consumption MINUS 10% of 2007 consumption
Energy consumption equal 90% of projected 2015 consumption Consumption 10% below 2007 Level
required savings of 1,780 GWh below 2015 business-as-usual (BAU) projections. The more aggressive Blue Target estimates a further 121 GWh in savings, while the most aggressive scenario, the Red Target, projects another 681 GWh in savings beyond the Blue Target.
Figure 5. Aggregate Natural Gas Sales and Target Projections (Base Year 2007)
* Assumes 1% growth for 3rd-party delivery (excludes power sector consumption)
Projections from the service providers and the 2009 Delaware Energy Plan estimate that, without an EERS program, natural gas consumption will climb to more than 40,000 MMCF by 2015, assuming a 1% annual growth rate for 3rd-party delivery and excluding sales for the power sector. The most conservative interpretation of the 10% reduction, the Green Target, projects a required savings of 3,465 MMCF below 2015 business-as-usual (BAU) projections. The more aggressive Blue Target estimates a further 552 MMCF in savings, while the most aggressive scenario, the Red Target, projects another 4,972 MMCF in savings beyond the Blue Target.
Because each of the three electric and two natural gas utilities considered in this report maintain distinct baselines and have demand projections, and have different mixes of customers,
40,166MMCF 36,701MMCF 36,149MMCF 31,177MMCF 552 MMCF 3,465 MMCF 4,972 MMCF
11
targets and their impacts vary accordingly. Each utility baseline is generated from the BAU projections available at the time of this report.19
4.2 Technical Potential
Using the broadest definition for energy efficiency savings potential, the theoretical maximum amount of energy efficiency reductions can be estimated. Taking into account only this engineering potential, (hence disregarding all non-engineering constraints such as cost, measure life/turnover rate, and end user participation), Delaware’s technical potential is
illustrated below in Table 3 based on 100% participation for the technologies considered during the course of this research (see Appendix A through C for complete lists of the more than 200 technologies considered). This level of energy savings results from using the best-in-class technologies available today. New energy efficiency technologies not yet available in the market are not considered.
Table 3. Technical Potential for Delaware Electricity & Natural Gas Efficiency Savings Electricity Savings (GWh) % of Sector 2007 Electricity Consumption Natural Gas Savings (MMCF) % of Sector 2007 Natural Gas Consumption Residential Sector 1,624 37% 3,772 38% Commercial Sector 1,642 38% 2,793 32% Industrial Sector 853 28% 3,688 23% Total of 3 Sectors 4,119 35% 10,253 30%
* Source: CEEP model and calculations.
Bearing in mind this technological potential, of the three energy efficiency targets
considered, the Red Target is the most aggressive, beginning immediately, requiring reversal in the growth of energy consumption and a very aggressive cumulative participation rate (more than 80% for electricity and above 100% for natural gas) to successfully reach the target. Based on the achieved participation rates of other state and utility efficiency programs, CEEP has concluded that the Red and Blue Targets are not technologically achievable by 2015.20 For this
19
DEMEC’s projections are from the Delaware Energy Plan (DNREC 2009), while the DP&L, DEC, and Chesapeake projections are derived using data they supplied directly for this report.
12
reason, the Red and Blue Targets were not pursued in the estimate of state energy efficiency potential.
The Green Targets represent CEEP’s best estimate of the technical potential within a five-year timeframe, assuming no new efficiency opportunities beyond those already in the market. That is, the State’s technically achievable target for electricity savings is estimated to be 1,780 GWh in 2015. For natural gas, the potential is estimated to be 3,465 MMCF in 2015. These estimates assumed that 15% savings for electricity users and 10% savings for natural gas customers is the near-term maximum. The assumption comports with findings in the research literature (Chandler and Brown 2009; Itron 2006; SEU 2008; ACEEE 2009, ACEEE 2010a).
4.3 End-Use Sector Baseline and Economic Potential
The three sectors of the Delaware energy market – residential, commercial, and industrial – have different compositions by fuel type, level of consumption, and end-use. Particularly due to this last factor, the economic efficiency potential of each sector varies widely. Because of the relatively short timeframe of the EERS program, future federal and state policies (including carbon taxes or trading mechanisms), and other rebates, taxes, or subsidies were not considered in assessing the economic potential of the efficiency measures discussed below.21
In order to assess the potential economic savings over the five-year term of the EERS target, this report draws on a range of sector-specific electricity and natural gas efficiency measures and determines the levelized cost of saved energy for each measure (LCOE). LCOE saved is a function of incremental energy savings, incremental cost, measure life, turnover rate, and the discount rate. Here we generally define incremental energy saved as the difference in
consumption between an available high efficiency piece of equipment and the standard equipment, building envelope, or process control measures in use currently in the market. In some cases, particularly in the commercial and industrial sectors, with high volumes of demand based on differing technologies and production processes, it may be cost-effective to retrofit still useful older technologies with newer, more efficient measures, achieving higher gross savings but increasing the levelized cost of energy saved. In most cases, the turnover rate is determined by the expected measure life of a given piece of equipment or building improvement.
21
If new policies are enacted by the federal and/or state governments in the next 2-3 years (to allow for impacts to appear by 2015) it is possible that economically achievable efficiency can grow above the estimates in this report.
13
Incremental cost, likewise, is defined here as the difference in capital cost between a high efficiency measure and a standard measure.
In each sector, the economic efficiency potential is measured by a model developed by CEEP which links several factors: the percent of household or institution energy saved as a result of a measure, levelized cost of energy (defined above), and projected annual savings potential in MWh or MCF per $1,000 of program spending (including program administration costs – see Table ES-1). This last metric derives from the assumption that, apart from program
administrative costs, the cost of all efficiency measures will be born equally by the consumer and the program administrator.22 The formula used to derive the annual energy saved per $1000 is the net present value (NPV) divided by the annual savings. NPV includes capital cost plus operating and maintenance costs and a discount rate of 5% over the expected lifetime of each measure.
We note here that further dialogue is needed to address the role of non-utility energy generators and consumers. Non-utility entities – principally power generators and large industrial and commercial sector users – consume more than 60% of natural gas in the State of Delaware, and more than 30% of electricity sales in the state are served by non-utility providers. If utility costs rise as a result of the EERS statute, some consumers may migrate to non-utility providers not currently under the umbrella of the EERS legislation.
4.3.1 Residential Energy Use and Economic Savings Potential
Delaware’s residential electricity consumption in the baseline year of 2007 was 4,470GWh, or 37.6% of the State’s total electricity use. For natural gas, residential users accounted for 10.0 billion cubic feet, or 20.8% of the State’s total natural gas consumption. Economic savings potential for the residential sector was determined through research on 50 electricity and efficiency measures and 43 natural gas efficiency measures (see Appendix A).
22
In Delaware, the Sustainable Energy Utility is responsible for implementation of energy efficiency programs (in close coordination with the utilities). Demand response programs are the responsibility of the State’s electric and natural gas utilities.
14
A detailed portrait of this end-use sector is provided below. Figure 6 examines the end-use consumption characteristics for electricity, where per household average electricity use is 11,500 kWh per year.
Figure 6. Residential Electricity Consumption by End Use
Derived from EIA, 2008.
Economic Potential of Electricity Savings in the Residential Sector
The economic potential for electricity savings is defined as the sum of efficiency measures whose levelized cost of savings is equal to or less than the projected electricity rate. The analysis of economic potential considers new measures to replace existing technologies as they reach the end of their useful life within the 5-year timeframe of the EERS statute. Thus, existing
appliances whose measure life expires after 2015 are not considered for either cost or energy savings. Measures for single-family and multi-family residences are separately considered. This report estimates economic potential savings from electricity end-use efficiency improvements of 1,227 GWh through a variety of housing shell, appliance, and equipment upgrades (Table 4). Employing measures identified in Appendix A, in 2015 households in Delaware could save approximately 27.8% at an average levelized cost of savings of $0.04/kWh. Annual economic
Heating 7% Air Conditioning 20% Water Heating 9% Refrigeration 12% Appliances 35% Lighting 17% 8,500 kWh/yr per household 14,700 kWh/yr per household DE =11,500 kWh/yr per household
15
efficiency potential per $1000 of program spending is estimated at 4.0-4.4 MWh, depending on administrative costs. These estimates are for savings over the five-year lifetime of the EERS and are a composite of savings for single- and multi-family housing. When separated, these housing segments differ in economic potential: single-family homes are projected to have an economic savings potential of 31%; households in multi-family buildings are projected to have a lower rate of 13%. Again, these estimates are for measures adopted in the five-year EERS timeframe.
Table 4. Residential Electricity-Economic Efficiency Potential and Costs by End-Use
End Use Savings (GWh) household (%) Savings per Levelized Cost of Saved Energy ($/kWh)
Energy Saved per Incentive Paid (MWh per $1000)* Improved Housing Shell Performance 388 8.8% $0.04 3.0-3.2 HVAC Equipment Upgrades 64 1.4% $0.08 2.1-2.2 Water Heating Upgrades 70 1.6% $0.06 3.1-3.4 Lighting Upgrades 432 9.8% $0.01 15.9-17.2 Refrigeration Upgrades 63 1.4% $0.11 1.2-1.3 Furnace Fan Upgrades 49 1.1% $0.03 4.4-4.8
Plug Load Upgrades 91 2.1% $0.03 9.7-10.5
Electricity Use
Feedback Install 71 1.6% $0.05 3.7-4.0
Existing Homes Totals 1,227 27.8% $0.04 4.0-4.4
* Assumes 15% and 25% administrative costs and equally shared incremental cost. These percentages were taken from studies completed by Eldridge et al. in ACEEE, 2008a: 55.
Source: CEEP model and calculations.
As illustrated in Figure 6, residential electricity consumption is principally driven by appliance use, heating and cooling, and lighting. Delaware straddles the Middle Atlantic amd South Atlantic regions used by EIA to report the results of its surveys on end use of energy. Averages were constructed from the data for both regions to characterize Delaware’s electricity end uses. Without this adjustment, Delaware’s winters and summers would be assumed to
16
resemble those of the Carolinas. An inspection of daily temperatures indicates the inaccuracy of such an assumption especially for the northernmost county of New Castle.
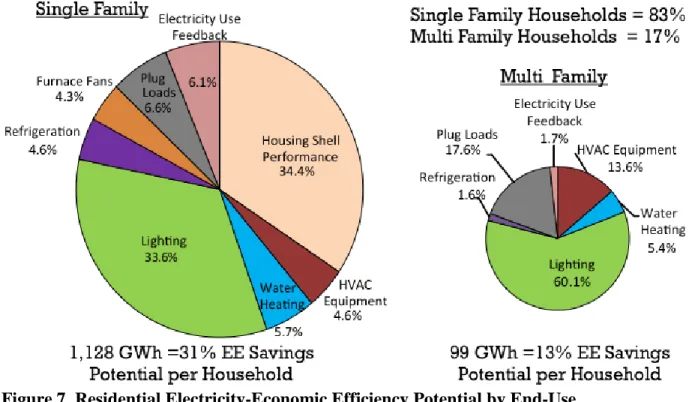
Because of differences such as levelized cost of savings and measure life, the percent of total electricity consumption for a given end-use does not necessarily translate to an equivalent economic savings potential. For example, lighting comprises 17% of total residential electricity consumption (Figure 6), but accounts for more than 33% of total cost-effective electricity savings potential (Figure 7). Light-emitting diodes (LED) fixtures could offer even greater potential energy savings, but are not yet considered cost-effective and were not included in this study (ACEEE, 2009: 16). Appliances comprise 35% of consumption but account for
approximately 10% of potential savings. The economic potential for savings in residential electricity is estimated by end-use technology in Figure 7. Housing shell performance –
characterized by improvements to insulation, duct-sealing, reduced air-infiltration, and upgraded windows – represents the largest wedge of economic potential, at more than 32% of total
savings.
Figure 7. Residential Electricity-Economic Efficiency Potential by End-Use
17
Economic Potential of Natural Gas Savings in the Residential Sector
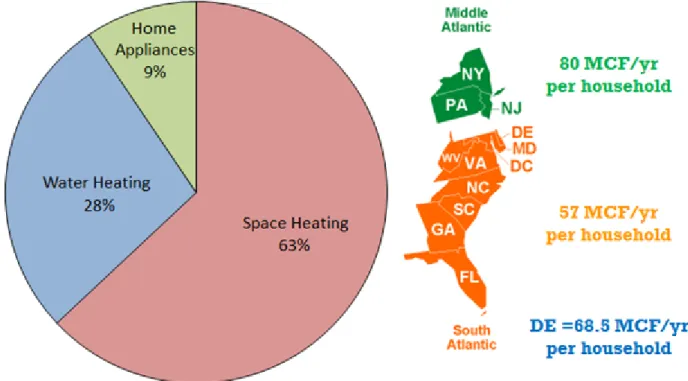
Residential natural gas consumption is dominated by both space and water heating, at 63% and 28% of consumption, respectively (see Figure 8). These estimates are based on regionally reported survey data assembled by EIA (2008). Because Delaware straddles two of the EIA regions (Middle Atlantic and South Atlantic), averages were constructed to represent the state.23 This report estimates an economic potential for residential natural gas savings of 1,850 MMCF by 2015 (Table 5). If realized, these energy savings would translate to approximately an 18.6% savings rate per household at an estimated levelized cost of natural gas saved of $5.50/MCF. As with electricity, this report primarily considers technologies whose measure life expires within the five-year timeline of the EERS (see Appendix A for a list of measures). Annual economic efficiency potential per $1,000 of program spending is estimated at 21.1-22.9 MCF, depending on the assumed level of administrative costs.
Figure 8. Residential Natural Gas Consumption by End Use
Source: Derived from EIA, 2008.
23
Without averaging, Delaware would be assuming to have summers and winters similar to the Carolinas. This is not correct, especially for its northernmost county of New Castle.
18
Table 5. Residential Natural Gas-Economic Efficiency Potential and Costs by End-Use
End Use (MMCF) Savings Savings per house hold (%) Levelized Cost of Saved Energy ($/MCF)
Energy Saved per Incentive Paid (MCF per $1000)* Space Heating (Improved Shell Performance) 1,342 13.5% $5.0 21.9-23.9 Space Heating (Equipment) Upgrades 167 1.7% $7.2 15.2-16.5 Water Heating Upgrades 328 3.3% $6.8 22.1-24.0 Cooking 14 0.1% $8.6 16.3-17.7 Existing Homes 1,850 18.6% $5.5 21.1-22.9
* Assumes 15% and 25% administrative costs and equally shared incremental cost.
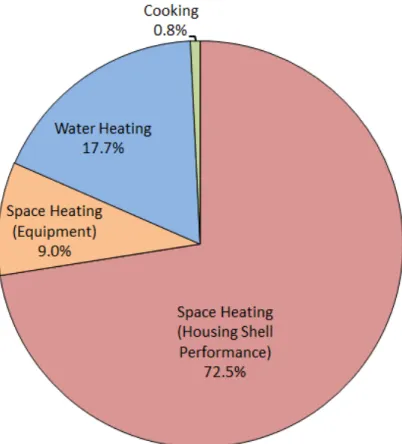
As Figure 9 illustrates, housing shell improvements (mainly upgrades to windows, insulation, and added ductwork) offer the greatest opportunities to reduce natural gas
consumption. These upgrades are less costly than space heating equipment upgrades (which account for an estimated 1.7% of household gas savings), as well as water heating and cooking upgrades (which account for 3.3% and 0.1% of potential savings respectively). Thus
improvements to the building envelope represent the largest single savings potential for natural gas in Delaware’s residential sector, and could save the average Delaware household as much as 13.5% in energy consumption and costs (Table 5).
Water heating, after space heating, comprises the second largest consumption of natural gas. The successful implementation of direct water heating efficiency measures such as improved water heaters and pipe insulation, combined with indirect end-use measures, such as low-flow showerheads and water-conserving dish- and clothes-washing machines, can result in a potential savings of approximately 328 MMCF, about 18% of total natural gas saved. Gains in efficiency may be realized by the replacement of electric and older natural gas cooking equipment with more efficient natural gas technologies, but the savings rate is estimated to be less than 1%. This is to be expected; these end-uses dominate residential natural gas use and technology improvements in both cases continue to be cost-effective and available in the market.
19
Figure 9. Residential Natural Gas-Economic Efficiency Potential by End-Use
Source: CEEP analysis
4.3.2 Commercial Energy Use and Economic Savings Potential
Delaware’s commercial energy use is currently 4,321 GWh, or 36.4% of the state total for electricity consumption, and 8.6 billion cubic feet, or 17.9% of the state total for natural gas consumption (see Table 1). Economic savings potential were determined through research on 33 electricity efficiency measures and 25 natural gas efficiency measures (see Appendix B).
Economic Potential of Electricity Savings in the Commercial Electricity Sector Figure 10 indicates that lighting is the single largest source of electricity consumption, and Table 6 reports estimates of electricity intensity for the commercial sector, based on surveys conducted by the EIA in 2003. Electricity use in Delaware’s commercial sector stems mostly from lighting and HVAC end-uses. Lighting constitutes 38% of total commercial electricity consumption, more than twice that of any other single end-use category. Cooling and HVAC
20
related uses, such as ventilation, along with refrigeration, also command a significant wedge of consumption (41% of sector electricity use).
Figure 10. Commercial Electricity Consumption by End-Use
Source: Derived from EIA, 2003.
Electricity intensity of various measures is detailed in Table 6, and represents a valuable metric for evaluating the comparative potential of various end-use efficiency strategies in the commercial sector. Electricity intensity estimates for the commercial sector were derived by averaging available Energy Information Administration data from its 2003 Commercial
Buildings Energy Consumption Survey (EIA, 2003). Because of the census division breakdown of the CBECS analysis, Delaware is included as part of the edge of the South Atlantics census region, although it also borders the Mid-Atlantic region. This report takes an average of aggregate data for the Mid-Atlantic and South Atlantic regions to find a more climate-specific electricity intensity for Delaware’s commercial sector.
21
Table 6. Commercial Sector Electricity Intensity (kWh per SF)
End Use Middle Atlantic South Atlantic Average
Heating 0.7 0.7 0.7 Cooling 1.0 3.3 2.2 Ventilation 1.7 2.1 1.9 Water Heating 0.2 0.6 0.4 Lighting 5.1 6.6 5.9 Refrigeration 1.2 2.0 1.6 Office Equipment 1.0 1.1 1.1 Other 1.6 1.9 1.8 Total 12.5 18.3 15.4
Source: Derived from EIA, CBECS 2003.
Economic potential for this sector was assessed using efficiency measures whose levelized cost of saved energy is equal to or lower than the current sector price for electricity. Both upgrades to expiring technologies and retrofits of still useful technologies and building shell elements were considered here, based on the estimated difference in lifetime savings and capital investment.
By evaluating a suite of 36 electricity efficiency measures implemented over the five-year timeframe, CEEP researchers estimate that the commercial sector could realize a total savings of approximately 800 GWh at an average levelized cost of saved electricity of 1.4 cents/kWh – well under the projected price of electricity for the sector (see Table 7). Approximately 12-13 MWh in savings are expected per $1,000 of program investments. A breakdown of this economic potential is provided by end-use technology in Figure 11.
22
Table 7. Commercial Electricity Economic Efficiency Potential & End-Use Costs
End-Use Savings (GWh) Savings (%) Levelized Cost of Saved Energy ($/kWh)
Energy Saved per Incentive Paid (MWh per $1000)* Building Shell
Improvements 75.5 1.7% $0.016 7.9-8.7
Heating & Cooling Upgrades (equipment &
controls) 210.4 4.9% $0.024 9.0-9.8
Water Heating Upgrades 12.1 0.3% $0.043 4.5-4.9
Refrigeration Upgrades 51.6 1.2% $0.021 10.3-11.2
Lighting Upgrades 293.9 6.8% $0.012 15.5-17.0
Office Equipment
Upgrades 167.6 3.9% $0.001 NA
Appliance and Other
Equipment Upgrades 0.9 0.0% $0.065 2.9-3.2
Existing Buildings 812.1 18.8% $0.014 11.8-12.9
* Assumes between 10% and 20% for administrative costs and equally shared incremental cost.
Figure 11. Commercial Electricity-Economic Efficiency Potential by End-Use
23
Economic Potential of Natural Gas Savings in the Commercial Sector
The methodology to determine commercial natural gas end use percentage for the sector draws on EIA’s 2003 Commercial Building Energy Consumption Survey data. The results for Delaware can be found in Figure 12. Delaware’s commercial sector natural gas consumption is dominated by space heating (62%), followed by water heating (18%) and cooking (10%).
Figure 12. Commercial Natural Gas Consumption by End Use
Source: Derived from EIA, 2003.
Based on a menu of 28 natural gas efficiency measures implemented over the five-year timeframe of the EERS, CEEP researchers estimate that the commercial sector could realize savings of nearly 1,089 MMCF at an average levelized cost of natural gas saved of $2.77
cents/MCF – well under the projected price of natural gas for this sector. Potential cost-effective savings for the sector are estimated to be 12.6% for the five-year timeframe. Annual economic efficiency potential per $1,000 of program spending is estimated at 59.9-65.4 MCF (see Table 8). The breakdown of this economic potential by end-use technology is provided in Figure 13.