ORIGINAL INVESTIGATION
Overweight and obesity impair left
ventricular systolic function as measured
by left ventricular ejection fraction and global
longitudinal strain
Peter Blomstrand
1,2*, Peter Sjöblom
3,4, Mats Nilsson
5, Magnus Wijkman
6, Martin Engvall
3, Toste Länne
3^,
Fredrik H. Nyström
3, Carl Johan Östgren
3and Jan Engvall
3,7,8Abstract
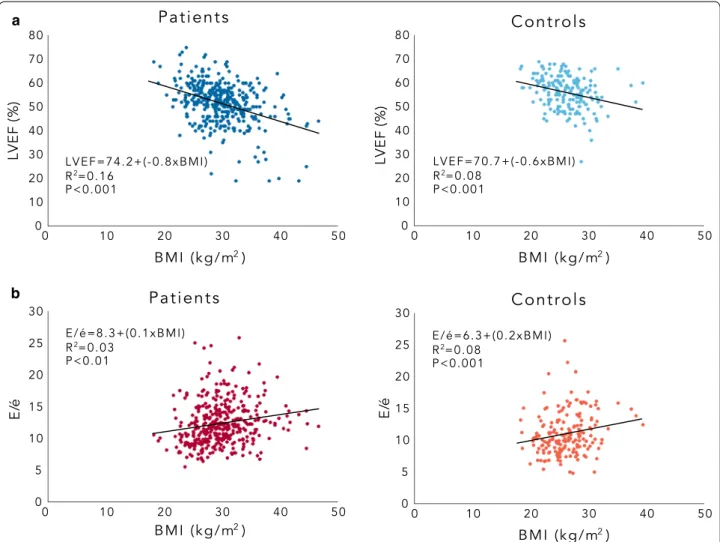
Aims: Obesity is associated with type 2 diabetes mellitus, left ventricular diastolic dysfunction and heart failure but it is unclear to which extent it is related to left ventricular systolic dysfunction. The aim of the study was to explore the effects of overweight and obesity on left ventricular systolic function in patients with type 2 diabetes mellitus and a control group of non-diabetic persons.
Methods: We prospectively investigated 384 patients with type 2 diabetes mellitus, and 184 controls who partici-pated in the CARDIPP and CAREFUL studies. The participants were grouped according to body mass index (normal weight < 25 kg/m2, overweight 25–29 kg/m2, and obesity ≥ 30 kg/m2). Echocardiography was performed at the beginning of the study and after 4-years in the patient group.
Results: Univariable and multivariable regression analysis revealed that variations in left ventricular ejection fraction, global longitudinal strain, left ventricular mass and diastolic function expressed as E/é (the ratio between early dias-tolic mitral flow and annular motion velocities) all are related to body mass index. The mean and standard deviation of left ventricular ejection fraction and global longitudinal strain values were 57% (8%) vs. − 18.6% (2.3%) for normal weight patients, 53% (8%) vs. − 17.5% (2.3%) for overweight, and 49% (9%) vs. − 16.2% (3.0%) for obese (p < 0.05 vs. p < 0.05). Corresponding results in the control group were 58% (6%) vs. − 22.3% (3.0%), 55% (7%) vs. − 20.8% (3.1%) and 54% (8%) − 19.6% (4.0%) (p < 0.05 vs. p < 0.05). Patients who gained weight from baseline to follow-up changed left ventricular ejection fraction (median and interquartile range) by − 1.0 (9.0) % (n = 187) and patients who lost weight changed left ventricular ejection fraction by 1.0 (10.0) % (n = 179) (p < 0.05).
Conclusion: Overweight and obesity impair left ventricular ejection fraction and global longitudinal strain in both patients with type 2 diabetes mellitus and non-diabetic persons.
Trial registration ClinicalTrials.gov identifier NCT 01049737
Keywords: Overweight, Obesity, Diabetes mellitus, Echocardiography
© The Author(s) 2018. This article is distributed under the terms of the Creative Commons Attribution 4.0 International License (http://creat iveco mmons .org/licen ses/by/4.0/), which permits unrestricted use, distribution, and reproduction in any medium, provided you give appropriate credit to the original author(s) and the source, provide a link to the Creative Commons license, and indicate if changes were made. The Creative Commons Public Domain Dedication waiver (http://creat iveco mmons .org/ publi cdoma in/zero/1.0/) applies to the data made available in this article, unless otherwise stated.
Open Access
*Correspondence: [email protected] ^Toste Länne—deceased
1 Department of Clinical Physiology, County Hospital Ryhov, Jönköping, Sweden
Background
The prevalence of overweight and obesity is increasing. In 2016, 39% of adults worldwide suffered from overweight and 13% from obesity [1]. Overweight is defined by WHO as a body mass index (BMI) value ≥ 25 kg/m2 and
obesity as a BMI value ≥ 30 kg/m2. Obesity is associated
with conditions that increase cardiovascular morbidity and mortality [e.g., lipid metabolic disturbances, type 2 diabetes mellitus (T2DM), hypertension, and coronary artery disease] [2]. Obesity is an independent predictor of left ventricular (LV) hypertrophy, diastolic dysfunction, and heart failure [3–5] but the association with systolic function is more complex. Obesity, as measured by BMI, is associated with subclinical LV systolic dysfunction measured using echocardiographic myocardial tissue sig-nal (deformation imaging) [6–8], but also improved left ventricular ejection fraction (LVEF) [9, 10]. Abdominal obesity, as measured by waist circumference, has shown to be associated with impaired peak global longitudinal strain (GLS) [6, 10]. The extent to which obesity is asso-ciated with LV systolic dysfunction independent of the concomitant increase in other risk factors is unclear [11].
Diabetes mellitus type 2 is also associated with hyper-tension and coronary artery disease and is an independ-ent risk factor for myocardial infarction [12]. LV systolic and diastolic dysfunction and hypertrophy are common in patients with T2DM [13, 14]. Multifactorial patho-physiological mechanisms are likely mediators to dia-betic cardiomyopathy with systolic and diastolic LV dysfunction heralding the development of congestive heart failure, independent of coronary artery disease and hypertension. The extent to which obesity contributes to impairment of LV systolic function in patients with T2DM is unclear but it is our hypothesis that it is associ-ated with impaired systolic function as measured by use of both LVEF and deformation imaging.
Methods Study population
The aim of this study was to assess the relationship between overweight and obesity to the LV remodelling of systolic function in patients with T2DM and a control group of non-diabetic persons. We enrolled 512 consecu-tive patients who participated in the Cardiovascular Risk factors in Patients with Diabetes—a Prospective study in Primary care (CARDIPP) study [15]. Participants were recruited from 13 primary healthcare centres between 2005 and 2009. Except for patients with severe physical or mental disease and those with a short life expectancy (i.e., < 1 year), all patients with T2DM, 55–65 years of age who wanted to participate were included. As non-diabetic controls, we used 185 age-matched, randomly selected individuals, from a population register, the
CAREFUL (Cardiovascular Reference Population) study [16]. The studies are registered with Clinicaltrials.gov, number NCT 01049737.
The investigation included collection of medical his-tory and ongoing medical therapy data from patient records. Each person underwent an echocardiographic examination at time of enrolment into the study. Height and weight were measured. Blood pressure was meas-ured in supine position at rest using a fully automated oscillometric device (Dinamap PRO 200 Monitor, Cri-tikon, Tampa, FL, USA). All patients in the CARDIPP study were invited to join an echocardiographic follow-up study 4 years after the initial examination but 112 declined to participate and were therefore excluded. The echocardiographic examinations were performed at the Department of Clinical Physiology, Linköping University Hospital, Linköping, Sweden.
Laboratory analyses
Urine and blood specimens were taken in the morning following a 10-h overnight fast. Creatinine, total cho-lesterol, high density lipoprotein (HDL), low density lipoprotein (LDL) and triglyceride concentrations were measured. HbA1c was analysed using a Swedish Mono-S HPLC. Mono-Since the control group specifically excluded participants with T2DM, HbA1c was not measured in CAREFUL. Renal glomerular function was assessed by eGFR. Microalbuminuria was defined according to the American Diabetes Association definition, as uACR ≥ 3.0 mg/mmol.
Echocardiography
was used to index the measurements of LA, LVEDV and LV mass. Early diastolic transmitral inflow veloc-ity (E) was obtained at the level of the tip of the mitral leaflets using pulsed wave Doppler ultrasound. Color tis-sue Doppler loop images were obtained in the two- and four-chamber apical views. Mitral annular plane systolic excursion (MAPSE) was measured using the tissue track-ing algorithm, which uses color tissue Doppler measure-ment of systolic tissue velocity, integrated over time [18]. MAPSE was calculated by averaging the total amplitude values measured from three consecutive heartbeats at the septal, lateral, inferior, and anterior aspects of the two- and four-chamber views. Peak early diastolic myocar-dial velocity (é) was measured from color tissue Doppler recordings at the base of the septum and lateral wall and was presented as the mean of three consecutive heart-beats [19]. The E/é ratio was calculated and was consid-ered to reflect the filling pressures to the left ventricle [20].
Statistical analysis
The clinical aim of the study was to assess the relation-ship between overweight and obesity, as measured by use of BMI, and LV systolic function in T2DM patients and non-T2DM controls. For statistical analysis, SPSSV.22.0 software (SPSS, Chicago, IL, USA) and Statistical Anal-ysis Software, SAS/STAT (Cary, USA) were used. The results for categorical variables were presented as num-bers and percentages. Continuous variables were pre-sented as median and interquartile ranges and in analysis of variance (unbalanced ANOVA) as mean and standard deviation (SD).
Univariable and multivariable linear regression analysis were used to investigate the relationships between base-line characteristics and LV function. In the multivariable linear regression models, those explanatory variables that had estimates of the regression parameters (e.g. β1) that were statistically significantly different from zero together with age and gender were included. Pearson’s correlation analysis was used to examine the associations between BMI and left ventricular function and mass. To analyse the relationship between T2DM and left ven-tricular function, patients and controls were merged in a final regression analysis. Check for multicollinearity as well as homogeneity of variance was performed.
To assess the risk for LV systolic dysfunction in patients with overweight and obesity, odds ratios and 95 percent confidence intervals were calculated for LVEF catego-rized as normal or impaired (normal defined as ≥ 52% in
male and ≥ 54% in female participants, according to
rec-ommendations [21] and BMI (normal, overweight and obesity). Wilcoxon signed rank test was used to analyse differences between matched samples within a group
and Mann–Whitney U-test between groups. To com-pare participants with BMI values < 25 kg/m2, 25–29 kg/ m2, and ≥ 30 kg/m2, variance analysis using unbalanced ANOVA was used for continuous variables. Pairwise comparisons and χ2 tests were used for analysis of dis-crete variables. Inter-observer variability was determined by use of a two-way mixed, absolute agreement, intra-class correlation (ICC) analysis, and limits of agreement and coefficient of variation. A p value < 0.05 was consid-ered to indicate a statistically significant result.
Results
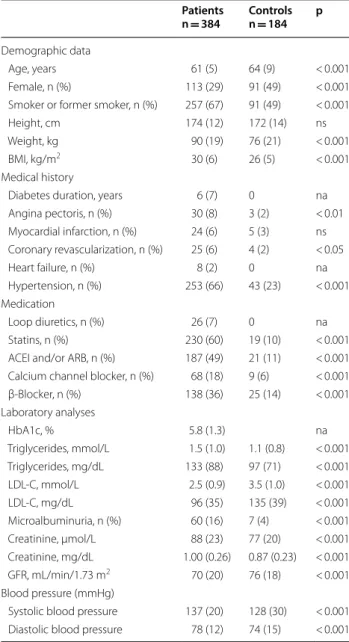
Results from 16 patients and one control were excluded because of bad image quality or missing data. The study population consisted of the remaining 384 patients and 184 controls. Baseline characteristics of the enrolled par-ticipants are presented in Table 1.
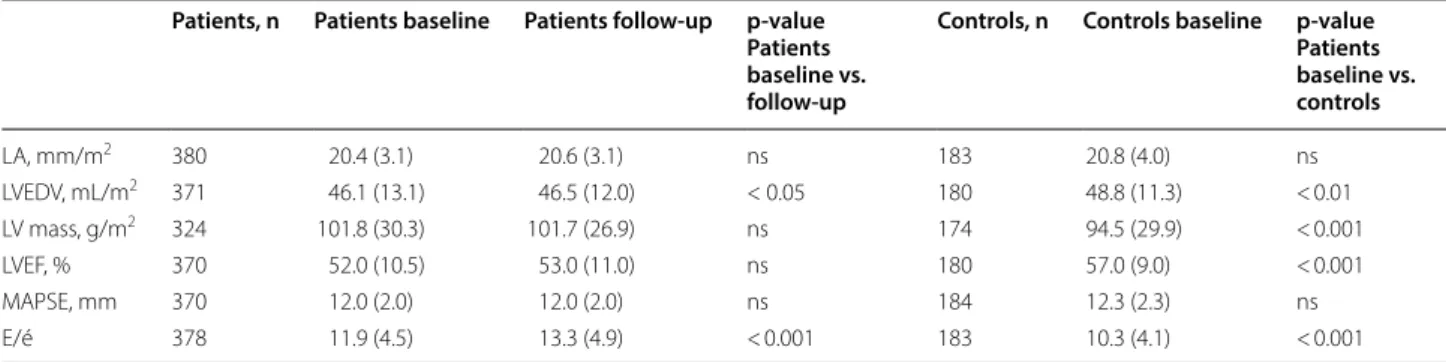
The patient group had a larger proportion of men and weighed in average 14 kg more than the control group. Due to the voluntary nature of participation in the con-trol group, they were in average 3 years older than the CARDIPP patients (Table 1). The proportion of obese participants was 45% in the patient group and 15% in the control group. The latter is very close to the level reported in the general Swedish population [22]. The T2DM patients were in general well controlled with more than eight out of ten having HbA1c values below 7%. Echocardiographic results at baseline and follow-up are presented in Table 2. The patients had higher left ventri-cle mass, lower LVEF and higher E/é than the controls. One hundred and nighty-one patients (50%) and 127 controls (69%) had normal LVEF, 34 (9%) patients and three controls (2%) had moderate or severe reduction of LVEF (≤ 41% is considered to be the cut-off for
moder-ately reduced systolic LV function).
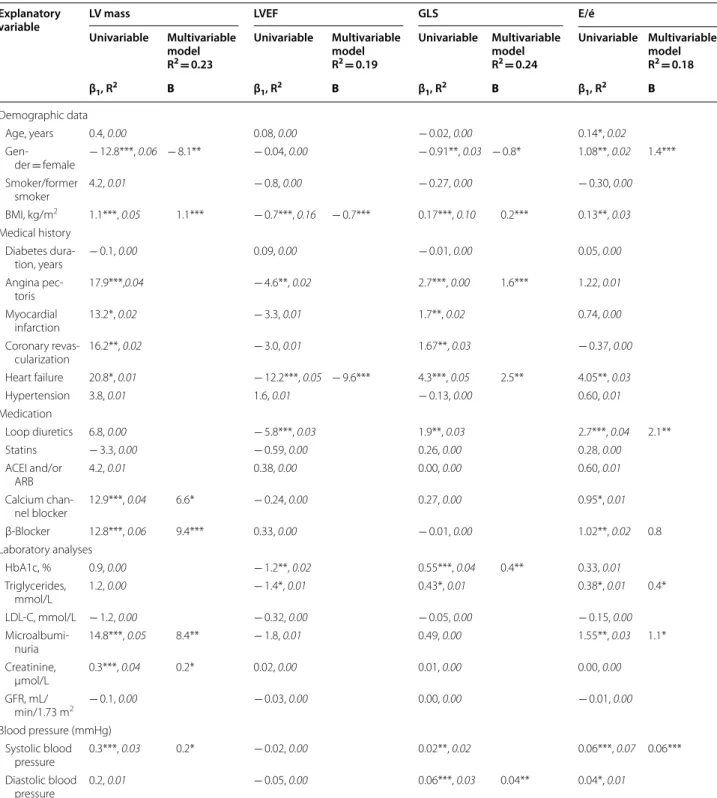
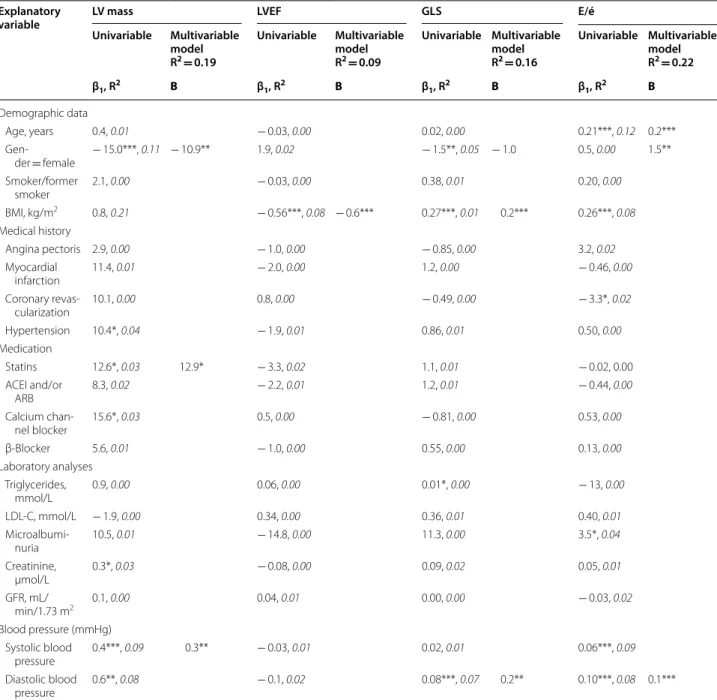
Univariable linear regression analysis showed that BMI was associated with LV mass, LVEF, GLS and E/é in patients and LVEF, GLS and E/è in controls (Tables 3,
abnormal LVEF in controls with overweight was 2.1 (95% CI 1.0–4.4) and obesity 2.1 (95% CI 0.8–5.7).
To investigate the association between weight expressed as BMI and remodelling in terms of LV size and function, the participants were divided into three groups according to BMI (Table 5). There were minor differences in demography, medical history and labo-ratory results between the BMI-groups. There were more female patients in the obese group compared to the overweight group. In the control group there were
more females in the normal weight group compared to the overweight group. The differences between the weight groups were striking in both patients and con-trols. Patients and controls with elevated BMI had impaired LV systolic function, as measured by both LVEF and GLS, compared with normal weight partici-pants (Table 5).
Overall, LVEDV and the E/é ratio increased from base-line to follow-up but on average, there was no change in LV mass or systolic function (Table 2). Patient weight was almost unchanged (increase 0.3 kg) and there were only minor changes in HbA1c, LDL, Triglycerides and creati-nine. However, patients who gained weight (i.e. increased in weight ≥ 0.3 kg from baseline to follow-up) decreased their LVEF (median and interquartile range) by − 1.0 (9.0) % (n = 187) and patients who lost weight (i.e. dropped in weight by ≥ 0.3 kg) increased their LVEF by 1.0 (10.0) % (n = 179) (p < 0.05). There were no differences in changes in LV morphology, diastolic function or blood pressure between these two groups. In addition, changes in HbA1c, LDL, triglycerides and creatinine from base-line to follow-up could not explain changes in LV mor-phology or function.
Inter-observer variability in assessing left ventricle sys-tolic function was determined towards a second, experi-enced echocardiographer, in 20 consecutive patients. The intraclass correlation (ICC), of LVEF was 0.86, MAPSE 0.95 and GLS 0.83. The coefficient of variation for LVEF was 5.0%, MAPSE 4.0% and GLS 6.9%. Interobserver bias and limits of agreement were 0.45 (− 4.79 to 5.69) for LVEF, − 0.01 (− 0.93 to 0.91) for MAPSE and 0.94 (− 1.46 to 3.34) for GLS.
Discussion
The results of this long-term, observational study of mid-dle-aged to elderly patients with T2DM and non-T2DM controls indicates that overweight and obesity are asso-ciated with impaired LV systolic function. Participants with overweight and obesity had increased LV mass, inferior LV systolic and diastolic function, as measured using LVEF, GLS and E/é, compared with the leaner par-ticipants. From both the univariable and multivariable regression analyses, we found that, irrespective of T2DM or other explanatory variables, overweight/obesity was the major risk factor for LV systolic dysfunction. Wors-ening LV systolic function was present at 4 years follow-up in the patients who had increased their BMI. These results are unique because they indicate the presence of an association between overweight/obesity and impaired LV systolic function, as measured by LVEF and GLS, in both a defined population with T2DM and a non T2DM control group.
Table 1 Baseline characteristics in patients and controls
Values are presented as numbers of participants and percent for categorical variables, and median and (interquartile range) for continuous variables ns not significant, na not applicable, BMI body mass index, ACEI angiotensin converting enzyme inhibitor, ARB angiotensin II receptor blocker, HbA1c glycosylated haemoglobin, LDL-C low-density lipoprotein cholesterol
Patients
n = 384 Controlsn = 184 p
Demographic data
Age, years 61 (5) 64 (9) < 0.001 Female, n (%) 113 (29) 91 (49) < 0.001 Smoker or former smoker, n (%) 257 (67) 91 (49) < 0.001 Height, cm 174 (12) 172 (14) ns Weight, kg 90 (19) 76 (21) < 0.001 BMI, kg/m2 30 (6) 26 (5) < 0.001
Medical history
Diabetes duration, years 6 (7) 0 na Angina pectoris, n (%) 30 (8) 3 (2) < 0.01 Myocardial infarction, n (%) 24 (6) 5 (3) ns Coronary revascularization, n (%) 25 (6) 4 (2) < 0.05 Heart failure, n (%) 8 (2) 0 na Hypertension, n (%) 253 (66) 43 (23) < 0.001 Medication
Loop diuretics, n (%) 26 (7) 0 na Statins, n (%) 230 (60) 19 (10) < 0.001 ACEI and/or ARB, n (%) 187 (49) 21 (11) < 0.001 Calcium channel blocker, n (%) 68 (18) 9 (6) < 0.001 β-Blocker, n (%) 138 (36) 25 (14) < 0.001 Laboratory analyses
HbA1c, % 5.8 (1.3) na Triglycerides, mmol/L 1.5 (1.0) 1.1 (0.8) < 0.001 Triglycerides, mg/dL 133 (88) 97 (71) < 0.001 LDL-C, mmol/L 2.5 (0.9) 3.5 (1.0) < 0.001 LDL-C, mg/dL 96 (35) 135 (39) < 0.001 Microalbuminuria, n (%) 60 (16) 7 (4) < 0.001 Creatinine, µmol/L 88 (23) 77 (20) < 0.001 Creatinine, mg/dL 1.00 (0.26) 0.87 (0.23) < 0.001 GFR, mL/min/1.73 m2 70 (20) 76 (18) < 0.001
Blood pressure (mmHg)
Obesity and LV diastolic function
Overweight and obesity were found to be associated with increased LV wall mass and the E/é ratio. This is con-sistent with the results of previous reports where obe-sity contributed to LV dilatation, hypertrophy, impaired relaxation, and diastolic dysfunction [3, 4, 8, 10]. Adipos-ity is associated with chronic volume overload resulting in increased peripheral vascular resistance. The Framing-ham Heart Study results indicated that obesity is associ-ated with an increase in LV volume, wall thickness, and mass [23].
Obesity and LV systolic function
Obesity is an established predictor of heart failure, but the extent to which it is associated with impaired LV sys-tolic function is unclear. Previous studies have shown that it is associated with LV structural remodelling, LV diastolic dysfunction and lower longitudinal myocardial deformation, but not with reduced LVEF [6–8, 24]. Over-weight has a greater effect on GLS in T2DM patients than in non-T2DM healthy subjects [7, 8]. Recently, abdominal adiposity, as measured by waist circumfer-ence, was found to be associated with impaired GLS but not decreased LVEF [10]. Our study results indicated a significant relationship between overweight/obesity and LV systolic function in terms of LVEF as well as GLS. Overweight/obesity and LVEF changes were even more closely associated than obesity and E/é changes. Several mechanisms, alone or in combination, may contribute to the impaired LV systolic function found in participants with overweight and obesity in our study. Patients with overweight and obesity had higher levels of HbA1c, com-pared with normal weight participants. Hyperglycaemia may contribute to LV mass independent of age, BMI, and blood pressure [25, 26]. High blood glucose levels induce excess intracellular calcium concentrations, which contribute to elevated blood pressure and an increase in
LV mass [27]. Hyperglycaemia may increase intra- and extra-cellular glycation of proteins that increase oxida-tive stress, inflammation and myocardial damage, aug-menting myocardial stiffness and reducing contractility [28]. However, the association between BMI and LV sys-tolic function was also seen in the control group without T2DM implying that mechanisms different from what was previously enumerated contribute to worsening myocardial function. In our study population, patients with overweight and obesity had higher triglyceride lev-els than patients with normal weight which could have a bearing on previous findings that myocardial steatosis may impair LV systolic and diastolic function [29, 30]. Microalbuminuria is associated with elevated nocturnal blood pressures and LV systolic and diastolic dysfunction in T2DM patients [31]. Hypertension often coexists with diabetes, the synergistic effect on LV diastolic function is associated with LV hypertrophy and higher LV filling pressures. Advanced hypertension may cause LV systolic dysfunction and heart failure. The T2DM patients in our study had higher blood pressure than the controls, which could have contributed to the observed differences in LV function between the groups. The added effect of hyper-tension may accelerate the LV remodelling process in dia-betic patients thus obscuring the effect of differences in BMI alone [32, 33]. The results suggest that hypertension has greater impact on LV mass and diastolic function than on LV systolic function.
The study design is crucial for what outcome can be expected. The association between obesity and LV sys-tolic function demonstrated here may be different from what has been shown in other cohorts or in studies that excluded patients with known cardiovascular disease or reduced LVEF [6, 8, 10, 24].
What is the clinical relevance of impaired LV sys-tolic function among persons with overweight and obe-sity in our study? Patients with T2DM and obeobe-sity had
Table 2 Echocardiographic results in patients at baseline and at the 4-year follow-up examination, and in controls
Data are presented as median and (interquartile range)
LA LVEDV and LV mass are indexed by body surface area, ns not significant, LA left atrium, LVEDV left ventricular end-diastolic volume, LV left ventricle, LVEF left ventricular ejection fraction, MAPSE mitral annular plane systolic excursion, E transmitral E-wave velocity, eʹ early diastolic mitral annulus velocity
Patients, n Patients baseline Patients follow-up p-value Patients baseline vs. follow-up
Controls, n Controls baseline p-value Patients baseline vs. controls
LA, mm/m2 380 20.4 (3.1) 20.6 (3.1) ns 183 20.8 (4.0) ns
LVEDV, mL/m2 371 46.1 (13.1) 46.5 (12.0) < 0.05 180 48.8 (11.3) < 0.01
LV mass, g/m2 324 101.8 (30.3) 101.7 (26.9) ns 174 94.5 (29.9) < 0.001
Table 3 Relationships between echocardiographic variables and baseline characteristics in patients, results from univariable and multivariable regression analysis
Results from univariable regression Y = β0+ β1*X + ε. Results are presented as estimated regression parameters β1 and p-values (* p < 0.05, ** p < 0.01 and *** p < 0.001) for parameters and R2. Hypothesis tested H
0: β0 and β1= 0 against H1: β0 and β1≠ 0. Note that the β0 term is not presented in the table. Final results of multivariable linear regression analysis Y =Β X + ε of LV mass, LVEF and E/é. B is the estimated vector of regression parameters in the multivariable model. ε represents the error-term in the model. Results are presented as estimated regression parameters, p-values for the parameters, and R2, the explained proportion of variation in the outcome variable by the explanatory variables. LV mass are indexed by body surface area. See abbreviations as in Tables 1 and 2
Explanatory
variable LV mass LVEF GLS E/é
Univariable Multivariable model R2= 0.23
Univariable Multivariable model R2= 0.19
Univariable Multivariable model R2= 0.24
Univariable Multivariable model R2= 0.18
β1, R2 B β1, R2 B β1, R2 B β1, R2 B
Demographic data
Age, years 0.4, 0.00 0.08, 0.00 − 0.02, 0.00 0.14*, 0.02
Gen-der = female − 12.8***, 0.06 − 8.1** − 0.04, 0.00 − 0.91**, 0.03 − 0.8* 1.08**, 0.02 1.4*** Smoker/former
smoker 4.2, 0.01 − 0.8, 0.00 − 0.27, 0.00 − 0.30, 0.00 BMI, kg/m2 1.1***, 0.05 1.1*** − 0.7***, 0.16 − 0.7*** 0.17***, 0.10 0.2*** 0.13**, 0.03
Medical history Diabetes
dura-tion, years − 0.1, 0.00 0.09, 0.00 − 0.01, 0.00 0.05, 0.00 Angina
pec-toris 17.9***,0.04 − 4.6**, 0.02 2.7***, 0.00 1.6*** 1.22, 0.01 Myocardial
infarction 13.2*,
0.02 − 3.3, 0.01 1.7**, 0.02 0.74, 0.00
Coronary
revas-cularization 16.2**, 0.02 − 3.0, 0.01 1.67**, 0.03 − 0.37, 0.00 Heart failure 20.8*, 0.01 − 12.2***, 0.05 − 9.6*** 4.3***, 0.05 2.5** 4.05**, 0.03
Hypertension 3.8, 0.01 1.6, 0.01 − 0.13, 0.00 0.60, 0.01
Medication
Loop diuretics 6.8, 0.00 − 5.8***, 0.03 1.9**, 0.03 2.7***, 0.04 2.1** Statins − 3.3, 0.00 − 0.59, 0.00 0.26, 0.00 0.28, 0.00
ACEI and/or ARB 4.2,
0.01 0.38, 0.00 0.00, 0.00 0.60, 0.01
Calcium
chan-nel blocker 12.9***, 0.04 6.6* − 0.24, 0.00 0.27, 0.00 0.95*, 0.01 β-Blocker 12.8***, 0.06 9.4*** 0.33, 0.00 − 0.01, 0.00 1.02**, 0.02 0.8 Laboratory analyses
HbA1c, % 0.9, 0.00 − 1.2**, 0.02 0.55***, 0.04 0.4** 0.33, 0.01
Triglycerides,
mmol/L 1.2, 0.00 − 1.4*, 0.01 0.43*, 0.01 0.38*, 0.01 0.4* LDL-C, mmol/L − 1.2, 0.00 − 0.32, 0.00 − 0.05, 0.00 − 0.15, 0.00
Microalbumi-nuria 14.8***, 0.05 8.4** − 1.8, 0.01 0.49, 0.00 1.55**, 0.03 1.1* Creatinine,
µmol/L 0.3***, 0.04 0.2* 0.02, 0.00 0.01, 0.00 0.00, 0.00 GFR, mL/
min/1.73 m2 − 0.1, 0.00 − 0.03, 0.00 0.00, 0.00 − 0.01, 0.00
Blood pressure (mmHg) Systolic blood
pressure 0.3***, 0.03 0.2* − 0.02, 0.00 0.02**, 0.02 0.06***, 0.07 0.06*** Diastolic blood
approximately 8% lower LVEF and controls with obesity about 4% lower LVEF than the normal weight partici-pants. Corresponding figures for GLS were 2.4% vs 2.7%. Symptoms of heart failure are often nonspecific, but a reduction in LVEF is associated with increased comor-bidity and mortality [15]. Therefore, the impairment in
LV systolic function, associated with overweight and obesity in our study is important. It may indicate an increased risk of cardiovascular events and thus a need for intensified metabolic control, adjustment of blood pressure as well as weight reduction to prevent overt heart failure [34].
Table 4 Relationships between echocardiographic variables and baseline characteristics in controls, results from univariable and multivariable regression analysis
Results from univariable regression Y = β0+ β1 *X + ε. Results are presented as estimated regression parameters β1 and p-values (* p < 0.05, ** p < 0.01 and *** p < 0.001) for parameters and R2. Hypothesis tested H
0: β0 and β1= 0 against H1: β0 and β1≠ 0. Note that the β0 term is not presented in the table. Final results of multivariable linear regression analysis Y =Β X + ε of LV mass, LVEF and E/é. B is the estimated vector of regression parameters in the multivariable model. ε represents the error-term in the model. Results are presented as estimated regression parameters, p-values for the parameters, and R2, the explained proportion of variation in the outcome variable by the explanatory variables. LV mass are indexed by body surface area. See abbreviations as in Table 1 and 2
Explanatory
variable LV mass LVEF GLS E/é
Univariable Multivariable model R2= 0.19
Univariable Multivariable model R2= 0.09
Univariable Multivariable model R2= 0.16
Univariable Multivariable model R2= 0.22
β1, R2 B β1, R2 B β1, R2 B β1, R2 B
Demographic data
Age, years 0.4, 0.01 − 0.03, 0.00 0.02, 0.00 0.21***, 0.12 0.2***
Gen-der = female − 15.0***, 0.11 − 10.9** 1.9, 0.02 − 1.5**, 0.05 − 1.0 0.5, 0.00 1.5** Smoker/former
smoker 2.1, 0.00 − 0.03, 0.00 0.38, 0.01 0.20, 0.00 BMI, kg/m2 0.8, 0.21 − 0.56***, 0.08 − 0.6*** 0.27***, 0.01 0.2*** 0.26***, 0.08
Medical history
Angina pectoris 2.9, 0.00 − 1.0, 0.00 − 0.85, 0.00 3.2, 0.02
Myocardial
infarction 11.4,
0.01 − 2.0, 0.00 1.2, 0.00 − 0.46, 0.00
Coronary
revas-cularization 10.1, 0.00 0.8, 0.00 − 0.49, 0.00 − 3.3*, 0.02 Hypertension 10.4*, 0.04 − 1.9, 0.01 0.86, 0.01 0.50, 0.00
Medication
Statins 12.6*, 0.03 12.9* − 3.3, 0.02 1.1, 0.01 − 0.02, 0.00 ACEI and/or
ARB 8.3, 0.02 − 2.2, 0.01 1.2, 0.01 − 0.44, 0.00 Calcium
chan-nel blocker 15.6*, 0.03 0.5, 0.00 − 0.81, 0.00 0.53, 0.00 β-Blocker 5.6, 0.01 − 1.0, 0.00 0.55, 0.00 0.13, 0.00
Laboratory analyses Triglycerides,
mmol/L 0.9, 0.00 0.06, 0.00 0.01*, 0.00 − 13, 0.00 LDL-C, mmol/L − 1.9, 0.00 0.34, 0.00 0.36, 0.01 0.40, 0.01
Microalbumi-nuria 10.5,
0.01 − 14.8, 0.00 11.3, 0.00 3.5*, 0.04
Creatinine,
µmol/L 0.3*, 0.03 − 0.08, 0.00 0.09, 0.02 0.05, 0.01 GFR, mL/
min/1.73 m2 0.1, 0.00 0.04, 0.01 0.00, 0.00 − 0.03, 0.02
Blood pressure (mmHg) Systolic blood
pressure 0.4***, 0.09 0.3** − 0.03, 0.01 0.02, 0.01 0.06***, 0.09 Diastolic blood
pressure 0.6**,
How valid are the LVEF results in our study? The speckle-tracking based Auto-EF method has been dem-onstrated to be reliable compared with MRI. It was also faster and had lower inter- and intra-observer variability than manual assessment by the use of the modified Simp-son’s rule [17]. The inter-observer variability was low in our study which supports the view that the measure-ments are valid.
We propose that, compared with normal weight per-sons, individuals with overweight or obesity are more prone to develop LV systolic dysfunction as measured by use of LVEF and GLS.
Long-term results
LV end-diastolic volumes and E/é values increased 4 years after the initial assessment, indicating the
presence of elevated filling pressures to the left ventricle and progressive LV diastolic dysfunction. LVEF decreased in participants who increased in weight from baseline to follow-up which further supports our finding of an asso-ciation between obesity and LV systolic dysfunction. This study was designed as an observational study. We did not intend to improve the already appropriate medical care of the participants and could not identify a subgroup of patients that improved cardiac function. However, bet-ter glycaemic control may contribute to regression of LV hypertrophy in patents with T2DM [35].
Study limitations
Our study had some limitations. There were fewer women than men in the patient population. Men with obesity are more likely to be affected by concentric
b a
Table 5 Baseline characteristics, clinical, laboratory, and echocardiographic results in persons grouped by body mass index (BMI)
I II III Significance
between groups, p < 0.05
Normal weight Overweight Obesity
BMI < 25.0 kg/m2 BMI 25.0–29.9 kg/m2 BMI
≥ 30.0 kg/m2 Patients, n = 48 Patients, n = 163 Patients, n = 173 Controls, n = 73 Controls, n = 84 Controls, n = 27
Demographic data Age, years
Patients 60.5 (2.8) 60.8 (3.1) 60.7 (3.1) ns Controls 62.9 (5.8) 63.8 (5.7) 64.5 (5.8) ns Female, n (%)
Patients 15 (31.2) 39 (23.9) 59 (34.1) II–III Controls 44 (60.3) 36 (42.8) 11 (40.7) I–II Medical history
Diabetes duration, years
Patients 6.4 (5.8) 6.4 (5.4) 6.8 (5.2) ns
Controls 0 0 0 ns
Angina, n (%)
Patients 4 (8.3) 10 (6.1) 25 (14.4) II–III
Controls 0 3 (3.6) 0 ns
Myocardial infarction, n (%)
Patients 3 (6.2) 9 (5.5) 12 (6.9) ns Controls 1 (1.4) 2 (2.4) 2 (7.4) ns Coronary revascularization, n (%)
Patients 2 (4.2) 10 (6.1) 13 (7.5) ns Controls 1 (1.4) 1 (1.2) 2 (7.4) ns Heart failure, n (%)
Patients 1 (2.1) 1 (0.6) 6 (3.5) ns
Controls 0 0 0 ns
Hypertension, n (%)
Patients 31 (64.6) 101 (62.0) 112 (64.7) ns Controls 12 (16.4) 21 (25.0) 10 (37.0) I–III Laboratory analyses
HbA1c, %
Patients 5.5 (0.9) 6.0 (1.0) 6.1 (1.0) I–II, I–III Triglycerides, mmol/L
Patients 1.2 (0.6) 1.7 (0.9) 1.9 (0.9) I–II, I–III Controls 1.3 (1.6) 1.4 (0.6) 1.6 (0.9) ns Triglycerides, mg/dL
Patients 106.2 (53.1) 150.4 (79.6) 168.1 (79.6) I–II, I–III Controls 115.0 (141.6) 123.9 (53.1) 141.6 (79.7) ns LDL-C, mmol/L
Patients 2.7 (0.7) 2.7 (0.8) 2.5 (0.6) ns Controls 3.5 (0.8) 3.4 (0.9) 3.5 (1.0) ns LDL-C, mg/dL
Patients 104.4 (27.1) 104.4 (30.9) 96.7 (23.2) ns Controls 135.3 (30.9) 131.5 (34.8) 135.3 (38.7) ns Microalbuminuria, n (%)
cardiac hypertrophy than eccentric hypertrophy while women with obesity experience both types of hyper-trophy [36]. The difference in LVEF between groups and the change over time is small and the clinical
effect was not studied. Some laboratory results were missing in individual participants in the follow-up study. Left atrial volume and left ventricle mass were assessed by use of the M-mode technique and not from
Values are mean (standard deviation) values for continuous variables and numbers (percent) for proportions. LA, LVEDV and LV mass are indexed by body surface area. See abbreviations as in Tables 1 and 2
Table 5 (continued)
I II III Significance
between groups, p < 0.05
Normal weight Overweight Obesity
BMI < 25.0 kg/m2 BMI 25.0–29.9 kg/m2 BMI
≥ 30.0 kg/m2 Patients, n = 48 Patients, n = 163 Patients, n = 173 Controls, n = 73 Controls, n = 84 Controls, n = 27
Creatinine, µmol/L
Patients 89.4 (12.8) 89.6 (18.1) 87.4 (15.8) ns Controls 73.3 (11.4) 80.6 (14.4) 85.9 (19.5) I–II, I–III Creatinine, mg/dL
Patients 1.01 (0.14) 1.01 (0.20) 0.99 (0.18) ns Controls 0.83 (0.13) 0.91 (0.16) 0.97 (0.22) I–II, I–III GFR, mL/min/1.73 m2
Patients 69.9 (8.9) 73.3 (17.1) 72.8 (16.4) ns Controls 80.0 (13.8) 76.9 (14.5) 72.9 (16.3) ns Systolic blood pressure, mmHg
Patients 132 (19) 138 (15) 138 (17) I–III Controls 124 (18) 129 (18) 139 (13) I–III Diastolic blood pressure, mmHg
Patients 76 (8) 79 (9) 77 (8) ns
Controls 71 (9) 76 (11) 80 (8) I–II, I–III Echocardiography
LA, mm/m2
Patients 20.2 (2.3) 20.5 (2.3) 20.4 (2.3) ns Controls 20.9 (2.5) 20.5 (4.0) 19.6 (3.0) ns LVEDV, mL/m2
Patients 50.2 (9.2) 48.9 (9.4) 46.6 (13.0) ns Controls 50.2 (9.2) 48.9 (9.4) 46.6 (9.9) ns LV mass, g/m2
Patients 96.7 (20.6) 102.0 (22.5) 107.1 (26.4) I–III Controls 89.9 (16.9) 100.3 (22.9) 101.5 (32.4) I–II LVEF, %
Patients 57 (8) 53 (8) 49 (9) I–II, I–III, II–III Controls 58 (6) 55 (7) 54 (8) I–II, I–III MAPSE, mm
Patients 13 (2) 12 (2) 12 (2) I–II, I–III
Controls 13 (2) 12 (2) 12 (2) ns
GLS, %
Patients − 18.6 (2.3) − 17.5 (2.3) − 16.2 (3.0) I–II, I–III, II–III Controls − 22.3 (3.0) − 20.8 (3.1) − 19.6 (4.0) I–II, I–III E/é
measurements in 2D or 3D that would have been pref-erable. Tissue velocity was recorded with color tissue Doppler instead of using pulsed tissue Doppler.
Conclusions
Overweight and obesity were associated with LV struc-tural remodeling and dysfunction in middle-aged to elderly patients with T2DM as well as in their non-diabetic controls. Compared to participants with nor-mal weight, individuals with overweight and obesity had impaired LV systolic function as measured by both LVEF and GLS. Progression in LV remodelling was seen at the 4-year follow-up in T2DM patients who had fur-ther gained weight and increased their BMI. Our study reveals that overweight and obesity are major risk factors for impaired LV systolic function.
Abbreviations
ACEI: angiotensin converting enzyme inhibitor; ARB: angiotensin II receptor blocker; BMI: body mass index; BSA: body surface area; CARDIPP: Cardiovascu-lar Risk factors in Patients with Diabetes—a Prospective study in Primary care; CAREFUL: Cardiovascular Reference Population study; E: transmitral E-wave velocity; eʹ: early diastolic mitral annulus velocity; GLS: peak global longitudi-nal strain; HbA1c: glycosylated haemoglobin; HDL: high density lipoprotein; ICC: intraclass correlation; LA: left atrium; LDL: low-density lipoprotein; LV: left ventricle; LVEDD: left ventricular end-diastolic diameter; LVEDV: left ventricular end-diastolic volume; LVEF: left ventricular ejection fraction; MAPSE: mitral annular plane systolic excursion; SD: standard deviation; T2DM: type 2 diabe-tes mellitus.
Authors’ contributions
CJÖ, TL, FHN and JE designed the study. JE contributed to acquisition of data. PB, PS, JE, MN and ME analysed and interpreted the data. MN made the statis-tical analyses. All authors participated in drafting the article. All authors read and approved the final manuscript.
Author details
1 Department of Clinical Physiology, County Hospital Ryhov, Jönköping, Sweden. 2 Department of Natural Science and Biomedicine, School of Health and Welfare, Jönköping University, Jönköping, Sweden. 3 Department of Medi-cal and Health Sciences, Linköping University, Linköping, Sweden. 4 Primary Health Care and Department of Medical and Health Sciences, Linköping University, Finspång, Sweden. 5 Futurum, Academy for Health and Care, Jönköping, Sweden. 6 Department of Internal Medicine and Department of Medical and Health Sciences, Linköping University, Norrköping, Sweden. 7 Department of Clinical Physiology, Linköping University, Linköping, Sweden. 8 Center for Medical Image Science and Visualization (CMIV), Linköping Univer-sity, Linköping, Sweden.
Acknowledgements
We would like to thank the study nurses at the primary healthcare units, Anna-Karin Sköld at the primary care administration in Linköping, and the ultrasound technicians at the Department of Clinical Physiology, Linköping.
Competing interests
The authors declare that they have no competing interests.
Availability of data and materials
The datasets used and/or analysed during the current study are available from the corresponding author on reasonable request.
Consent for publication Not applicable.
Ethics approval and consent to participate
The study protocol complied with the Declaration of Helsinki and was approved by the Regional Ethical Review Board in Linköping, M26-05, T80-06. Each subject provided written informed consent before inclusion into the study.
Funding
This work was supported by grant support from FORSS, the Research Council of Southeastern Sweden, by the Swedish Heart–Lung foundation, and by grants from the King Gustaf V and Queen Victoria Freemason Foundation, Sweden.
Publisher’s Note
Springer Nature remains neutral with regard to jurisdictional claims in pub-lished maps and institutional affiliations.
Received: 4 June 2018 Accepted: 3 August 2018
References
1. World Health Organization (WHO). http://www.who.int/media centr e/ facts heets /fs311 /en. Accessed 18 May 2018.
2. Caleyachetty R, Thomas GN, Toulis KA, Mohammed N, Gokhale KM, Bal-achandran K, et al. Metabolically healthy obese and incident cardiovascu-lar disease events among 3.5 million men and women. J Am Coll Cardiol. 2017;70:1429–37.
3. Cil H, Bulur S, Turker Y, Kaya A, Alemdar R, Karabacak A, et al. Impact of body mass index on left ventricular diastolic dysfunction. Echocardiogra-phy. 2012;29:647–51.
4. Loehr LR, Rosamond WD, Poole C, McNeill AM, Chang PP, Folsom AR, et al. Association of multiple anthropometrics of overweight and obesity with incident heart failure: the Atherosclerosis Risk in Communities study. Circ Heart Fail. 2009;2:18–24.
5. Ndumele CE, Matsushita K, Lazo M, Bello N, Blummenthal RS, Gerstenblith G, et al. Obesity and subtypes of incident cardiovascular disease. J Am Heart Assoc. 2016. https ://doi.org/10.1161/JAHA.116.00392 1. 6. Wang YC, Liang CS, Gopal DM, Ayalon N, Donohue C, Santhanakrishnan
R, et al. Preclinical systolic and diastolic dysfunctions in metabolically healthy and unhealthy obese individuals. Circ Heart Fail. 2015;8:897–904. 7. Suto M, Tanaka H, Mochizuki Y, Mukai J, Takada H, Soga F, et al. Impact
of overweight on left ventricular function in type 2 diabetes melitus. Cardiovasc Diabetol. 2017;16:145–53.
8. Ng ACT, Prevedello F, Dolci G, Roos CJ, Djaberi R, Bertini M, et al. Impact of diabetes and increasing body mass index category on left ventricular systolic and diastolic function. J Am Soc Echocardiogr. 2018. https ://doi. org/10.1016/j.echo.2018.02.012.
9. Elkhader BA, Abdulla AA, Ali Omer MA, Fagiri MA, Mahmoud MZ. The impact of obesity on the left ventricular ejection fraction using echocar-diography. OJMI. 2014;4:172–7.
10. Russo C, Sera F, Jin Z, Palmieri V, Homma S, Rundek T, et al. Abdominal adi-posity, general obesity, and subclinical systolic dysfunction in the elderly: a population-based cohort study. Eur J Heart Fail. 2016;18:537–44. 11. Ofstad AP, Urheim S, Dalen H, Orvik E, Birkeland KI, Gullestad L, et al.
Identification of a definite diabetic cardiomyopathy in type 2 diabetes by comprehensive echocardiographic evaluation: a cross-sectional comparison with non-diabetic weight-matched controls. J Diabetes. 2015;7:779–90.
12. Garcia MJ, McNamara PM, Gordon T, Kannel WB. Morbidity and mortality in diabetics in the Framingham population sixteen year follow-up study. Diabetes. 1974;23:105–11.
13. Jorgensen PG, Jensen MT, Mogelvang R, von Scholten BJ, Bech J, Fritz-Hansen T, et al. Abnormal echocardiography in patients with type 2 diabetes and relation to symptoms and clinical characteristics. Diab Vasc Dis Res. 2016;13:321–30.
•fast, convenient online submission •
thorough peer review by experienced researchers in your field
• rapid publication on acceptance
• support for research data, including large and complex data types
•
gold Open Access which fosters wider collaboration and increased citations maximum visibility for your research: over 100M website views per year •
At BMC, research is always in progress.
Learn more biomedcentral.com/submissions
Ready to submit your research? Choose BMC and benefit from:
15. Blomstrand P, Engvall M, Festin K, Lindström T, Länne T, Maret E, et al. Left ventricular diastolic function, assessed by echocardiography and tissue Doppler imaging, is a strong predictor of cardiovascular events, superior to global left ventricular longitudinal strain, in patients with type 2 diabe-tes. Eur Heart J Cardiovasc Imaging. 2015;16:1000–7.
16. Jennersjö P, Guldbrand H, Björne S, Länne T, Fredrikson M, Lindström T, et al. A prospective observational study of all-cause mortality in relation to serum 25-OH vitamin D3 and parathyroid hormone levels in patients with type 2 diabetes. Diabetol Metabol Syndr. 2015. https ://doi. org/10.1186/s1309 8-015-0049-9.
17. Frederiksen CA, Juhl-Olsen P, Hermansen JF, Andersen NH, Sloth E. Clinical utility of semi-automated estimation of ejection fraction at the point-of-care. Heart Lung Vessel. 2015;7:208–16.
18. Rundqvist L, Engvall J, Faresjö M, Carlsson E, Blomstrand P. Regular endurance training in adolescents impacts atrial and ventricular size and function. Eur Heart J Cardiovasc Imaging. 2017;18:681–7.
19. Kukulski T, Voigt JU, Wilkenshoff UM, Strotmann JM, Wranne B, Hatle L, et al. A comparison of regional myocardial velocity information derived by pulsed and color Doppler techinques: an in vitro and in vivo study. Echocardiography. 2000;17:639–51.
20. Nagueh SF, Smiseth OA, Appleton CP, Byrd BF 3rd, Dokainish H, Edvardsen T, et al. Recommendations for the evaluation of left ventricular diastolic function by echocardiography: an update from the American Society of Echocardiography and the European Association of Cardiovascular Imag-ing. Eur Heart J Cardiovasc ImagImag-ing. 2016;17:1321–60.
21. Lang RM, Badano LP, Mor-Avi V, Afilalo J, Armstrong A, Ernande L, et al. Recommendations for cardiac chamber quantification by echocardiogra-phy in adults: an update from the American Society of Echocardiograechocardiogra-phy and the European Association of Cardiovascular imaging. J Am Soc Echocardiogr. 2015;28:1–39.
22. The Public Health Agency of Sweden. https ://www.folkh alsom yndig heten .se/folkh alsor appor terin g-stati stik/folkh alsan s-utvec kling /levna dsvan or/overv ikt-och-fetma /. Accessed 18 May 2018.
23. Cheng S, Xanthakis V, Sullivan LM, Xanthakis V, Sullivan LM, Lieb W, et al. Correlates of echocardiographic indices of cardiac remodeling over the adult life course: longitudinal observations from the Framingham Heart Study. Circulation. 2010;122:570–8.
24. Kishi S, Armstrong AC, Gidding SS, Colangelo LA, Venkatesh BA, Jacobs DR Jr, et al. Association of obesity in early adulthood and middle age with incipient left ventricular dysfunction and structural remodeling: the CARDIA study (Coronary Artery Risk Development in Young Adults). J Am Coll Cardiol Heart Fail. 2014;2:500–8.
25. Barbagello M, Gupta RK, Resnick LM. Cellular ions in NIDDM. Rela-tion of calcium to hyperglycemia and cardiac mass. Diabetes Care. 1996;19:1393–13989.
26. Kozakova M, Morizzo C, Fraser AG, Palombo C. Impact of glycemic control on aortic stiffness, left ventricular mass and diastolic longitudinal func-tion in type 2 diabetes mellitus. Cardiovasc Diabetol. 2017. https ://doi. org/10.1186/s1293 3-017-0557-z.
27. Li J, Wu N, Li Y, Ye K, He M, Hu R. Cross-sectional analysis of serum calcium levels for association with left ventricular hypertrophy in normocalcemia individuals with type 2 diabetes. Cardiovasc Diabetol. 2015;29(14):43. 28. Berg TJ, Snorgaard O, Faber J, Torjesen PA, Hildebrandt P, Mehlsen J, et al.
Serum levels of advanced glycation end products are associated with left ventricular diastolic function in patients with type 1 diabetes. Diabetes Care. 1999;22:1186–90.
29. Ng AC, Delgado V, Bertini M, van der Meer RW, Rijzewijk LJ, Hooi Ewe S, et al. Myocardial steatosis and biventricular strain and strain rate imaging in patients with type 2 diabetes mellitus. Circulation. 2010;122:2538–44. 30. Jorgensen PG, Jensen MT, Biering-Sorensen T, Mogelvang R, Galatius S,
Fritz-Hansen T, et al. Cholesterol remnants and triglycerides are associ-ated with decreased myocardial function in patients with type 2 diabetes. Cardiovasc Diabetol. 2016;15:137.
31. Liu JE, Robbins DC, Palmieri V, Bella JN, Roman MJ, Fabsitz R, et al. Association of albuminuria with systolic and diastolic left ventricular dysfunction in type 2 diabetes: the Strong Heart Study. J Am Coll Cardiol. 2003;41:2022–8.
32. Russo C, Jin Z, Homma S, Rundek T, Elkind MS, Sacco RL, et al. Effect of diabetes and hypertension on left ventricular diastolic function in a high-risk population without evidence of heart disease. Eur J Heart Fail. 2010;12:454–61.
33. De Jong KA, Czeczor JK, Sithara S, McEwen K, Loopaschuk GD, Appelbe A, et al. Obesity and type 2 diabetes have additive effects on left ventricular remodelling in normotensive patients—a cross sectional study. Cardio-vasc Diabetol. 2017;16:21.
34. Johansen OE, Gullestad L, Blaasaas KG, Orvik E, Birkeland I. Effects of structured hospital-based care compared with standard care for Type 2 diabetes—the Asker and Baerum Cardiovascular Diabetes Study, a randomized trial. Diabet Med. 2007;24:1019–27.
35. Felicio JS, Ferreira SR, Plavnik FL, Moisés V, Kohlmann O, Ribeiro AB, et al. Effect of blood glucose on left ventricular mass in patients with hyper-tension and type 2 diabetes mellitus. Am J Hypertens. 2000;13:1149–54. 36. Rider OJ, Lewandowski A, Nethononda R, Petersen SE, Francis JM, Pitcher