AUSTRALIAN JOURNAL OF BASIC AND
Open Access Journal
Published BY AENSI Publication
© 2016 AENSI Publisher All rights reserved
This work is licensed under the Creative Commons Attribution
http://creativecommons.org/licenses/by/4.0/
To Cite This Article: M. Antony Robert Raj and S. Abirami Quad Tree. Aust. J. Basic & Appl. Sci., 10(2
Offline Tamil Handwritten Character Recognition using Statistical based
Quad Tree
1M. Antony Robert Raj and 2S. Abirami
1Department of Information Science and Technology, Anna University, Chennai 2
Department of Information Science and Technology, Anna Universit
Address For Correspondence:
M. Antony Robert Raj, Department of Information Science E-mail: [email protected]
A R T I C L E I N F O Article history:
Received 04 December 2015 Accepted 22 January 2016 Available online 14 February 2016
Keywords:
Quad Tree, Chain Code, SVM.
‘Semmozhi’ Tamil is a South Indian language which is spoken by the state Tamilnadu and various countries such as Srilanka, Malaysia, Singapore and so on. Computerizing Tamil language, is a highly demanded task, due to its increasing demand in the world. This work has been done i
were completed successfully in literatures through character through pen tip movement was less. is a toughest task due to high variation of
Several necessary handwritten documents are existing and coming up, which has to be recognized further processing.
The structure of Tamil character is highly complex because of its curvy nature.
language also consistsof numerous amount of characters (247) which includes 18 consonants, 12 vowels, 216 combinational characters and one special character.
due to its complex structure, unnecessary loops, slanting characters and so on. In generally, THCR has been implemented
Raj, M. and S. Abirami, 2012) way of recognition has been structural has been done based on the
literatures statistically (Antony Robert Raj,
AUSTRALIAN JOURNAL OF BASIC AND
APPLIED SCIENCES
ISSN:1991-8178 EISSN: 2309-8414 Journal home page: www.ajbasweb.com
© 2016 AENSI Publisher All rights reserved
This work is licensed under the Creative Commons Attribution International License (CC BY).
http://creativecommons.org/licenses/by/4.0/
M. Antony Robert Raj and S. Abirami., Offline Tamil Handwritten Character Recognition using Statistical based 2): 103-109, 2016
Offline Tamil Handwritten Character Recognition using Statistical based
Department of Information Science and Technology, Anna University, Chennai – 600 025 Department of Information Science and Technology, Anna University, Chennai – 600 025
Department of Information Science and Technology, Anna University, Chennai – 600 025
A B S T R A C T
This work presents a novelty with the combination of statistical and structural feature extraction algorithms which are represented in a hierarchical form by PM
offline Tamil hand written character recognition, the feature extraction phase pl crucial role due to the nature of character structure and dependencies of writers. Tamil language contains naturally tough character structure and its complexity levels are enormous which includes more curves and loops, where the writers creating more difficulties when they are writing. This paper is concentrated on the locational analysis to locate place of the character structures. The originality of this works lies on the statistical analysis used for analyzing the pixel points available in the chara
this pixel values are hierarchically represented by the PM
structure further simplified as vector values which suitable for classification algorithm. This features are evaluated with the classification algorithm Suppor
(SVM) to predict the correct character. The statistical analysis, pixel densities and its locational factors are handled differently in tree format, where the feature caps are minimized by reducing the Quad tree length. This combination is
recognition result when comparing our previous statistical algorithms.
INTRODUCTION
outh Indian language which is spoken by the state Tamilnadu and various countries such as Srilanka, Malaysia, Singapore and so on. Computerizing Tamil language, is a highly demanded task, due to its increasing demand in the world. This work has been done in two ways online and offline. Many works literatures through online fashion because the complex rate of recognizing character through pen tip movement was less. In this context, Offline Tamil Handwritten Recognition (THCR)
toughest task due to high variation of writer’s style and complex characteristics of Tamil language s Several necessary handwritten documents are existing and coming up, which has to be recognized
ure of Tamil character is highly complex because of its curvy nature.
numerous amount of characters (247) which includes 18 consonants, 12 vowels, 216 combinational characters and one special character. Probability of misclassification among characters is more
complex structure, unnecessary loops, slanting characters and so on.
has been implemented in two ways, statistical and structural. Statistical way of recognition has been executed based on the pixel variation
the shape and directions. Several works have been attempted for Antony Robert Raj, M. and S. Abirami, 2013) as well as structurally.
Offline Tamil Handwritten Character Recognition using Statistical based
Offline Tamil Handwritten Character Recognition using Statistical based
600 025.
This work presents a novelty with the combination of statistical and structural feature extraction algorithms which are represented in a hierarchical form by PM-Quad tree. In offline Tamil hand written character recognition, the feature extraction phase plays crucial role due to the nature of character structure and dependencies of writers. Tamil language contains naturally tough character structure and its complexity levels are enormous which includes more curves and loops, where the writers creating more difficulties when they are writing. This paper is concentrated on the locational analysis to locate place of the character structures. The originality of this works lies on the statistical analysis used for analyzing the pixel points available in the character image, this pixel values are hierarchically represented by the PM-Quad tree algorithm. This structure further simplified as vector values which suitable for classification algorithm. eatures are evaluated with the classification algorithm Support Vector Machine (SVM) to predict the correct character. The statistical analysis, pixel densities and its locational factors are handled differently in tree format, where the feature caps are minimized by reducing the Quad tree length. This combination is bringing good recognition result when comparing our previous statistical algorithms.
outh Indian language which is spoken by the state Tamilnadu and various countries such as Srilanka, Malaysia, Singapore and so on. Computerizing Tamil language, is a highly demanded task, due n two ways online and offline. Many works online fashion because the complex rate of recognizing ritten Recognition (THCR) racteristics of Tamil language structure. Several necessary handwritten documents are existing and coming up, which has to be recognized in future for
ure of Tamil character is highly complex because of its curvy nature. In addition to it, the numerous amount of characters (247) which includes 18 consonants, 12 vowels, 216 among characters is more
In structural attempt, direction of the various character shapes 2013) have been analyzed and extracted
each character’s subdivided image to extract its direction. But addressing the characters. Hence,
Abirami, 2013) has been attempted
complexity, 30 characters were experimented successfully. Later, Zoning and Junction (Antony Robert Raj, code based shape direction has been
Here, results highly depend on zoning,
another work, sub-line direction and bounding box techniques junction based feature division (Shyni, S.M.,
a statistical concept zoning. The challenges still to be considered further. Various statistical algorithms (Antony Robert Raj,
location, and axis based pixel locati
missed to fulfill the needs to consider more focused to provide solution on the issues which
In the work of A.N. Sigappi et al background to ink transition were extracted
classification algorithm Hidden Markov Model was applied characters.
Pixel density values were used as a features in few research works
Shanthi, N. and K. Duraiswami, 2007; Rajashekararadhya, S.V. and P. VanajaRanjan, 2009)
values calculated as features from various block divisions (zone). Pixel density values were extracted by N. Shanthi, K. Duraiswami in their work and applied SVM to classify the correct characters from 34 different Tamil handwritten characters.
Rajashekararadhya et al (2008)
concepts like image and zone centroid, pixel density and projection distance metrics and P. VanajaRanjan, 2009; Rajashekararadhya, S.V. and P. VanajaRanjan, 2008
P. VanajaRanjan, 2008) based features extraction procedure were applied on zoning procedure to extract those features. Neural network classification concepts was used to classi
The originality of this works combine
statistical concept pixel density calculation is used to locate the features concepts, quad tree representation is used
the concentration mainly focusses on the shape of location, where variation of the with density calculation and location
sections, section 2 represents the steps
preprocessing and feature extraction and classification works are discussed. In sect are analyzed. Finally section 5 concludes the work with future extensions
Steps Of Thcr System:
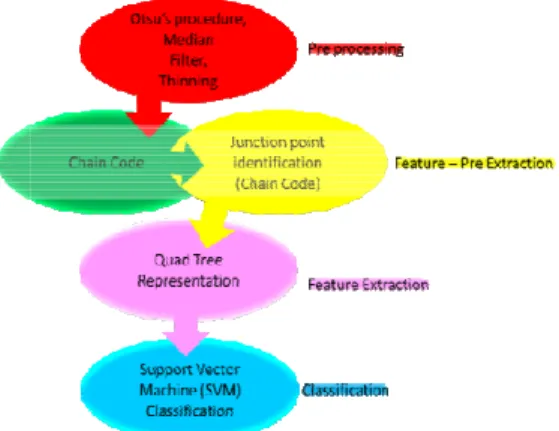
Several steps areinvolved in this work
feature extraction and classification. The following figure (figure 1) shows the steps of the process
Fig. 1: Phases of THCR system.
In structural attempt, direction of the various character shapes (Antony Robert Raj,
extracted as features, where eight directional chain code algorithm is appl to extract its direction. But directional features alone might not zone based locational features extraction (Antony Robert Raj,
empted to get good recognition results. In this paper, by considering low 30 characters were experimented successfully.
Antony Robert Raj, M. and S. Abirami, 2014) based feature division and chain direction has been examined and chosen as features in THCR in one of our earlier work
depend on zoning, and the achievement gets minimized due to structural variation. In line direction and bounding box techniques has been employed in addition to zoning and Shyni, S.M., 2015). Here also the most of the feature variation depends only on a statistical concept zoning. The challenges still to be considered further.
Antony Robert Raj, M. and S. Abirami, 2015) like pixel based pixel location and so on were experimented in earlier works, but tho
to consider more variety of handwritten styles. So this research has been mainly focused to provide solution on the issues which are missed in existing works.
et al, the statistical features such as vertical projection profile, word profile and
background to ink transition were extracted as features from varying strokes in Tamil characters structures. The Markov Model was applied on those features for predicting the correct
re used as a features in few research works (Shanthi N. and Duraiswami, K., 2010; Shanthi, N. and K. Duraiswami, 2007; Rajashekararadhya, S.V. and P. VanajaRanjan, 2009)
from various block divisions (zone). Pixel density values were extracted by N. Shanthi, K. Duraiswami in their work and applied SVM to classify the correct characters from 34 different
(2008) were employed zoning concept to select the features and various statistical concepts like image and zone centroid, pixel density and projection distance metrics (Rajashekararadhya, S.V. Rajashekararadhya, S.V. and P. VanajaRanjan, 2008; Rajashekararadhya, S.V. and based features extraction procedure were applied on zoning procedure to extract those features. Neural network classification concepts was used to classify the characters.
combines the advantages of statistical and structural features statistical concept pixel density calculation is used to locate the features whereas to address
, quad tree representation is used as a hierarchical representation to represent the located features. Here on the shape of location, where variation of the characterhas been addressed calculation and location based problem are adjusted with quad tree representation. In further the steps involved. Section 3 describes the proposed system, where the preprocessing and feature extraction and classification works are discussed. In section 4, results and discussion
concludes the work with future extensions.
in this work to implement THCR. They are pre-processing, pre nd classification. The following figure (figure 1) shows the steps of the process
Antony Robert Raj, M. and S. Abirami, as features, where eight directional chain code algorithm is applied on directional features alone might not be suitable in Antony Robert Raj, M. and S. In this paper, by considering low
based feature division and chain in THCR in one of our earlier works. s minimized due to structural variation. In in addition to zoning and . Here also the most of the feature variation depends only on
like pixel counts, pixel based , but those things has also research has been mainly
, the statistical features such as vertical projection profile, word profile and n Tamil characters structures. The se features for predicting the correct
Shanthi N. and Duraiswami, K., 2010; Shanthi, N. and K. Duraiswami, 2007; Rajashekararadhya, S.V. and P. VanajaRanjan, 2009), where the density from various block divisions (zone). Pixel density values were extracted by N. Shanthi, K. Duraiswami in their work and applied SVM to classify the correct characters from 34 different
employed zoning concept to select the features and various statistical Rajashekararadhya, S.V. Rajashekararadhya, S.V. and based features extraction procedure were applied on zoning procedure to extract those
statistical and structural features. Here in the whereas to address the structural the located features. Here characterhas been addressed are adjusted with quad tree representation. In further . Section 3 describes the proposed system, where the ion 4, results and discussion
Proposed Methodology:
As we employed in our previous works M. and S. Abirami, 2015; Antony Robert Raj,
median filter and thinning algorithm have been utilized junction point based eight directional proc
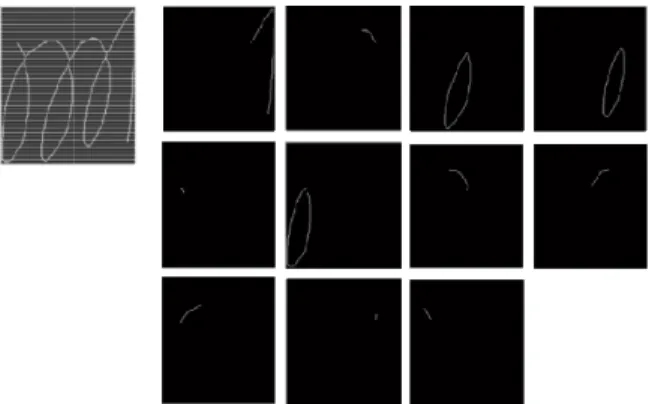
pre-features which extracted using the chain code
Fig. 2: Sample pre-features extracted after junction point identification
In this paper, as statistical features, a the image (Shanthi, N. and Duraiswami, K., 2010 represented in tree format (i.e) Structural representation
Feature Extraction – Quad Tree formation:
The character image has been
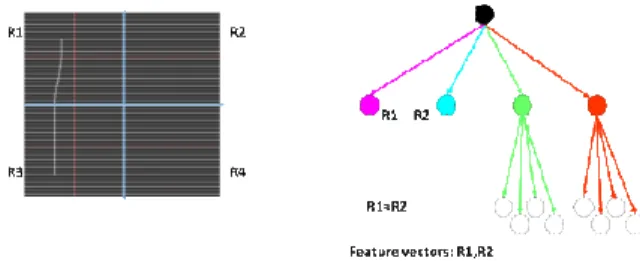
further sub divided into 4 equal parts. Pixel density values are calculated in each square parts. The subpart which contains maximum densities has been taken as filled node of tree, noted as R2 as shown in figure 3. This node of the tree cannot be subdivided. Each squ
squares as shown figure 3, noted as x1, x2, x3 and x4. This squares have been checked pixel values are available. If available
subpart R4 as shown in figure 3.
Fig. 3: Quad tree formation test.
The vectors are calculated as per pixel values noted in the tree using breadth first search algorithm. For example, in figure 3, the fixed node which c
contain lesser pixels (R4(x2, x4)) are considered as features. In get tree formation.
Procedural Algorithm:
Input: Subpart of character Image
Step1 : Divide each subpart in to 4 squares.
Step2 : Calculate density values of each subpart (D1, D2, D3, D4). Step3 : If there is no such density value
Exit
Step4 : if there is a density value Follow any of the formation 1, 2, 3 or 4
Output: Subpart of character image and pixel densities of each subpart (D1, D2, D3, D4)
our previous works (Antony Robert Raj, M. and S. Abirami, 2014; Antony Robert Raj, Abirami, 2015; Antony Robert Raj, M. and S. Abirami, 2013), in preprocessing,
median filter and thinning algorithm have been utilized to obtaina neat and skeletonized image. junction point based eight directional procedure has been appliedas pre-feature extraction
features which extracted using the chain code has been shown in figure 2.
extracted after junction point identification.
features, average pixel density values are calculated from the whole subpart of and Duraiswami, K., 2010) values, using this density values the subpart of the image is format (i.e) Structural representation.
Quad Tree formation:
has been pre-extracted (sub divided) as shown in figure 2. Each subpart is squarely divided into 4 equal parts. Pixel density values are calculated in each square parts. The subpart which contains maximum densities has been taken as filled node of tree, noted as R2 as shown in figure 3. This node of the tree cannot be subdivided. Each square except the filled node of tree is further divided into four squares as shown figure 3, noted as x1, x2, x3 and x4. This squares have been checked again to find
pixel values are available. If available, it is marked in appropriate node in the tree, denoted as x2 and x4 in
The vectors are calculated as per pixel values noted in the tree using breadth first search algorithm. For example, in figure 3, the fixed node which contains high pixel density values (R2) and other sub nodes which pixels (R4(x2, x4)) are considered as features. In a different scenario various way are utilized to
: Divide each subpart in to 4 squares.
Calculate density values of each subpart (D1, D2, D3, D4). such density value in any block, then
in any of the blocks, then of the formation 1, 2, 3 or 4
Output: Subpart of character image and pixel densities of each subpart (D1, D2, D3, D4)
Abirami, 2014; Antony Robert Raj, in preprocessing, Otsu’s procedure, neat and skeletonized image. Next to that, feature extraction process. The sample
verage pixel density values are calculated from the whole subpart of the subpart of the image is
extracted (sub divided) as shown in figure 2. Each subpart is squarely divided into 4 equal parts. Pixel density values are calculated in each square parts. The subpart which contains maximum densities has been taken as filled node of tree, noted as R2 as shown in figure 3. This are except the filled node of tree is further divided into four again to find whether any e tree, denoted as x2 and x4 in
Formation 1:
Hardly few pixels (as shown in figure) are found in any subpart, then the tree formation will not be extended from the first division of tree. Mark that particular subpart alone
vector is taken from the tree representation • If any one of the various density
o Mark the corresponding leaf (either R1 or R2 or R3
o Set vector R1 or R2 or R3 or R4 as shown in figure 4
Fig. 4: Feature formation 1.
Formation2:
If two or more subparts contain equal or probably equal weightage. Therefore in the tree formation, those sub nodes this sub nodes will be acted as features or feature vectors
Fig. 5: Feature formation 2.
• If any two or more of the region’s density
o Mark those nodes as leaf and features
o Set those leaf nodes as feature vectors as shown in figure 5
Formation3:
If the all subparts consistsof equal density values,
this situation, the top nodes are further subdivided into four leaf node further. All leaf nodes will act as feature values as shown in figure 6 • If (D1≈D2≈D3≈D4), then
o Mark all nodes as leaf as features
o Set feature vectors (R1,R2,R3,R4) as shown in figure 6
Fig. 6: Feature formation 3.
Formation4:
If different densities are obtained highest density value would lead the inherited further. Later, the remaining Then the child leaf node which contain
vector formation using breadth first search as shown in figure 3.
Hardly few pixels (as shown in figure) are found in any subpart, then the tree formation will not be first division of tree. Mark that particular subpart alone to act as features. Only one feature
tree representation
density (D1, D2, D3, D4) is few then, leaf (either R1 or R2 or R3 or R4) as features Set vector R1 or R2 or R3 or R4 as shown in figure 4 to show dense.
If two or more subparts contain equal or probably equal amount of density, then those nodes in the tree formation, those sub nodes cannot be decomposed further as this sub nodes will be acted as features or feature vectors as represented in figure 5.
the region’s density (D1, D2, D3, D4) are equal or probably equal, then Mark those nodes as leaf and features
vectors as shown in figure 5
equal density values, then each of the nodeswould get
further subdivided into four leaf nodes, then the tree cannot be proceeded . All leaf nodes will act as feature values as shown in figure 6
nodes as leaf as features
vectors (R1,R2,R3,R4) as shown in figure 6
are obtained in different subparts of the image, then the subpart which co lead the initial feature vector. As we discussed earlier that subpart alone will not Later, the remaining subparts are further subdivided into four equal parts as x1, x2, x3, and x4. Then the child leaf node which contains pixels would be taken as feature nodes and it is considered for feature vector formation using breadth first search as shown in figure 3.
Hardly few pixels (as shown in figure) are found in any subpart, then the tree formation will not be act as features. Only one feature
, then those nodes attain equal cannot be decomposed further as shown in figure,
(D1, D2, D3, D4) are equal or probably equal, then
get an equal weightage. In , then the tree cannot be proceeded
• If pixel has been found in any two or more subparts (R1, R2, R3, R4), then
o Calculate the pixel densities of each
o If any (D1, D2, D3, D4) < average density, then Take that node as feature (Example R2 in figure 3) Divide other subparts into 4 equal parts
If pixel has been found in any of them, then
• Mark the location in the appropriate leaf node of the Repeat until all nodes are visited
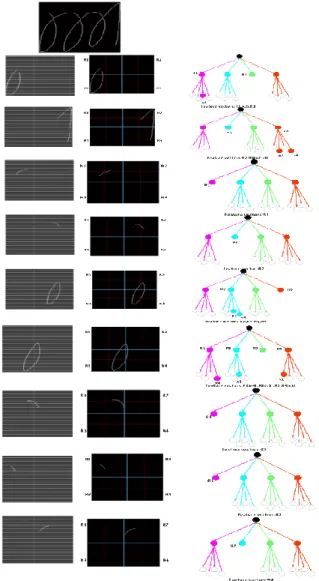
o Set vectors (R2, R4(x2,x4) for the subpart As per the formationsdiscussed above
in figure 7. The feature vectors are represented in the leaf node of the quad tree representation shown for every sub part image.
Classifier:
Support Vector Machine (SVM) Shanthi, N. and Duraiswami, K., 2010
classify the correct character. It is used to separate the class in feature space f(x)=sign(Weight_factor data + bias values), where the classes pr
the margin is maximized then the prediction rate failures minimized. But here 28 classes insisted to get the predicted results. Multiclass SVM algorithm is implemented with Lagrangian Th
implemented using one vs all (OVA) procedure to predict the classification results. Training and Te samples are taken from 100 samples of 28 characters. The samples are extracted in the form of feature vectors,which are generated by quad tree formations.
Fig. 7: Sample features extracted from the character ‘
found in any two or more subparts (R1, R2, R3, R4), then Calculate the pixel densities of each (example D1, D2, D3, D4) subparts
D4) < average density, then Take that node as feature (Example R2 in figure 3)
Divide other subparts into 4 equal parts (as shown in figure 3) found in any of them, then
in the appropriate leaf node of the tree (figure 3) Repeat until all nodes are visited
for the subpart as shown in figure 3
sdiscussed above the features gathered for the character ‘ ’ ha
The feature vectors are represented in the leaf node of the quad tree representation shown for every
Support Vector Machine (SVM) (Antony Robert Raj, M. and S. Abirami, 2015
and Duraiswami, K., 2010), a statistical supervising learning method is used to analyze the data and classify the correct character. It is used to separate the class in feature space f(x)=sign(Weight_factor
data + bias values), where the classes predicted using the margin width through positive and negative zone. If the margin is maximized then the prediction rate failures minimized. But here 28 classes insisted to get the predicted results. Multiclass SVM algorithm is implemented with Lagrangian Theorem, which has been implemented using one vs all (OVA) procedure to predict the classification results. Training and Te samples are taken from 100 samples of 28 characters. The samples are extracted in the form of feature
quad tree formations.
Sample features extracted from the character ‘ ’.
has been entirely shown The feature vectors are represented in the leaf node of the quad tree representation shown for every
Input data images have been collected from the HP data set and handwritten characters of multiple people. 100 samples of each 28 characters
chosen for training samples and 50 samples of the same characters have been collected for testing samples. 88.25% results has been achieved for all 28 characters. These results have
statistical algorithms and proved that the present results has overcome
table1 and figure 8 show the success rate of this work and also the comparison results
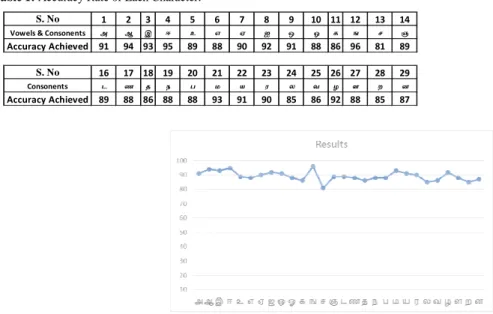
Table 1: Accuracy Rate of Each Character.
Fig. 8: Accuracy graph for each character
Also, comparative analysis has been done with our previous algorithm, which shows algorithm has achieved success by eliminating
been marked in red as shown in figure 9.
Fig. 9: Comparative results with our existing works
Robert Raj, M. and S. Abirami, 2015
Conclusion:
The quad tree based formation using density calculation is highly complexity and variations. With the help of SVM
individual rate of the character level recognition results has been achieved from this work
• Quad tree formation to point the location of the pixels • This does not depend on structure shape
• Structure complexity has been reduced • Considered the minimum level of variations
Further research is continued to address more shapes
S. No 1 2 3 4 5
Vowels & Consonents அ ஆ இ ஈ உ
Accuracy Achieved 91 94 93 95 89
S. No 16 17 18 19 20
Consonents ட ண த ந ப
Accuracy Achieved 89 88 86 88 88
RESULTS AND DISCUSSION
Input data images have been collected from the HP data set and handwritten characters of multiple people. 100 samples of each 28 characters (vowels + Consonants) (Vidhu Bhala, R.V. and
chosen for training samples and 50 samples of the same characters have been collected for testing samples. 88.25% results has been achieved for all 28 characters. These results have been compared with all our previous
proved that the present results has overcome our past failures table1 and figure 8 show the success rate of this work and also the comparison results are shown
each character tested.
omparative analysis has been done with our previous algorithm, which shows
by eliminating the problems found in the previous algorithms. The success shown in figure 9.
results with our existing works (Antony Robert Raj, M. and S. Abirami, 2014 Abirami, 2015; Shyni, S.M., 2015).
The quad tree based formation using density calculation is highly supported to consider structural complexity and variations. With the help of SVM classifier, success rate has been increased to 88% over all, but
of the character level recognition results has been improved. The following advantages has been
point the location of the pixels ot depend on structure shape of the characters
has been reduced Considered the minimum level of variations
Further research is continued to address more shapes and more number of characters.
6 7 8 9 10 11 12 13 14
எ ஏ ஐ ஒ ஓ க ங ச ஞ
88 90 92 91 88 86 96 81 89
21 22 23 24 25 26 27 28 29
ம ய ர ல வ ழ ள ற ன
93 91 90 85 86 92 88 85 87
Input data images have been collected from the HP data set and handwritten characters of multiple people. S. Abirami, 2012) are chosen for training samples and 50 samples of the same characters have been collected for testing samples. compared with all our previous our past failures also. The following
are shown in figure 9.
omparative analysis has been done with our previous algorithm, which shows that our present previous algorithms. The success has
Abirami, 2014; Antony
supported to consider structural , success rate has been increased to 88% over all, but improved. The following advantages has been
REFERENCES
Antony Robert Raj, M. and S. Abirami, 2012. A Survey on Tamil Handwritten Character Recognition using OCR techniques. The Second International Conference on Computer Science, Engineering and Applications (CCSEA), 05: 115-127.
Antony Robert Raj, M. and S. Abirami, 2013. Analysis of Statistical Feature Extraction Approaches used in Tamil Handwritten OCR. 12th Tamil Internet Conference- INFITT, 144-150.
Antony Robert Raj, M. and S. Abirami, 2014. Offline Tamil Handwritten Character Recognition using Chain Code and Zone Based Features. 13th Tamil Internet Conference- INFITT, 28-34.
Abirami, S. and D. Manjula, 2009. Feature String Based Intelligent Information Retrieval from Tamil Document Images. International Journal of Computer Applications in Technology – Special Issue on Computer Applications in Knowledge Based Systems, Inter-science Publishers, 35(2/3/4): 150–164.
Antony Robert Raj, M. and S. Abirami, 2015. Offline Tamil Handwritten Character Recognition Using Statistical Features”. AENSI Journals, Advances in Natural and Applied Sciences, 9(6): 367-374.
Shyni, S.M., M. Antony Robert Raj and S. Abirami, 2015. Offline Tamil Handwritten Character Recognition Using Sub Line Direction and Bounding Box Techniques.Indian Journal of Science and Technology, 8(S7): 110–116.
Antony Robert Raj, M. and S. Abirami, 2013. Hybrid Features based Offline Tamil Handwritten Character Recognition”. 14th International Tamil Internet Conference, ISSN: 2313 - 4887: 360-370.
Nibaran Das, Jagan Mohan Reddy, Ram Sarkar, SubhadipBasu, MahantapasKundu and MitaNasipuri., 2012. A statistical–topological feature combination for recognition of handwritten numerals”, ElsevierApplied Soft Computing, 12: 2486–2495.
Shanthi Nand Duraiswami, K., 2010. A Novel SVM -based Handwritten Tamil character recognition system”, Springer, Pattern Analysis & Application, 13(2): 173-180.
Rajashekararadhya, S.V., P. Vanaja Ranjan and V.N. Manhunath Aradhya, 2008. Isolated Handwritten Kannada and Tamil Numeral Recognition: A Novel Approach, First IEEE International Conference on Emerging Trends in engineering and Technology, Page(s): 1192-1195.
Rajashekararadhya, S.V. and P. VanajaRanjan, 2008. Efficient Zone based Feature Extraction Algorithm for Handwritten Numeral Recognition of Four Popular south Indian Scripts. International Journal of Theoretical and Applied Information Technology, 1171 – 1181.
Shanthi, N. and K. Duraiswami, 2007. Performance Comparison of Different Image size for Recognizing unconstrained Handwritten Tamil character using SVM, Journal of Computer Science, 3(9-3): 760-764.
Rajashekararadhya, S.V. and P. VanajaRanjan, 2009. Zone-Based Hybrid Feature Extraction Algorithm for Handwritten Numeral Recognition of two popular Indian Script. World Congress on Nature & Biologically Inspired Computing, page(s): 526 – 530.
Sigappi, A.N., S. Palanivel and V. Ramalingam, 2011. Handwritten Document Retrieval System for Tamil Language”, International Journal of Computer Application, ISSN: 0975-8887, 31(4): 42-47.
Rajashekararadhya, S.V. and P. VanajaRanjan, 2008. Neural Network Based Handwritten Numeral Recognition of Kannada and Telugu Script. IEEE TENCON Conference, 1-5.
http://lipitk.sourceforge.net/hpl-datasets.htm