Australian Journal of Basic and Applied Sciences
ISSN:1991-8178Journal home page: www.ajbasweb.com
Corresponding Author: N.A. Abidullah, Faculty of Electrical Engineering, Universiti Teknikal Malaysia Melaka, UTeM
Experimental Evaluation for Power Quality Analysis System
N.A. Abidullah, N.H. Shamsudin, A.R. Abdullah
Faculty of Electrical Engineering, Universiti Teknikal Malaysia Melaka, UTeM
A R T I C L E I N F O A B S T R A C T
Article history:
Received 30 September 2014 Received in revised form 17 November 2014 Accepted 25 November 2014 Available online 13 December 2014
Keywords:
harmonic distortion, laboratory experiments, voltage sag, experimental evaluation
Background: In this rapid changing world, power quality problem becomes indispensable to a modern high technology living. The problem resort to massive fault occurrences and economic losses to power supply system. Crucially, the proper actions should be taken to mitigate this problematic issue. The experimental evaluation for power quality analysis system in terms of performance in measurements and PQ detection through numerous laboratory experiments is feasible by using Fluke 43B power quality analyser (PQA). Several set-ups with components are constructed for PQ measurements, sag and harmonic signal detection. The PQ measurements data collection inclusive of voltage, current, real power, reactive power, apparent power and power factor has prompted the measurement accuracy assessments. The voltage sag and harmonic distortion are induced for testing the PQA ability in identifying the signal problems for experimental evaluation.
© 2014 AENSI Publisher All rights reserved. To Cite This Article: N.A. Abidullah, N.H. Shamsudin, A.R. Abdullah, Experimental Evaluation for Power Quality Analysis System. Aust. J. Basic & Appl. Sci., 8(24): 227-239, 2014
INTRODUCTION
Many users are unable to work off the usage of electricity in their daily routine life. Indeed, it is hard to imagine life without the electricity as a means of living.
The all-pervading of electrical appliances may rise of power quality amongst users (Mohibullah, 2012). The deviations of voltage, current or frequency from its constant magnitude and ideal sinusoidal waveform can induce failure in any sensitive electric equipment. These issues have always been present in the power supply system, but they are not in the limelight until recently due to the intensified usage of power electronic gadgets. Since the control system equipped in the devices can be malfunctioned due to the varying supply conditions, this justify that the modern electronic devices in electrical system are more sensitive to PQ issues than those from the olden days (Femine, 2008). For instance, the proper operation of high technology electricity dependent devices and instruments depends on the voltage quality supplied to them (Fuchs, 2011).
One or more combinations of testing, i.e. laboratory experiment, simulation, or on-site testing are applied by the researchers in (Abdullah, 2014) for verifying the competency of their works. Majority of these researchers have set up the laboratory experiments to examine their system based on the signals produced by the laboratory equipment. In simulation verification mode, the signals are injected to the system through the programmable Agilent 6811B AC Power Source/Analyser (José, 2011) and IPC (Yin, 2009). There are also some researchers (Chen, 2012; Chompoo-Inwai, 2013), who have tested their projects through on-site testing with the intention to study the system endurance in real world situations.
The data collection from the standard reference meters (Femine, 2008; Chompoo-Inwai,, 2013; Pradhan, 2014) and PQ monitoring instruments proposed are required for the assessment and comparison purposes. Accuracy and efficiency of the proposed system are computed by comparing the supplied value with the measured value obtained through a series of testing. If the value analysed fall in the range permitted by the standards, then the system’s standard compliance is justified.
Experimental setup:
Types of experiments conducted in this paper include PQ measurements, sag signal test and harmonic signal test.
PQ Measurements:
The process flow of the experiments is illustrated in Fig. 1. Firstly, measurements of the six parameters identified, i.e. voltage, current, real power, reactive power, apparent power and power factor, are performed with the aid of PQA until reaching the maximum allowable motor input.
Fig.1: Flowchart for measurement.
Rotational losses of the motor are measured and information about its magnetization current can be obtained through no load test (Chapman, 2012), but in this paper, these parameters and information are not the main concern. The only concern is voltage, current, real power, reactive power, apparent power and power factor that can be produced by the motor. Table I shows the induction motor rating, as specified on its nameplate.
Table I: Specifications for three phase squirrel cage induction motor
Voltage 220/380 V ∆/Y
Current 4.7/2.7 A ∆/Y
Power 1100 W
Power Factor 0.8
Speed 2800 rpm
Frequency 50 Hz
Fig.2 gives an overview on the simplified circuit connection for a three phase induction motor no load test. Variable AC supply to the delta-connected stator winding of the motor is also connected on phase to phase basis to PQA. This measurement method gives the value of line voltage and current supplied to the motor. The electric circuit is shown in Fig.3.
PQA
Adjustable
Power Supply 3 Phase Motor
R
Y
B
Fig. 2: Block diagram for no load test .
Rotor Stator
L1
L2
L3 Variable AC
Voltage
Fig. 3: Electric circuit for no load test.
Sag Signal Test:
Sag signal testing is summarized in Table II. In case 1, six motors are necessary as the voltage drop in a single motor is not large enough to be identified as voltage sag. The number has reduced to four motors with the addition of RLC load in case 2 because the voltage drop in this combination of load is classifiable as voltage sag. A squirrel cage induction motor with transformer is used for the three phase sag signal test in case 3.
The specifications of the three phase induction motor, single phase capacitor run motors and dynamometers are tabulated in Table I, TableIII and Table IV respectively.
Table II: Cases in Sag Signal Test.
Case Load Number of Motor
1 Single phase capacitor run motor 6
2 Single phase capacitor run motor with RLC load 4
3 Three phase squirrel cage induction motor with transformer 1
Table III: Specifications for Single Phase Capacitor Run Motor
Output 175 W
Rated Speed 1415 rpm
Rated Voltage 240 V
Full Load Current 1.15 A
Frequency 1 ~ 50 Hz
Table IV: Specifications For Dynamometer
Input 24 Vdc
Output 175 W
Rated Speed 0 – 2500 rpm
Rated Torque 0 – 3 Nm
The block diagram for case 1 is illustrated in Fig.4. The connection of measuring instruments is such that they can capture the voltage sag signal occurring at supply during the motor starting.
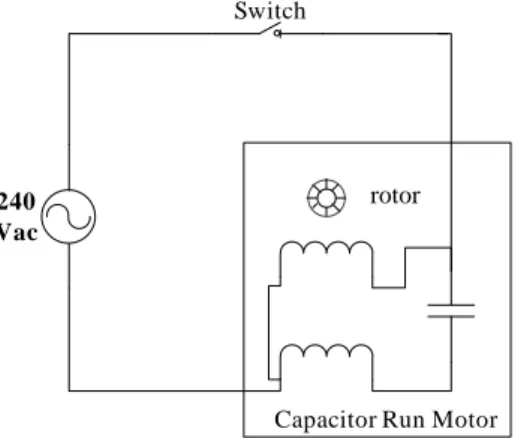
Fig.5 presents the practical circuit. All the motors are connected in parallel to the variable AC voltage source, where the source is adjusted and fixed to 240V throughout the experiment. Transmission line module of zero resistance is used as the switch for the circuit, so that the electricity does not flow through the motors once the supply is turned on. Each motor is coupled to a dynamometer and each dynamometer is powered with 24Vdc accordingly.
The set-up is then modified by adding RLC load in parallel with the capacitor run motors. Four stations with four motors and RLC loads are utilized and the procedure is the same as the previous experiment. Block diagram and electrical circuit for case 2 are represented in Fig.6 and Fig.7 respectively.
transformer is connected to the supply while the transformer output is connected to the star-delta motor starter, where the motor starter served as a switch to turn on or off the three phase motor. The desired signals are acquired with PQA at the supply terminals.
Once the motor is turned on, the PQA had begun to record the signals from the supply. At the moment of initiating motor starter, the star-connected motor began to function thus the required signals are captured successfully.
PQA
Supply Load
L
N Switch
Fig. 4: Block diagram for single phase single phase capacitor run motor .
Capacitor Run Motor 240
Vac
Switch
rotor
Fig. 5: Electric circuit for single phase capacitor run motor.
PQA
Supply RLC
Load
L
N Switch Motor
Fig. 6: Block diagram of single phase capacitor run motor with RLC load.
R1 C1
Capacitor Run Motor 240
Vac
Switch
L1
rotor
PQA
Supply StarterMotor
R
Y Transformer 3 Phase
Motor
B
Fig. 8: Block diagram for three phase motor .
0 240 480 0 240 480 0 240 480 L1 N L2 L3 480 240 0 480 240 0 0 480 240 0 C1 O/L X X X X X X R Y B
R R R R R Y Y Y Y Y B B B B B R Y B
U1 V1 W1
U2 V2 W2
Fig. 9: Electric circuit for three phase motor.
Harmonic Signal Test:
The conditions of each case are tabulated in Table V. Single phase full wave controlled rectifier with different load conditions and firing angles are tested in case 1 to case 3. Case 4 utilized the set ups in Fig.8 and Fig.9 to determine the harmonics in motor.
Table V: Cases in Harmonic Signal Test.
Case Type Load (Ω) Firing angle ()
R L C
1 RLC load 4800 1200 2400 100.5
2 RLC load 686 4800 4800 50.6
3 RLC load 686 4800 4800 50.6 →100.5
4 Three phase induction motor with transformer - - - - PQA Supply Load L N Power Thyristor V I N
Fig. 10: Block diagram for full wave controlled rectifier experiment.
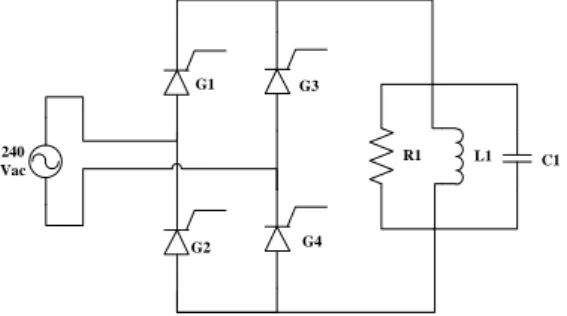
240 Vac G1 G2 G3 G4 L1 R1 C1
Fig.11: Electric circuit for full wave controlled rectifier.
power thyristors and RLC load is connected in parallel and powered through 240Vac supply. The supply is adjusted and maintained at 240V throughout the experiment. Similar with other experiments in this paper, PQA is used for the harmonics measurement.
Fig.11 reveals the experiment circuit for full wave controlled rectifier. The firing angle of thyristors is adjustable through the controller connected to the power thyristor module. Initially, all the loads and controller angle are set to zero.
RESULTS AND DISCUSSIONS
The experimental evaluation has assisted the PQA capability test in measurement. The signal parameters and measurements in terms of voltage, current, real power, reactive power, and apparent power have been displayed and recorded in PQA.
Then, voltage sag signal and harmonic signal in both single phase and three phase loads are considered. The implementation of distinctive loads in each set up has resulted in the power quality problem mentioned.
Performance of PQ Measurements:
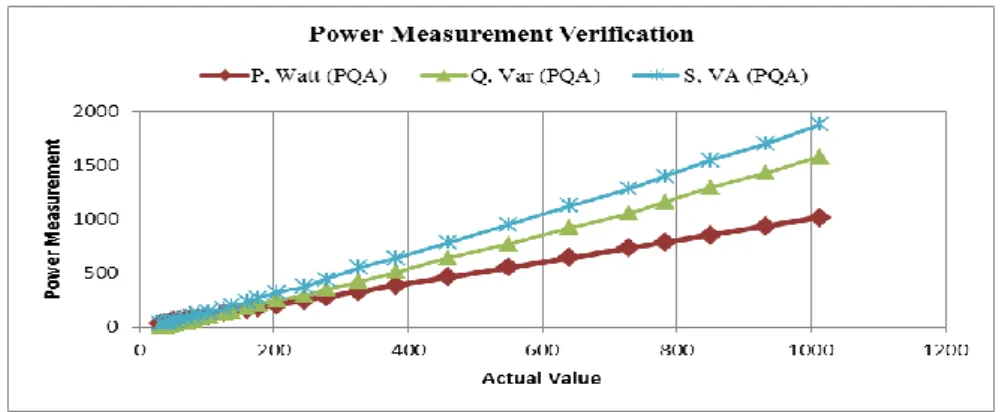
Data of six different parameters from the experiment is illustrated in Fig. 12, Fig. 13 and Fig. 14. The voltage measured by PQA increased linearly in Fig. 12. The voltage increased gradually as a result of increasing the motor supply by 10V after each measurement. In Fig.13, the generated current is gradually increased measured by PQA. Fig.14 illustrates the graph for real power (P), reactive power (Q), and apparent power (S) measured by PQA. All parameters are shown to increase exponentially. These three parameters exhibit similar rising pattern.
Fig. 12: Voltage Verification
Fig. 14: Power Measurement Verification.
Voltage Sag Detection Analysis:
The application of voltage before and during the sag as the nominal and remaining voltage in the equation (1) provides the percentage of voltage drop. An event can be classified as voltage sag if and only if the percentage of voltage drop is more than 10%.
% 100 V
V V
(%) V
al min no
remaining al
min no
drop
(1)
Case 1:
At the moment of closing the switch, the voltage rapidly dropped unlike the current increased. After that, the voltage rose back to a constant voltage of 231.6V, whereas the current remained constant at 4.27A. Voltage and current trend described can be found in Fig.15.
As for the voltage signal in Fig. 16, the decrement starts from 237.5V to 208.5V before increasing to 231.6V. Thus, the magnitude of sag is 12.21% as calculated from equation (1). This satisfied the definition of sag given by IEEE, i.e. the magnitude of sag should be 10% to 90% of the nominal voltage.
Fig. 15: Voltage and Current Trend by PQA .
Sag
Fig. 16: Voltage sag by PQA.
Case 2:
The magnified voltage waveform is shown in Fig.18. Following the initiation of motors, the supply voltage of 237.8V fell greatly to 212.7V, but it succeeded in ascending to 226.3V. The calculation from equation (1) shows the percentage of sag is 10.56%, proving that the supply is indeed experiencing voltage sag.
Fig. 17: Voltage and Current Trend for Motor and RLC Load by PQA.
Sag
Fig. 18: Voltage sag by PQA.
Case 3:
In Fig.19, the supply remained constant until the initiation of motor starter. As soon as the motor started to function, the voltage signal experienced a sharp drop in its value and instantaneously falls to 238.5V whereas the current gradually increased to 0.663A. When the motor is still running, the voltage and current remained unchanged, i.e. the values recorded continuously are 238.5V and 0.663A.
The magnified voltage trend of Fig.19 is given in Fig.20. First, 240V is measured prior to the motor starting. It is then sag to 215.8V during motor starting. The resulted percentage of voltage drop due to motor starting is 10.08%, which satisfied the requirement of IEEE for a signal to be classified as sag. After dropping to 215.8V, the voltage instantaneously stabilized to 238.5V.
Fig. 19: Voltage and Current Trend by PQA
Sag
Harmonic Detection Analysis:
Harmonic distortion signals are investigated through single phase full wave controlled rectifier and three phase motor. The rationale of considering three cases in full wave controlled rectifier is to associate the relationship between firing angle, distinctive loads, and total harmonic distortion (THD). Contrarily, the harmonic signals in three phase motor are acquired only during the motor running mode.
Case 1:
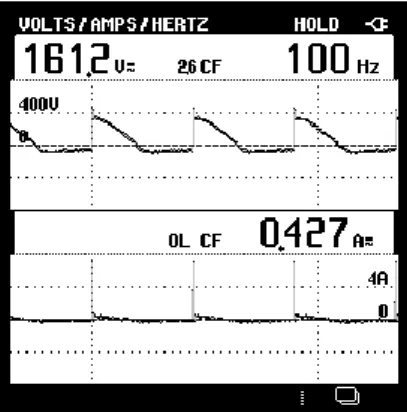
Fig.21 presents that the combination of such RLC load has resulted in 242.6V and 0.93A. The waveforms and the value measured for voltage and current can be found in Fig.1. These waveforms are not of perfect sinusoidal wave shape due to the presence of harmonic components in the waveforms. Fig.22 depicts the voltage harmonic spectrum recorded by PQA. The spectrum trend, where the magnitude at 100Hz is the highest then it fall sharply at 200Hz. After that, it exhibits a steady declining trend.
Aside from spectrums for voltage signal, PQA have also recorded the spectrums for current signal. The magnitude increased gradually until 300Hz, and then it fluctuated in a wave-like trend as shown in Fig.23.
Fig. 21: Voltage and current waveforms.
Fig. 22: Spectrums and THD for voltage .
Case 2:
The reading of 231.7V and 0.509A are recorded as soon as the RLC load is connected to the system. In Fig.24, the voltage and current signals as recorded by PQA. The trapezoidal-shaped voltage signals are recorded by PQA. The current signals appeared as a combination of impulse and low magnitude sine wave.
The voltage harmonic spectrums in Fig.25 increased slightly from 0Hz to 100Hz. It is then declined rapidly at 200Hz and from there onwards, it continued to decline gradually.
The current spectrums for case 2 are presented in Fig.26. Generally, the magnitude at 100Hz is the highest among all the other magnitudes. The constant magnitude at 200Hz and 300Hz dropped slightly at 400Hz, then they remained constant with no fluctuation pattern.
Fig. 24: Voltage and current waveforms.
Fig. 25: Spectrums and THD for voltage.
Fig. 26: Spectrums and THD for current.
Case 3:
The voltage spectrums in Fig.28 show great resemblance in term of their magnitude variation pattern. The highest magnitude occurred at 100Hz, followed by 0Hz and 200Hz. Then, the magnitude, starting from 300Hz, decreased steadily.
After the decreasing pattern that occurred at 200Hz and 300Hz, the current spectrums in Fig.29 have remained constant. The lowest and highest magnitude of the spectrums is found at 0Hz and 100Hz respectively.
Fig. 27: Voltage and current waveforms.
Fig. 28: Spectrums and THD for voltage.
Fig. 29: Spectrums and THD for current.
Case 4:
The voltage and current output waveforms are presented in Fig.30. PQA have recorded wave shapes for both voltage and current. The peak values of PQA voltage waveforms are -340V and 340V, whereas for current waveforms are -0.9A and 0.9A.
Only first order of voltage harmonic spectrum and voltage power spectrum are presented in Fig.31. PQA indicates that 1.0% of THDV occurred in the supply.
Fig. 30: Voltage and current waveforms.
Fig. 31: Spectrums and THD for voltage.
Fig. 32: Spectrum and THD for current.
Conclusion:
The reliability of electricity is measured based upon power quality problem that is generated in a form of signal parameters and measurements. Through that, the experimental evaluation of PQA consisting with five different types of setup is set out using FLUKE 43B PQA. The PQA capability test in measurement, sag and harmonic signal displays and records the voltage, current, real power, reactive power, and apparent power for analysis evaluation. The sag and harmonic signal captured in PQA instruments give great result for experiment evaluation of power quality analysis system.
ACKNOWLEDGMENT
REFERENCES
Mohibullah, Laskar, S.H., 2012. ―Power Quality Issues and Need of Intelligent PQ Monitoring in the Smart Grid Environment,‖ Universities Power Engineering Conference (UPEC), 2012 47th International, pp: 1–6.
Femine, A.D., D. Gallo, C. Landi and M. Luiso, 2008. ―Performance Analysis of Power Quality Monitoring Instruments,‖ Instrumentation and Measurement Technology Conference Proceedings, 2008. IMTC 2008. IEEE, pp: 2026–2031.
Fuchs, E.F. and M.A.S. Masoum, 2011. ―Unified Power Quality Conditioner (UPQC),‖ in Power Quality in Power Systems and Electrical Machines, 1st ed., Academic Press, pp: 443.
Abdullah, A.R., N.A. Abidullah, N.H. Shamsudin, N.H.H. Ahmad and M.H. Jopri, 2014. ―Power Quality Signals Classification System using Time-frequency Distribution,‖ Applied Mechanics and Materials, (494– 495): 1889–1894.
José, J., G. De, J.M.S. Fernández and A. Agüera-pérez, 2011. ―HOS-based Virtual Instrument for Power Quality Assessment,‖ (2): 1–5.
Yin, P.Y., M.V. Chilukuri and S. Member, 2009. ―Remote Power Quality Monitoring and Analysis System Using LabVIEW Software,‖ no. May, pp: 5–7.
Chen, C., 2012. ―Virtual Multifunction Power Quality Analyzer Based on Adaptive Linear Neural Network,‖ Industrial Electronics, IEEE Transactions on, 59(8): 3321–3329.
De Apráiz, M., J. Barros and R.I. Diego, 2013. ―Detection and Analysis of Transient Disturbances in A Low Voltage Supply System,‖ Applied Measurements for Power Systems (AMPS), 2013 IEEE International Workshop, pp: 35–39.
Chompoo-Inwai, C. and J. Mungkornassawakul, 2013. ―A Smart Recording Power Analyzer Prototype Using LabVIEW and Low-Cost Data Acquisition (DAQ) in Being a Smart Renewable Monitoring System,‖ 2013 IEEE Green Technologies Conference (GreenTech), pp: 49–56.
Legarreta, A.E., J.A. Bortolin and J.H. Figueroa, 2011. ―An IEC 61000-4-30 Class A — Power Quality Monitor: Development and Performance Analysis,‖ Electrical Power Quality and Utilisation (EPQU), 2011 11th International Conference, pp: 1–6.
Pradhan, D., L. Lakshminarayanan and V. Patil, 2014. ―A LabVIEW Based Power Analyzer,‖ Advances in Energy Conversion Technologies (ICAECT), 2014 International Conference on, pp: 67–71.