Determining the Relationship Between Drinking Private
Well Water and Children's Blood Lead Levels
Abhishek Komandur
A technical report submitted to the faculty at the University
of North Carolina at Chapel Hill in partial fulfillment of the
requirements for the degree of Master of Science in Public
Health in the Environmental Sciences and Engineering
Department in the School of Public Health.
The University of North Carolina at Chapel Hill
April, 2019
Approved:
Dr. Jacqueline Macdonald Gibson
Dr. Louise Ball
Determining the Relationship Between
Private Well Water Consumption and
Children's Blood Lead Levels
April 12, 2019
Over the past 50 years, the U.S. Environmental Protection Agency (EPA) and other governmental organizations have developed regulations to decrease the population's exposure to lead, which is a potent neurotoxin with no con-rmed threshold dose. However, as recent events in Flint, Michigan and other areas have demonstrated, lead exposure through drinking water is still a prominent concern. Lead adversely impacts health when consumed through drinking water, but no research has yet been done to investigate the relation-ship between human health outcomes and exposure to lead in drinking water from private wells. Private wells are not covered by the Safe Drinking Water Act, and private well water consumption could lead to increased exposure to lead and other heavy metals. To better understand this relationship, we conducted a study to determine the relationship between lead contamination in private wells in North Carolina and children's blood lead levels (BLLs). Blood lead samples were collected from 23 children relying on private wells in Orange, Wake, and Chatham Counties as of this time, along with water and dust samples from their respective households. We have found that (1) 14% of households have lead in at least one water sample that exceeded the EPA action level of 15 parts per billion, (2) BLLs were all below the Centers for Disease Control's action level of 5μg/dL, and (3) the model currently used to
Acknowledgements
Contents
1 Introduction 8
2 Methods 9
2.1 Objective 1: Systematic Literature Review . . . 9
2.1.1 Search Strategy . . . 9
2.1.2 Inclusion Criteria and Study Selection . . . 10
2.2 Objective 2: Field Study of Lead in Water, Dust, and Blood . . . 10
2.2.1 Sample Population . . . 10
2.2.2 Data Collection . . . 10
2.2.3 Water Sampling and Analysis . . . 11
2.2.4 Dust Sampling and Analysis . . . 11
2.2.5 Blood Sampling and Analysis . . . 11
2.2.6 Statistical Analysis . . . 11
2.2.7 Bivariate Analysis of Factors Inuencing Blood Lead . . . 12
2.3 Objective 3: Validation of IEUBK Model on the Basis of Field Study Results 12 3 Results 13 3.1 Objective 1: Systematic Literature Review Results . . . 13
3.2 Objective 2: Field Study Results . . . 16
3.2.1 Participant Characteristics . . . 16
3.2.2 Sample Results . . . 18
3.2.3 Bivariate Analysis Results . . . 18
3.2.4 Regression Analysis Results . . . 18
3.3 IEUBK Analysis Results . . . 19
4 Discussion 21 4.1 Objective 1: Systematic Literature Review . . . 21
4.2 Objective 2: Field Study . . . 22
4.3 Objective 3: IEUBK Assessment . . . 22
4.4 Limitations . . . 23
5 Conclusion 23
6 Supporting Information Available 25
List of Tables
1 Search Strings and Results . . . 9 2 Selected Limit of Detection Values . . . 12 3 Characteristics of 11 Studies Directly Measuring Water Lead Levels and
Blood Lead Levels . . . 15 4 Blood lead levels by selected sociodemographic, parental, and
environmen-tal characteristics . . . 17 5 Measured lead levels in blood, water, and dust . . . 18 6 Distribution of the Cumulative Water Lead Exposure Index (CWLEI) . . 18 7 Ordinary Least Squares Regression Results . . . 19 8 Description and justication of IEUBK parameters (adapted from Deshommes
List of Figures
1 Results of the Literature Review Process . . . 14 2 IEUBK Predicted Blood Lead Levels vs. Measured Blood Lead Levels . . 20 3 IEUBK Predicted Blood Lead Levels Using Only Water, Dust, and Air
1 Introduction
Lead is a known toxicant with no safe level of exposure [18]. Exposure to lead is commonly measured using blood lead levels as a biomarker [17]. Children under the age of 6 are still developing and especially vulnerable to lead exposure since they absorb more ingested lead than adults do, which can result in IQ decreases and other neurological eects[5, 6, 7, 8, 9]. As a result, the Centers for Disease Control (CDC) recently lowered the elevated blood lead reference level to 5 µg/dL in 2012. However, previous research has indicated that even blood lead levels below this reference level are associated with decreases in IQ during early childhood[6, 7].
Lead exposure in the United States has decreased signicantly since the ban of lead use in gasoline and paint[1]. As a result, mean blood levels have continuously decreased from 1.65 to 0.83 micrograms per deciliter between 1999 and 2014 in the United States[25]. In recent years, much of the literature has found that the major source of lead exposure in children comes from dust and paint chips [2, 3, 4, 5]. However, as recent events in Flint, Michigan have shown, lead exposure through water is still a very prominent concern.
This is particularly concerning for people who rely on private water systems as their primary source of drinking water. Private water systems, such as private wells, are dened as nonpublic systems which service fewer than 25 people daily at least 60 days of the year, or that have fewer than 15 service connections[11]. These water systems are used as the primary drinking water source for approximately 14% of the United States population [12]. North Carolina in particular has over 2.4 million people that rely on private wells[15]. This is important since the Safe Drinking Water Act does not regulate water quality in private water systems and does not require water testing for private well owners [12]. North Carolina requires that all private wells constructed since 2008 must be tested for bacterial and chemical contaminants within 30 days of well construction completion, but these are the only tests that are required[51]. Previous research conducted on North Carolina private wells in Wake County has found elevated lead in 28% of houses served by private wells [19].
To our knowledge, no studies have analyzed the correlations between lead-contaminated private well water and measured blood lead in the United States. Previously conducted studies have looked at the relationship between lead in community water supplies and children's blood lead levels [9, 10, 27]. However, it is dicult to extrapolate relationships found from many of these studies due to dierences in sample population, background lead exposure, water consumption and water-drawing behaviors, etc.
The objectives of this research project are to characterize the relationship between lead in private well water and lead in children's blood through (1) literature review, (2) eld study of the relationship between children's blood lead and water lead for children under age 7 that drink water from private wells, and (3) assessment of the IEUBK Model's accuracy on the basis of eld study results.
2 Methods
2.1 Objective 1: Systematic Literature Review
A systematic literature review of the association between lead in water and lead in blood was conducted according to the Preferred Reporting Items for Systematic Reviews and Meta-Analyses (PRISMA) guidelines[42]. The review protocol was registered with PROSPERO (registration number CRD42017058717).
2.1.1 Search Strategy
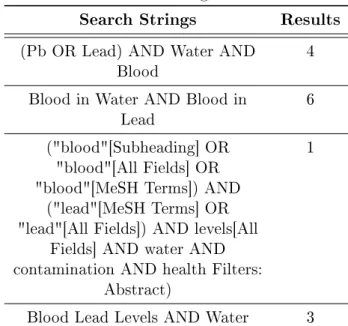
Papers were systematically searched for using Google Scholar, Jama Network, and Pubmed. Medical subject headings were also used to search the National Center for Biotechnology Information's database (Table 1). Other search strings returned high rates of duplicate results, and thus were not utilized in the search process. Additional papers from non-database sources were found by searching through the citations of the previously found studies, as well as by nding papers that referenced them.
Table 1: Search Strings and Results
Search Strings Results
(Pb OR Lead) AND Water AND
Blood 4
Blood in Water AND Blood in
Lead 6
("blood"[Subheading] OR "blood"[All Fields] OR "blood"[MeSH Terms]) AND
("lead"[MeSH Terms] OR "lead"[All Fields]) AND levels[All
Fields] AND water AND contamination AND health Filters:
Abstract)
1
2.1.2 Inclusion Criteria and Study Selection
In order to qualify for this systematic literature review, papers must have been published after 1997. This is the year in which systems were mandated to fully comply with the Lead and Copper Rule and `install optimal corrosion control treatment' [40]. Papers must have also assessed the relationship between the concentration of lead in drinking water and the concentration of lead in blood. This includes papers that assess water as a source of lead exposure in conjunction with other sources. Papers must have focused on humans.
One reviewer conducted an abstract and text screen for all studies found in order to assess their eligibility for the systematic literature review.
2.2 Objective 2: Field Study of Lead in Water, Dust, and Blood
2.2.1 Sample Population
Households included in the eld study (1) obtained their drinking water from a private well, (2) did not use any type of household water treatment system, (3) lived in a structure with no more than two units, (4) lived at their current residence for at least one year, and (5) had a healthy child under age 7 who was born in the United States, regularly drank the tap water, and did not regularly spend more than two days per week away from home. One child was randomly selected if there was more than one eligible child in the household. These households were recruited through various means: calling and sending recruiting letters to households from a list of private well owners, recruiting friends and neighbors of previously enrolled research participants, creating a website for potential participants to visit, and marketing the study through a radio advertisement and news releases and iers that were sent to day cares, churches, schools, and local health clinics. Informed consent was obtained from the parent of each child. Upon completion of the visit, each household received a $75 gift card for participation. A total of 23 households were recruited.
2.2.2 Data Collection
2.2.3 Water Sampling and Analysis
During each visit, households were provided with two 500 mL sample bottles pre-acidied with TraceMetal Grade nitric acid (Fisher Scientic, Lenexa, KS). Instructions were also given for collecting two rst-draw samples from the kitchen tap after a stagnation period of at least 6 hours. A research member revisited the household the next morning to retrieve the water samples. Temperature, conductivity and pH were also analyzed at the tap during the initial visit using a Hanna Instruments, Model HI98130 Combo pH/Conductivity/TDS Tester (Hanna Instruments, Woonsocket, RI).
Lead and other heavy metals of interest were analyzed via inductively coupled plasma mass spectrometry using EPA Method 200.8 in the Metals Analysis Lab at RTI Interna-tional ( 3040 East Cornwallis Road, P.O. Box 12194 Research Triangle Park, NC 27709) [37].
2.2.4 Dust Sampling and Analysis
Five dust samples were collected with a Ghost Wipe (Environmental Express, Charleston, South Carolina) in areas of the household most frequented by the child: entryway oor, oor in a room the child uses most often, oor in the child's bedroom, windowsill in the child's bedroom, and window trough in the child's bedroom. Each oor sample was collected from a one meter by one meter square area of a non-carpeted oor surface as described by Levallois et al. [33]. If the oor was carpeted, no sample was collected at that location.
These dust samples were analyzed via inductively coupled plasma mass spectrometry using procedures used to support the American Industrial Hygiene Association's envi-ronmental lead program at RTI International [38].
2.2.5 Blood Sampling and Analysis
A trained phlebotomist drew two venous blood samples (between 5-6 mL each) from the child's arm into 6.0 mL BD Vacutainer K2 EDTA 10.8 mg tubes. These tubes were inverted 8 times and placed into a sample rack on ice. The samples were on ice for less than three hours before refridgeration at -20 °C. All samples were analyzed within 30 days of collection.
Blood samples were analyzed via inductively coupled plasma mass spectrometry using published laboratory procedures at RTI International[20].
2.2.6 Statistical Analysis
CW LEI=QE×0.50× n=150
X
i=0
W LLi×e−(ln(2))/30×(n−i)
where QE is the daily tap water intake in liters, n is the number of days considered
for cumulative exposure, and W LLi is the water lead level at time i. Tap water intake
was calculated by multiplying water intake parameters used in the IEUBK Model (Table S1) by the percent of time the child was reported drinking tap water. Child blood lead and plasma lead concentration (µg/dL) were then modeled using ordinary least squares as a function of normalized CWLEI (µg lead exposure through water/body weight in kilograms), dust lead (µg/ft2), and age and gender of the child:
ln(BLL) =b0+CW LEI
BW ×b1+ln(DL)×b2+A×b3+G×b4
whereb0, b1...bnare regression coecients,DLis dust lead, andAandGare age group
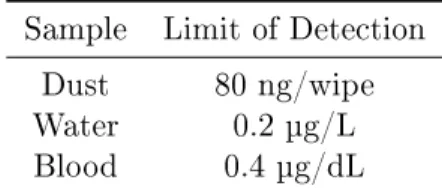
(1-4 or 4-7) and gender of the child. Sample values that were below the limit of detection (LOD) were replaced with half of the LOD value (Table 2). Observations were considered outliers and removed if they were more than 3 standard deviations away from the mean.
Table 2: Selected Limit of Detection Values Sample Limit of Detection
Dust 80 ng/wipe
Water 0.2 µg/L
Blood 0.4 µg/dL
2.2.7 Bivariate Analysis of Factors Inuencing Blood Lead
Geometric means of blood lead levels were calculated for select variables. For dichoto-mous variables, Student's t-test was used to compare the geometric means across dierent variable levels. For variables with three or more categories, analysis of variance (ANOVA) was used.
2.3 Objective 3: Validation of IEUBK Model on the Basis of Field Study Results
transformation [21]. As a result, three values of lead concentration in dust were calcu-lated for each household using the 5th, 50th, and 95th percentile dust loading values respectively. The IEUBK Model was then run three separate times using these lead concentration values to give a potential range for each blood lead prediction.
Background values of exposure to lead from soil and diet were adapted from Deshommes et al. (2013) [26]. The background value for lead concentration in air was the median lead concentration value from the EPA's Hazardous Air Pollutants Monitor Values Report[43]. Other parameters used in the IEUBK model include intake and absorption values for var-ious media (water, soil, dust) and pathways (diet, lungs), behavioral factors (e.g. time spent outdoors), and environmental factors (ventilation rate). Specic values can be found in the supplementary information (Table S1).
The IEUBK model was also run by zeroing out all sources of environmental lead that were not directly measured (e.g. maternal blood lead, dietary lead, soil lead, etc.) to see if the discrepancy between measured blood lead values and blood level predictions from the model would decrease.
3 Results
3.1 Objective 1: Systematic Literature Review Results
In total, 17 papers were found that met the inclusion criteria (Figure 1).
Table 3: Characteristics of 11 Studies Directly Measuring Water Lead Levels and Blood Lead Levels
Location Sample
Population (size if reported)
Water Supply Years
Conducted
Reference
Allada, Benin Mothers (225) and ospring (685) aged 1-2 years
Private Well 2011-2013 Bodeau-Livinec et al, 2016
Washington, DC Mothers and children
Community Water 1997-2011 Edwards, 2013
Montreal, Quebec, Canada
Children (298) aged 1-5 years
Community Water 2009-2010 Ngueta et al., 2016
Glasglow, Scotland Mothers (1726) who gave birth to a live child in the 18 months prior to
the study
Community Water 1981-1993 Watt et al., 2000
Edinburgh, Scotland
Families (207) previously included in the Edinburgh lead
study
Community Water 1983-1993 Macintyre et al., 1998
Flint, Michigan Children (1473) Community Water 2013-2015 Hanna-Attisha et al., 2015
France Children (484)
aged 6 months to 6 years
Community Water 2008-2009 Etchevers et al., 2015
Montreal, Quebec, Canada
Children (306) Community Water 2009-2010 Levallois et al., 2014 Washington, DC Children aged 1-3
years
Community Water 2001-2003 Edwards et al., 2009 Hamburg, Germany Non-smoking young women (248)
Community Water 1999 Fertman et al.,
2004
Rochester, New York
Children (276) aged 6 months to 2
years
Additionally, six papers did not measure blood lead but instead used measured water lead data to predict what blood lead levels might be expected. Five predicted an in-crease in blood lead levels (BLLs) or the incidence of elevated BLLs (>5 µg/dL) from consuming lead-contaminated water. One concluded that lead-contaminated water did not result in an increase in the incidence of elevated BLLs, but only assessed the con-tribution from drinking water in schools specically. Of these six papers, ve used the EPA's IEUBK model and one used the International Commission for Radiation Protec-tion (ICRP) model adapted for lead exposure. Every study that used the IEUBK model adjusted for these background sources of lead exposure using previously measured values or the default values provided by the EPA.
3.2 Objective 2: Field Study Results
Our total sample size was 23 households. One household was removed due to having a water lead level more than three standard deviations away from the mean. As a result, 22 households were included in the following analysis.
3.2.1 Participant Characteristics
Table 4: Blood lead levels by selected sociodemographic, parental, and environmental characteristics
Characteristic n (%) GM Blood lead level (μg/dL) p -Valuea
Child-related Sex
Male 18 (81) 0.364 0.223
Female 4 (19) 0.244
Age (years)
1-4 5 (23) 0.467 0.195
4-7 17 (77) 0.308
Ethnicity
Black 2 (9) 0.341 0.767
Not Black 20 (91) 0.316
Frequency of day care attendance (days/week)
0 10 (45) 0.350
0.194
1-2 1 (5) 0.911
3-4 2 (9) 0.387
5 9 (41) 0.284
Parental
Home ownership status
Own 18 (82) 0.303 0.137
Rent 4 (18) 0.560
Mother's working status
Working 16 (73) 0.317 0.470
Not Working 6 (27) 0.406
Mother's education level
Some College/Other 4 (18) 0.551
0.289
Undergraduate 4 (18) 0.351
Graduate 14 (64) 0.291
Environmental
Home built prior to 1988
Yes 11 (50) 0.354 0.495
No 11 (50) 0.325
Use of any lterb
Yes 14 (64) 0.298 0.286
No 8 (36) 0.425
Abbreviations: GM, geometric mean
Table 5: Measured lead levels in blood, water, and dust
n Min P25 P50 P75 Max AM GM
Blood (μg/dL) 22 0.200 0.200 0.285 0.494 0.972 0.402 0.338
Water (μg/L) 46 0.100 0.859 1.64 5.50 42.9 4.74 1.94
Floor Lead Loading (μg/ft2) 50 0.00371 0.0374 0.0603 0.0939 2.66 0.190 0.0667
Windowsill Lead Loading (μg/ft2) 21 0.0698 0.270 0.788 .998 29.9 3.23 0.752
Window Trough Lead Loading(μg/ft2) 11 0.367 2.57 3.11 5.29 8.50 3.71 3.25
Abbreviations: Pb, lead; AM, arithmetic mean; GM, geometric mean
Table 6: Distribution of the Cumulative Water Lead Exposure Index (CWLEI)
n Mina P25 P50 P75 Max AM SD
CWLEI (μg/kg) 22 0 0.181 1.03 3.54 16.8 2.92 4.26
Abbreviations: AM, arithmetic mean; SD, standard deviation
aTap water intake reported at 0%
3.2.2 Sample Results
Twelve blood samples had non-detectable levels of lead (< 0.4 µg/dL). The geometric mean blood lead level for the study sample was 0.338 μg/dL (Table 5). No children
had a blood lead level above the CDC Blood Lead Reference Level of Concern of 5
μg/L. The geometric mean water lead level was 1.97 μg/L for a stagnant water sample.
Approximately 14 percent of households had at least one water sample that exceeded the EPA action level of 15 μg/L. No household had a oor or window sill sample that
exceeded the EPA lead loading standards of 40μg/ft2for oors and 250μg/ft2for window
sills respectively (Table 4). The mean CWLEI value (expressed inμg Pb/kg body weight)
was 2.92 μg/kg (Table 6).
3.2.3 Bivariate Analysis Results
There were no signicant dierences in measured blood lead levels across any character-istic level (Table 4).
3.2.4 Regression Analysis Results
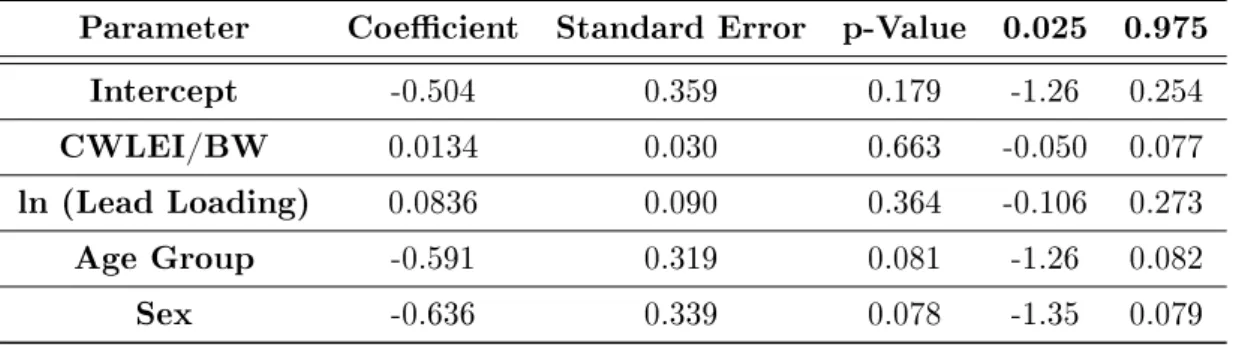
Measured blood lead levels increased with CWLEI, although this relationship was in-signicant (p=0.663); Table 7.
A one unit increase in CWLEI was associated with a 0.0134 μg/dL increase in log
Table 7: Ordinary Least Squares Regression Results
Parameter Coecient Standard Error p-Value 0.025 0.975
Intercept -0.504 0.359 0.179 -1.26 0.254
CWLEI/BW 0.0134 0.030 0.663 -0.050 0.077
ln (Lead Loading) 0.0836 0.090 0.364 -0.106 0.273
Age Group -0.591 0.319 0.081 -1.26 0.082
Sex -0.636 0.339 0.078 -1.35 0.079
IEUBK model (0.742 L and 1 L), as well as the average weights for each age group in our sample population (11.1 kg and 21 kg), this translates into a 1.34 percent increase in blood lead levels for increases of 0.105 μg/L (0.007 μg/kg / .0668 L/kg/day) and 0.147 μg/L in the water lead concentration for the 1-4 and 4-7 age groups respectively.
Blood lead also decreased from the younger age group to the older age group, as well as from males to females, at a marginally signicant level (p<0.1).
3.3 IEUBK Analysis Results
The geometric mean predicted blood lead level for the study sample was 1.30 μg/dL
Figure 2: IEUBK Predicted Blood Lead Levels vs. Measured Blood Lead Levels
Error bars represent dierences in blood lead predictions using the 5th annd 95th percentiles for dust loading values. Points with no error bars represent no dierences in the IEUBK predictions when using the 5th, 50th, or 95th percentile for dust loading values. A point that falls along the 45 degree dotted line represents a perfect prediction for the IEUBK Model.
Figure 3: IEUBK Predicted Blood Lead Levels Using Only Water, Dust, and Air Lead vs. Measured Blood Lead Levels
Error bars represent dierences in blood lead predictions using the 5th annd 95th percentiles for dust loading values. Points with no error bars represent no dierences in the IEUBK predictions when using the 5th, 50th, or 95th percentile for dust loading values. A point that falls along the 45 degree dotted line represents a perfect prediction for the IEUBK Model.
4 Discussion
In this study, we characterized the relationship between lead in private well water and children's blood lead levels through (1) literature review, (2) eld study of the relationship between drinking lead-contaminated water from private wells and blood lead levels of children under age 7, and (3) assessment of the IEUBK Model's accuracy based on our eld study results. Our results show that lead exposure through private well water consumpiton and dust is an important contributor to children's blood lead levels.
4.1 Objective 1: Systematic Literature Review
in mothers only[23]. It is important to note that this study was conducted in Benin and is not representative of the potential risks that children could see here in the United States due to dierent environmental and dietary factors. Bodeau-Livinec et al.'s study was conducted in a semi-rural area, which are not as exposed to lead as urban areas. Along with this, piped water and consumption of animals killed with lead-containing ammunition were shown to be signicant predictors of blood lead in their study, which exposure pathways that are unlikely to be seen in a developed country such as the United States.
To our knowledge, there have been no previous systematic reviews on the association between water lead levels and blood lead levels. However, results from this review are similar to those from previously conducted non-systematic literature reviews on lead exposure. The Agency for Toxic Substances and Disease Registry's review in 2007 noted water lead levels can contribute to blood lead levels measured in children [44]. Studies that found high variability in the predicted correlations between blood lead levels, soil, and dust also suggested that water is a contributing factor in blood lead levels [44].
4.2 Objective 2: Field Study
The geometric mean blood lead level (BLL) of our sample was 0.338 ug/dL. This value is much lower than the one found in Ngueta's study (1.3 ug/dL), as well as the CDC's average BLL reported for children aged 1-5 between 2007 and 2010 (1.3 ug/dL)[28]. Our GM BLL may be lower due to most of our sample consisting of Caucasian children with highly educated mothers, which are factors that have been shown to contribute to decreased BLLs [45, 46]. Along with this, environmental exposures to lead may be dierent since Ngueta's study was conducted in Montreal, Canada [28].
We used the cumulative water lead exposure index (CWLEI) as developed by Ngueta et al. to investigate the relationship between water lead concentrations in private wells and children's blood lead levels [28]. This was done through a regression model that also accounted for household dust lead and the child's age and gender. We found that the CWLEI was insignicant in our regression model(p=0.663). Our study found that increases of 0.105 ug/L and 0.147 ug/L in water lead concentration led to a 1.34 percent increase in BLLs for the 1-4 and 4-7 age groups respectively. Ngueta et al.'s study found a statistically signicant relationship between CWLEI and BLLs and saw a 35 percent increase in BLLs for every 1 ug/L increase in water lead concentration for their sample [28]. This dierence may be because most of our sample population drank ltered water or water from a fridge dispenser. Lead exposure through these sources was not captured by our water lead measurements or regression model and could lead to substantial over-estimates in our CWLEI calculations. Future research should make sure to account for the use of pitcher lters or for household water use that does not occur at the tap.
4.3 Objective 3: IEUBK Assessment
parameters in conjunction with measured lead concentrations in water, dust, and air. The IEUBK Model overestimated BLLs by 0.592 ug/dL on average. Previous evaluations of the IEUBK Model have also found similar results. Two studies have found that the IEUBK Model overestimated the geometric mean BLL of their population[48, 49]. Along with this, Cornelis et al. found that the IEUBK Model overestimated measured BLLs by 0.8 to 1.8 ug/dL [47].
Zeroing out sources of environmental lead that we did not directly measure (e.g. dietary or soil lead) improved the IEUBK predictions slightly. However, the IEUBK Model predicted that 3 children would have a BLL of 0 ug/dL under this scenario, even when accounting for environmental lead exposure from water and dust. This could signify a need to update the default parameters of the IEUBK Model, as the last update occurred in 2011. Decreases in lead concentrations in soil and dust over the past decade have increased the relative contribution of water lead in children's total lead intake in the United States[50]. The IEUBK Model's default input parameters might need to be updated to reect this in order to provide as accurate BLL predictions as possible.
4.4 Limitations
Limitations of the eld study include that there has been diculty in recruiting partici-pants from our target population. This limits the generalizability of our results as most of our current sample population is Caucasian and highly educated. Our small sample size also limits the statistical signicance of our regression model. Along with this, our water collection protocol and regression model did not account for the use of pitcher lters or fridge dispensers, which can lead to inaccurate CWLEI estimates. However, our study still found a positive trend between CWLEI and BLLs and will continue to recruit research participants to increase the statistical power.
Our IEUBK Model parameters did not have relevant measurements for maternal, di-etary, and soil lead concentrations. Dietary and soil lead concentrations came from other studies that could have dierent values than what is seen in North Carolina. However, this further emphasizes the need to update the default parameters, as many studies and risk assessments will not have this information readily available.
5 Conclusion
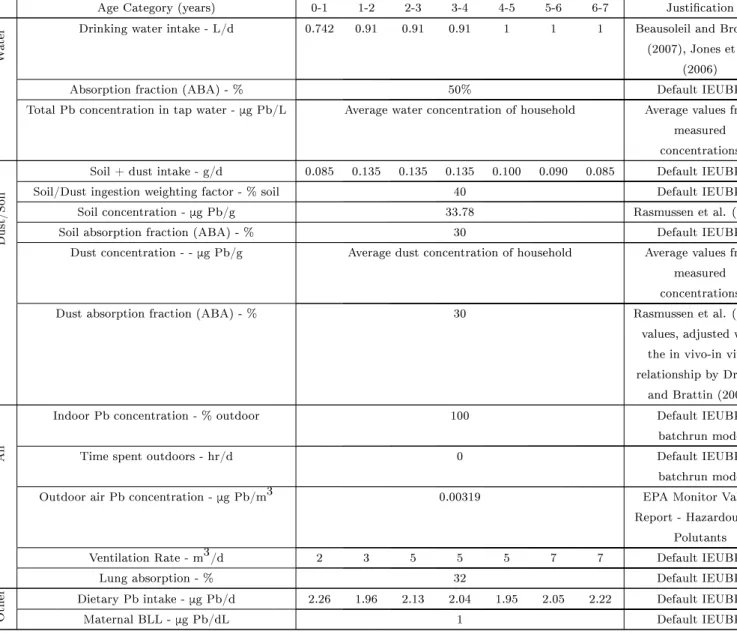
Table 8: Description and justication of IEUBK parameters (adapted from Deshommes and Prevost, 2012)
Age Category (years) 0-1 1-2 2-3 3-4 4-5 5-6 6-7 Justication
W
ater
Drinking water intake - L/d 0.742 0.91 0.91 0.91 1 1 1 Beausoleil and Brodeur (2007), Jones et al.
(2006)
Absorption fraction (ABA) - % 50% Default IEUBK
Total Pb concentration in tap water -μg Pb/L Average water concentration of household Average values from
measured concentrations
Dust/Soil
Soil + dust intake - g/d 0.085 0.135 0.135 0.135 0.100 0.090 0.085 Default IEUBK Soil/Dust ingestion weighting factor - % soil 40 Default IEUBK
Soil concentration -μg Pb/g 33.78 Rasmussen et al. (2001)
Soil absorption fraction (ABA) - % 30 Default IEUBK Dust concentration - -μg Pb/g Average dust concentration of household Average values from
measured concentrations Dust absorption fraction (ABA) - % 30 Rasmussen et al. (2011)
values, adjusted with the in vivo-in vitro relationship by Drexler
and Brattin (2007)
Air
Indoor Pb concentration - % outdoor 100 Default IEUBK batchrun mode
Time spent outdoors - hr/d 0 Default IEUBK
batchrun mode Outdoor air Pb concentration -μg Pb/m3 0.00319 EPA Monitor Values
Report - Hazardous Air Polutants Ventilation Rate - m3/d 2 3 5 5 5 7 7 Default IEUBK
Lung absorption - % 32 Default IEUBK
Other
Dietary Pb intake -μg Pb/d 2.26 1.96 2.13 2.04 1.95 2.05 2.22 Default IEUBK
References
[1] Continual Decrease in Blood Lead Level in Americans: United States National Health Nutrition and Examination Survey 1999-2014, Man-Fun Tsoi et. al. 2016 [2] Committee on Environmental Health. "Lead exposure in children: prevention,
de-tection, and management." Pediatrics 116.4 (2005): 1036-1046.
[3] Koller, Karin, et al. "Recent developments in low-level lead exposure and intellectual impairment in children." Environmental health perspectives 112.9 (2004): 987. [4] Nussbaumer-Streit, Barbara, et al. "Household interventions for preventing domestic
lead exposure in children." Cochrane Database of Systematic Reviews 10 (2016). [5] Stewart, Lauren R., et al. "Spatial prediction of blood lead levels in children in
Toledo, OH using fuzzy sets and the site-specic IEUBK model." Applied geochem-istry 45 (2014): 120-129.
[6] Caneld, Richard L., et al. "Intellectual impairment in children with blood lead concentrations below 10 μg per deciliter." New England journal of medicine 348.16
(2003): 1517-1526.
[7] Triantafyllidou, Simoni, and Marc Edwards. "Lead (Pb) in US drinking water: school case studies, detection challenges and public health considerations." Yale University Drinking Symposium on Your Solution for the 21st Century, New Haven, Connecticut. 2009.
[8] Ziegler, Ekhard E., et al. "Absorption and retention of lead by infants." Pediatric research 12.1 (1978): 29-34.
[9] Ngueta, G., et al. "Exposure of young children to household water lead in the Mon-treal area (Canada): The potential inuence of winter-to-summer changes in water lead levels on children's blood lead concentration." Environment international 73 (2014): 57-65.
[10] Emmanuel, Evens, et al. "Human health risk assessment of lead in drinking water: a case study from Port-au-Prince, Haiti." International Journal of Environment and Pollution 31.3-4 (2007): 280-291.
[11] Oce of Enforcement and Compliance Assurance. USEPA Drinking Water Blue-book; Federal Facilities Environmental Stewardship and Compliance Assistance Cen-ter.
[12] Swistock, B. R.; Clemens, S., Water quality and management of private drinking water wells in Pennsylvania. Journal of environmental health 2013, 75.6, 60-66. [13] Gibson, Jacqueline MacDonald, and Kelsey J. Pieper. "Strategies to improve
[14] USEPA (US Environmental Protection Agency). "Guidance manual for the inte-grated exposure uptake biokinetic model for lead in children." (1994).
[15] United States Department of the Interior and Molly A. Maupin. Estimated use of water in the United States in 2015. U.S. Geological Survey.
[16] Stillo, Frank, and Jacqueline MacDonald Gibson. "Exposure to contaminated drink-ing water and health disparities in North Carolina." American journal of public health 107.1 (2017): 180-185.
[17] Cornelis, Christa, et al. "Use of the IEUBK model for determination of exposure routes in view of site remediation." Human and Ecological Risk Assessment 12.5 (2006): 963-982.
[18] Sanborn, Margaret D., et al. "Identifying and managing adverse environmental health eects: 3. Lead exposure." Canadian Medical Association Journal 166.10 (2002): 1287-1292.
[19] Stillo, F., & Gibson, J. M. D. (2018). Racial disparities in access to municipal water supplies in the American South. In Resilience and Health: A Potent Dynamic (pp. 131-156). Nova Science Publishers, Inc..
[20] James M. Harrington, Daniel J. Young, Amal S. Essader, Susan J.Sumner, and Keith E. Levine. Analysis of human serum and wholeblood for mineral content by icp-ms and icp-oes: Developmentof a mineralomics method.Biological Trace Element Research,160(1):132142, Nov 2014
[21] Adgate J.L., C. Weisel, Y. Wang, G.G. Rhoads, and P.J. Lioy. 1995. Lead in house dust: relationships between exposure metrics. Environmental Research. 70:134-147. [22] Guidance for the sampling and analysis of lead in indoor residential dust for use in the integrated exposure uptake biokinetic (IEUBK) model. (2008). Washington, DC: United States Environmental Protection Agency, Oce of Superfund Remediation and Technology Innovation.
[23] Bodeau-Livinec, Florence, et al. "Elevated Blood Lead Levels in Infants and Mothers in Benin and Potential Sources of Exposure." International journal of environmental research and public health13.3 (2016): 316.
[24] Akers, D. Brad, et al. "Lead (Pb) contamination of self-supply groundwater sys-tems in coastal madagascar and predictions of blood lead levels in exposed chil-dren."Environmental science & technology49.5 (2015): 2685-2693.
[25] Continual Decrease in Blood Lead Level in Americans: United States National Health Nutrition and Examination Survey 1999-2014, Man-Fun Tsoi et. al. 2016 [26] Deshommes, Elise, et al. "Application of lead monitoring results to predict 07 year
[27] Edwards, Marc. "Fetal death and reduced birth rates associated with exposure to lead-contaminated drinking water." Environmental science & technology48.1 (2013): 739-746.
[28] Ngueta, Gerard, et al. "Use of a Cumulative Exposure Index to Estimate the Impact of Tap Water Lead Concentration on Blood Lead Levels in 1-to 5-Year-Old Children (Montréal, Canada)." Environmental health perspectives124.3 (2016): 388.
[29] Watt, G. C. M., et al. "Public health implications of new guidelines for lead in drinking water: a case study in an area with historically high water lead levels." Food and Chemical Toxicology38 (2000): S73-S79.
[30] Macintyre, Cecilia,et al. "Changes in blood lead and water lead in Edinburgh. An eight year follow-up to the Edinburgh lead study." Environmental geochemistry and health20.3 (1998): 157-167.
[31] Hanna-Attisha, Mona, et al. "Elevated blood lead levels in children associated with the Flint drinking water crisis: a spatial analysis of risk and public health response." American journal of public health106.2 (2016): 283-290.
[32] Etchevers, Anne, et al. "Environmental determinants of dierent blood lead levels in children: A quantile analysis from a nationwide survey." Environment international 74 (2015): 152-159.
[33] Levallois, Patrick, et al. "The impact of drinking water, indoor dust and paint on blood lead levels of children aged 15 years in Montréal (Québec, Canada)." Journal of Exposure Science and Environmental Epidemiology 24.2 (2014): 185-191.
[34] Edwards, Marc, Simoni Triantafyllidou, and Dana Best. "Elevated blood lead in young children due to lead-contaminated drinking water: Washington, DC, 2001= 2004." Environmental science & technology 43.5 (2009): 1618-1623.
[35] Fertmann, Regina, et al. "Lead exposure by drinking water: an epidemiologial study in Hamburg, Germany." International journal of hygiene and environmental health 207.3 (2004): 235-244
[36] Lanphear, Bruce P., et al. "Environmental lead exposure during early childhood." The Journal of pediatrics 140.1 (2002): 40-47.
[37] Brockho, C. A., et al. EPA Method 200.8, Revision 5.5: Determination of trace metals in waters and wastes by inductively coupled plasma-mass spectrometry. Vol. 61. EPA-821R-99-017, 1999.
[39] Ngueta, G.; Abdous, B.; Tardif, R.; St-Laurent, J.; Levallois, P. Use of a cumu-lative exposure index to estimate the impact of tap water lead concentration on blood lead levels in 1- to 5-year-old children (Montreal, Canada). Environ. Health Perspect.2016, 124 (3).
[40] Control of Lead and Copper, 56 C.F.R 26548 (1991)
[42] Moher, David, et al. "Preferred reporting items for systematic reviews and meta-analyses: the PRISMA statement." PLoS med 6.7 (2009): e1000097.
[43] Monitor Values Report - Hazardous Air Pollutants. EPA, Environmental Protec-tion Agency, 31 July 2018, www.epa.gov/outdoor-air-quality-data/monitor-values-report-hazardous-air-pollutants.
[44] Abadin, Henry, et al. Toxicological prole for lead. Agency for Toxic Substances and Disease Registry (US), Atlanta (GA), 2007.
[45] Evens, Anne, et al. "The impact of low-level lead toxicity on school performance among children in the Chicago Public Schools: a population-based retrospective cohort study." Environmental Health 14.1 (2015): 21.
[46] Gao, Zhenyan, et al. "Blood lead levels and risk factors among preschool children in a lead polluted area in Taizhou, China." BioMed research international 2017 (2017). [47] Cornelis, Christa, et al. "Use of the IEUBK model for determination of exposure routes in view of site remediation." Human and Ecological Risk Assessment 12.5 (2006): 963-982.
[48] Biesiada, Marek, and Lech Hubicki. "Blood lead levels in children: epidemiology vs. simulations." European journal of epidemiology 15.5 (1999): 485-491.
[49] Beck, Barbara D., et al. "The development of a stochastic physiologically-based pharmacokinetic model for lead." Science of the Total Environment 274.1-3 (2001): 15-19.
[50] Brown, Mary Jean, and Stephen Margolis. "Lead in drinking water and human blood lead levels in the United States." (2012).
[51] N.C. Gen. Stat. 87-97.
[52] MWater. MWater, www.mwater.co/.
1
2
TABLE OF CONTENTS
Introduction...3 Preparation...4
Materials List...5
Household Visit Protocol...9
Household Checklist and Script...9 Protocol for Blood Collection...11 Protocol for Water Sampling...12 Protocol for Household Dust Sample Collection...13
Forms...14
Draft Questionairre...14 Gift Card Receipts...20 Gift Card Receipt Acknowledgement...22 Parental Permission and Consent...23
3
Introduction
Purpose of Study
The Lead, Hexavalent Chromium, and Other Toxic Metals in North Carolina Private Wells is a study aiming to inform about toxic metals in private well water in North Carolina and how they correlate to children’s blood lead levels. It is primarily focused on children from households that rely primarily on private well water located in extraterritorial jurisdictions in Wake and Gaston counties.
Study Population
This study is currently recruiting 60 children as part of an initial cohort from the previously stated areas. However, funding from additional grants has been confirmed for recruiting an additional 300 households to take part in the study.
Study Activities and Focus of Field Manual
4
Preparation
Prior to the visits, households should have already been scheduled for blood and environmental sample collection. Currently, we have been scheduling between 4 to 5 households per weekend. However,
potential “back-ups” could also be scheduled for those days as we have experienced dropouts on the actual day.
Download the mWater Surveyor app for Android smartphones. It is currently not available on iPhones.
Have the following items available for each household:
◦ 2 Parental Permission and Consent forms (one for the parents to sign and one for them to keep)
◦ One water sampling collection form to leave with the household
◦ One gift card and one gift card receipt acknowledgement form
◦ RTI Chain of Custody form
5 Materials List Item Descript ion Quan tity per Hous e Cost Per Child Where to Purchase Link Environm ental Sample Collection 250 mL water sample collection bottles for water
samples 2 RTI International
125 mL water sample collection bottles
for dust
samples 5 Fisher Scientific
Ghost wipes 5 RTI International Handled
bags for research participants to hang their samples in from door knob e.g. plastic bags from walmart 1 0 Latex gloves 2x Latex Gloves, Powder Free, Medium Size 100 Gloves Per Box
6 Field portable sensors For pH, temperat ure, alkalinity Tape measurer for measuring out areas for dust
sampling
1 0
Blue tape for measuring out areas for dust sampling Duck Clean Release Painter's Tape, 0.94" x 60 yds, 3" Core, Blue, 24 per pack 1 $0.05Walmart Blood Sample Collection 2x2 Gauze Sponge, Nonsterile
4 $0.21Fisher Scientific https://www.walmart.com/ip/Duck-Clean-Release-Painter-s-Tape-0-94-x-60-yds-3-Core-Blue-24-per-pack/17510800 Alcohol Prep 4 $0.07Fisher Scientific
Cartoon Band-aids for children 2 x Despicabl e Me Bandages 3/4x3 100 per box 2 $0.10Amazon https://www.amazon.com/Despicable-Bandages-4x3-100-box/dp/B00DQSWUY2/ref=sr_1_1_s_it? s=hpc&ie=UTF8&qid=1527293454&sr=1-1&keywords=Despicable+Me+Bandages+3%2F4x3+100 +per+box
7 suction Vacutainer push button blood collection set 25G
1 $0.84Fisher Scientific
Vacutainer Latex-Free Tourniquet, Single Use 1 Cooler for blood samples
1 RTI International
Rack for blood sample tubes 1x(size) 1 Biowaste container
ICE 1 0
Latex gloves (size medium)
2 x Latex Gloves, Powder Free, Medium Size 100 Gloves Per Box 4 Price accoun ted for Amazon https://www.amazon.com/Latex-Gloves-Powder-Free-Medium/dp/B000F38JTQ?th=1 Paperwor k Gift card
receipt form 1 0 water
sampling form/instructi ons
8
parental permission/c onsent form
1 0
RTI chain of
custody form 1 0 household
survey 1 0
Notes for dust sampling locations (size, location, ID, number, etc.) Participan t Fees Orange/ Apple juice for children
4 x Apple & Eve Juice Variety Pack (6.75 oz. ea., 36 ct.)
2 $0.60Sam’s Club
https://www.samsclub.com/sams/apple-eve-juice-box-variety-36-6-75-oz/ 154950.ip;jsessionid=B18C85FF0410200F45F0FFDA6DF8 AF95.estoreapp-44277244-38-353313961? navAction=push Goldfish or other snacks for children 4 x Pepperid ge Farm Goldish Snack Packs, Cheddar (1.5 oz., 30 pk.)
2 $0.67Sam’s Club https://www.samsclub.com/sams/goldfish-30-ct-30-ct/ prod17870187.ip?xid=plp:product:1:1
Stuffed animals for
1 pk, 50 ct.
9 children Gift cards Barcodes for samples 1 https://www.amazon.com/IntelliScanner-Asset-Tags-Pre-Printed-Barcode/dp/B00451DS2W/ref=sr_1_cc_1? s=aps&ie=UTF8&qid=1527772698&sr=1-1-catcorr&keywords=intelliscanner&th=1 Follow Up Survey Bar Code stickers Barcode
Scanner n $0
10
Household Visit Protocol
Household Checklist and Script
HOUSEHOLD ID: _________________________ DATE: ___________________________
UNC PERSONNEL:
____________________________________________________________
During Testing
Introduce the team and study purpose:
“Hello, my name is _____ and this is _____, ______, and ____. We are from the UNC School of Public Health.
“We are performing a study to examine lead levels of private well water, children’s blood, and household surfaces.
“We sincerely appreciate your participation in this study. As you know, today we will collect water and dust samples from your house. We also will collect a blood sample from your child. In return, you will receive all of the test results and a $100 gift card.
“Participation is completely voluntary. You can change your mind at any time.
“May we have your consent to get started?”
Read and request signature on consent form.
Administer household questionnaire to the participating adult.
Introduce nurse, collect blood sample (10mL).
11
Collect five dust samples (see separate protocol):
Entryway floor (near door the family uses most often to enter and exit the house)
Floor in room child uses most often:
room=____________________-- Floor in child’s bedroom
Windowsill in child’s bedroom: length=__________ inches, width=___________ inches
Window trough in child’s bedroom: length=__________ inches, width=___________ inches
Provide water sample collection kit with instructions. Say,
“A team member will return to collect the water samples tomorrow. Please leave the samples hanging on your front door using the bag provided.”
Check the pH and Temperature of the kitchen sink.
Request signature on gift card log sheet, and provide gift card.
Thank the participant, ask if they have questions, and provide letter with Dr. Gibson’s contact information.
12
Check supply list; IF MISSING NECESSARY EQUIPMENT:
Go to the UNC blood bank if items are on backorder
Email Dr. Gibson and Frank Stillo
Consult Frank Stillo and Robin Whitley to order additional supplies
Make copies of
Gift card receipt form
Water sampling form/instructions
Parental permission/consent form
RTI chain of custody form
Household survey
After Testing
Place blood samples in tube rack in cooler
Scan all barcodes
Update all survey information on the mWater surveyor app
Dispose of all biowaste and waste products
Protocol for Blood Collection
Supplies:
1. 6.0 mL BD Vacutainer K2 EDTA 10.8 mg #368661 (lavender
top)
Pretest:
1. Gather supplies and cool the centrifuge to 4°C.
13
4. Have the proper safety equipment available
5. Label storage tubes for blood from lavender top tubes.
Label with subject ID and indicate “EDTA blood” on the
tube.
6. Label storage tubes for plasma from lavender top tubes
(3-4). Label with subject ID and indicate “EDTA plasma” on the
tube.
Blood and plasma collection and handling:
Blood:
1. Ensure that gloves worn during the collection and handling
steps have been DIW rinsed.
2. Collect
5-6 mL
of blood without stasis in to lavender top
tube.
3. Secure cap and invert
8
times
4. Return tube to a sample rack on ice.
5. Refrigerate immediately.
Plasma:
1. Ensure that gloves worn during the collection and handling
steps have been DIW rinsed.
2. Collect
5-6 mL
of blood without stasis in to lavender top
tube.
3. Secure cap and invert
8
times
4. Return tube to a sample rack on ice.
5. 15 min after transfer to lavender top tube, centrifuge at
2500 rpm for 12 min.
6. Aliquot plasma in 300 μL aliquots into the correct storage
tubes.
14
Protocol for Water Sampling
Instructions for Collecting Your Water
Sample
Please read carefully before collecting your sample.
To collect your water sample, please follow the instructions below. Then, sign and date the form. The research team will collect the sample tomorrow. If you have any questions, please call Dr. Jackie MacDonald Gibson at 919-208-0816 or Frank Stillo at 704-608-4240. Results should be available within 30 days but may take up to 90 days due to lab queue.
1. If you recently disinfected your well, be sure all chlorine is gone; the lab will not accept samples with chlorine.
2. Select an indoor faucet, preferably your kitchen tap. Avoid leaky faucets that allow water to seep around the valve.
3. It is important not to contaminate the sample bottles or their caps. Keep the bottles closed until ready to use. Do not touch the inside of the cap.
4. Allow the water in your household to sit undisturbed in the water pipes for at least 6 hours (overnight is best). It is most important that you let the water stand in the pipes to allow for the most accurate results. This means not running any water within the house or using the toilets. 5. Turn on the cold water faucet, and immediately fill the sample collection
bottle. Please do not allow the water to run before filling the bottle. Replace the bottle cap, being careful to close it tightly.
6. Date this form and indicate the time when you collected your sample, below. 7. Place the filled bottle and this form in a bag with handles. Hang the bag on
your front door knob or leave it on your front porch. The research team will collect your sample tomorrow.
SAMPLE COLLECTION DATE AND TIME:
15
Household Dust Sample Collection Protocol
Protocol for Floors
1. Place gloves on hands.
2. Measure 1 m x 1 m square, and mark with masking tape.
3. Open Ghost Wipe. Swab over full marked area, avoiding
contact with masking tape.
4. Place Ghost Wipe in labelled storage container (indicating
household ID, room, and location within room).
Protocol for Windowsills
1. Place gloves on hands (if not done previously).
2. With window closed, measure length and width of
windowsill, and record on household checklist.
3. Open Ghost Wipe.
4. Swab entire windowsill with Ghost Wipe.
5. Place Ghost Wipe in labelled storage container (indicating
household ID, room, and location within room).
Protocol for Window Troughs
1. Place gloves on hands (if not done previously).
2. Open window. Measure length and width of window trough,
and record on household checklist.
3. Open Ghost Wipe.
4. Swab entire window trough with Ghost Wipe.
16
Forms
Household Questionnaire
Name of Research Team Member:
________________________________________________________ Household ID: ___________________________
# Metadata Response options 1 Date
2 Address
3 Start Time
4 GPS coordinates (Lat) 5 GPS coordinates (Lon)
6 Home type ____Single-family home
____multi-family home/apartment ____Manufactured home/trailer ____Other:
Adult Respondent
7 What is your full name?
8 Gender of adult respondent _____Male _____Female _____Other: 9 Race/Ethnicity of adult respondent (mark all that
apply) _____Black
_____White
_____American Indian or Alaskan Native
_____Asian
_____Pacific Islander or Native Hawaiian
_____Hispanic Latino/a _____Other:
17 _____Grandmother _____Grandfather _____Aunt _____Uncle _____Other: 12 Are you the child's primary caregiver? _____Yes
_____No
_____Don't Know _____Decline to state 13 Are you currently working outside the home? _____Yes
_____No
_____Don't Know _____Decline to state 14 What is your current occupation? ________
15 What is the highest level of education that you
completed? _____Never attended school
_____Primary school (Through 6th Grade)
_____Middle school (Through 8th Grade)
_____High school (Through 12th Grade)
_____Technical/vocational school _____Associates Degree
_____4-year college/University Degree
_____ Graduate degree (e.g., M.D., J.D., Ph.D.)
16 How long have you lived at this address (years)?
17 What is your main source of water in this home? _____Piped network _____Private well _____Other: 18 When was this well constructed (year)?
19 How deep is this well (feet)?
20 Does this house have a septic system or
municipal sewer connection? _____Sewer _____Septic _____Other: 21 Do you drink tap water when you are at home? _____Yes
_____No
18
_____Don't Know _____Decline to state 23 What % of the time do you drink tap water when
you are at home (vs water from another source)
24 Do you own or rent this home? _____Own _____Rent _____Other: 25 When was this home built (year)?
Only ask Q 26 if the answer to Q13 was “Yes”
26 Are you exposed to lead at your job? Yes No
Don't Know 27 [Refer to dust collection site near entrance to
home]: When was the last time this area was cleaned? (days ago)
28 [Refer to dust collection site near entrance to home]: What cleaning method was used the last time this area was cleaned? (mark all that apply)
_____Sweep
_____Vacuum _____Mop _____Swiffer
_____Clean with rag or paper towel _____Other:
29 [Refer to dust collection site in child's room/area]: When was the last time this area was cleaned? (days ago)
30 [Refer to dust collection site in child's area]: What cleaning method was used the last time this area was cleaned? (mark all that apply)
_____Sweep
_____Vacuum _____Mop _____Swiffer
_____Clean with rag or paper towel _____Other:
31 [Refer to other dust collection site where child spends time]: When was the last time this area was cleaned? (days ago)
32 [Refer to other dust collection site where child spends time]: What cleaning method was used the last time this area was cleaned? (mark all that apply)
_____Sweep
19
Only answer Q33-35 if the survey respondent is not the child’s mother
Child's Mother (If different from Respondent)
33 Is the child's mother currently working? _____Yes _____No
_____Don't Know _____Decline to state
34 What is [child's] mother's current occupation?
35 What is the highest level of education that
[child's] mother completed? _____Never attended school
_____Primary school (Through 6th Grade)
_____Middle school (Through 8th Grade)
_____High school (Through 12th Grade)
_____Technical/vocational school _____Associates Degree
_____4-year college/University Degree
_____ Graduate degree (e.g., M.D., J.D., Ph.D.)
Child Characteristics
36 Name of [child]
37 Gender of [child] _____Male _____Female _____Other: 38 Child’s birth date (month, day, year)
39 Was [child] in school last year? _____Yes _____No
_____Don't Know _____Decline to state Only answer Q40 if the answer to Q39 was “Yes”
40 Name of school [child] attends
41 Was [child] in day care outside the home last
week? _____Yes
20
42 How many days per week was [child] in day care outside the home last week?
43 How long has child lived in this home? (months) 44 Does [Child] stay at this home every day of the
week? _____Yes
_____No
_____Don't Know _____Decline to state 45 How many days per week does child stay at this
home?
46 Race/Ethnicity of [child] (mark all that apply) _____Black _____White
_____American Indian or Alaskan Native
_____Asian
_____Pacific Islander or Native Hawaiian
_____Hispanic Latino/a _____Other:
_____Don't Know _____Decline to state 47 Was [child] ever breastfed? _____Yes
_____No
_____Don't Know _____Decline to state Only answer Q48 if the answer to Q47 was “Yes”
48 For how long was [child] breastfed? (Months) 49 Does [Child] drink tap water when [child] is at
home? _____Yes
_____No
_____Don't Know _____Decline to state 50 The last time [child] drank water at home, was it
from the tap? _____Yes
_____No
21
52 Does anyone in this household smoke cigarettes? _____Yes _____No
_____Don't Know _____Decline to state 53 Does anyone in this household smoke cigarettes
inside the home? _____Yes
_____No
_____Don't Know _____Decline to state 54 How many packs per day do people in this
household smoke?
55 Does anyone in this household smoke electronic
cigarettes? _____Yes
_____No
_____Don't Know _____Decline to state
Environmental Sampling
56 Floor dust sample ID 57 Windowsill sample ID
58 Paint sample collected? _____Yes _____No _____N/A Only answer Q48 if the answer to Q47 was “Yes”
59 Paint sample ID
60 Water sample collected? _____Yes _____No _____N/A 61 Water sample ID
22
Gift Card Receipts
Gift Card Reciept
Date
Number
Amount
$Descripti
on
Blood Draw Project
Received
by
Sign
23
Amount
$Descripti
on
Blood Draw Project
Received
by
Sign
Gift Card Reciept
Date
Number
Amount
$Descripti
on
Blood Draw Project
Received
by
24
Water Lead and Childhood Lead Exposure Study Gift Card Receipt Acknowledgement
I confirm that I have received a gift card in the amount of $________ for participating in the study of lead in drinking water and children’s health organized by the
University of North Carolina, Chapel Hill.
Address: ______________________________________________________________________
25
Date: _______________________
University of North Carolina at Chapel Hill
Parental Permission and Consent for a Minor Child to Participate in a Research Study
Consent Form Version Date: 08/10/2017
IRB Study # 16-2936
Title of Study: Lead, Hexavalent Chromium, and Other Toxic Metals in North Carolina Private Wells
Principal Investigator: Jacqueline MacDonald Gibson and Frank Stillo III
Principal Investigator Department: Environmental Sciences and Engineering
Principal Investigator Phone number: 919-966-7892; 919-962-5723
Principal Investigator Email Address: [email protected]; [email protected]
Faculty Advisor: Jacqueline MacDonald Gibson
Faculty Advisor Contact Information: (919) 966-7892
Funding Source and/or Sponsor: Research Triangle Institute; NCSU Water Resources Research Institute (WRRI)
What are some general things you and your child should know about research studies?
26
leave the study early.
Research studies are designed to obtain new knowledge. This new
information may help people in the future. Your child may not receive any direct benefit from being in the research study. There also may be risks to being in research studies. Deciding not to be in the study or leaving the study before it is done will not affect you or your child's relationship with the researcher or the University of North Carolina-Chapel Hill.
Details about this study are discussed below. It is important that you and your child understand this information so that you and your child can make an informed choice about being in this research study.
You will be given a copy of this consent form. You and your child should ask the researchers named above, or staff members who may assist them, any questions you have about this study at any time.
What is the purpose of this study?
The purpose of this research study is to inform you about toxic metals in private well water and children’s blood lead levels. Participants are being invited from households located in the extra territorial jurisdictions (ETJs) of Wake County and Gaston County, NC, who obtain their water from a private well. Your child is being asked to be in the study because the researchers are studying the relationship between private well water quality and children’s blood lead. Lead exposure is especially harmful for children under 7 years old.
Are there any reasons your child should not be in this study?
Your child should not be in this study if you get your drinking water from a city water supply or drink mainly bottled water or if your child is seven years of age or older.
How many people will take part in this study?
There will be approximately 60 people in this research study.
How long will your child’s part in this study last?
For this study, your child’s active involvement will only include the time it takes to drive to a satellite nursing station and to give blood. We estimate the total time to be about 1 hour. Once your child’s blood specimen is tested for lead, it will be destroyed.
Additionally, your involvement for water testing will be to follow the
27
Water and blood testing results will be mailed to you within about one month of sample collection. We will provide you with information about how to interpret the water and blood lead test results and what to do if you are concerned about these results.
What will happen if you or your child takes part in the study?
We are targeting residents of Wake and Gaston counties who get their drinking water from private wells. We plan to recruit 60 households to participate. If you agree to participate, we will collect a tap water sample from your kitchen sink and will test it for lead, hexavalent chromium, and other toxic metals. We will also collect a blood sample to test your child’s blood for lead.
No special preparations are needed for these tests. It may help to have your child wear a T-shirt or short-sleeved shirt on the day of the test.
A registered nurse will draw the blood from a vein. Beforehand, the skin surface will be cleaned with antiseptic, and an elastic band (tourniquet) will be placed around the upper arm to apply pressure and cause the veins to swell with blood. A needle will be inserted into a vein (usually in the arm inside of the elbow or on the back of the hand), and approximately one teaspoon of blood will be withdrawn and collected in a vial or syringe.
Specimens will be stored at the laboratories of RTI International until testing (up to two weeks) and then destroyed.
What are the possible benefits from being in this study?
Research is designed to benefit society by gaining new knowledge. The benefits to your child from being in this study will include receiving a free blood lead test that could potentially detect elevated blood lead levels associated with negative health outcomes. In addition, your household tap water will be tested for lead, hexavalent chromium, and other toxic metals.
What are the possible risks or discomforts involved from being in this study?
There may be uncommon or previously unknown risks. You should report any problems to the researcher. Collecting a sample of blood is only temporarily uncomfortable and can feel like a quick pinprick. Afterward, there may be some mild bruising, which should go away in a few days.
28
How will information about you and your child be protected?
Participants will not be identified in any report or publication about this study. Although every effort will be made to keep research records private, there may be times when federal or state law requires the disclosure of such records, including personal information. This is very unlikely, but if disclosure is ever required, UNC-Chapel Hill will take steps allowable by law to protect the privacy of personal information. In some cases, your child’s information in this research study could be reviewed by
representatives of the University, research sponsors, or government agencies (for example, the FDA) for purposes such as quality control or safety.
All data will be coded on a secure computer without access to internet and kept in a locked room with access only to project personnel. All data will be delinked from personal information (i.e. names and addresses) and given a random identifying number. The key to the delinked dataset will be kept on another secure computer with access only by senior researchers.
What will happen if your child is injured by this research?
All research involves a chance that something bad might happen. This may include the risk of personal injury. In spite of all safety measures, your child might develop a reaction or injury from being in this study. If such problems occur, the researchers will help your child get medical care, but any costs for the medical care will be billed to you and/or your insurance company. The University of North Carolina at Chapel Hill has not set aside funds to pay you for any such reactions or injuries, or for the related medical care. However, by signing this form, you and your child do not give up any of your legal rights.
What if you or your child wants to stop before your child’s part in the study is complete?
You can withdraw you or your child from this study at any time, without penalty. The investigators also have the right to stop you or your child’s participation at any time. This could be because your child has had an unexpected reaction, or has failed to follow instructions, or because the entire study has been stopped.
Will you or your child receive anything for being in this study?
Upon study completion, parents will receive a $100 gift card.
Will it cost you anything for you or your child to be in this study?
29
Research Institute. This means that the research team is being paid by the sponsor for doing the study. The researchers do not, however, have a direct financial interest with the sponsor or in the final results of the study.
What if you or your child has questions about this study?
You and your child have the right to ask, and have answered, any questions you may have about this research. If there are questions about the study (including payments), complaints, concerns, or if a research-related injury occurs, contact the researchers listed on the first page of this form.
What if there are questions about you or your child’s rights as a research participant?
All research on human volunteers is reviewed by a committee that works to protect you and your child’s rights and welfare. If there are questions or concerns about you or your child’s rights as a research subject, or if you would like to obtain information or offer input, you may contact the Institutional Review Board at 919-966-3113 or by email to
30
Parent’s Agreement:
I have read the information provided above. I have asked all the questions I have at this time. I voluntarily give permission to allow my child to
participate in this research study.
______________________________________________________ Printed Name of Research Participant (child)
______________________________________________________ Signature of Parent
____________________ Date
______________________________________________________ Printed Name of Parent
______________________________________________________ Signature of Research Team Member Obtaining Permission
____________________ Date
______________________________________________________ Printed Name of Research Team Member Obtaining Permission
31
Sample Chain of Custody
CHAIN OF CUSTODY
PAGE__1__of__1__COMMUNITY SAMPLE ID /ADDRESS DATE TIME pH MATRIX PRESERVATIVE ANALYSISand METHOD
COMMENTS
Sample Address 1
Water
05/19/18 Blood 05/19/18 Blood 05/19/18 Dust
05/19/18 Dust 05/19/18 Dust 05/19/18 Dust
05/19/18 Dust
Sample Address 2
Water