THE EFFECTS OF EARLY LIFE DISABILITIES ON HUMAN CAPITAL ACCUMULATION IN YOUNG ADULTHOOD
Fernanda Costa de Queirós
A dissertation submitted to the faculty of the University of North Carolina at Chapel Hill in partial fulfillment of the requirements for the degree of Doctor of Philosophy in the
Department of Maternal and Child Health.
Chapel Hill 2012
Approved by:
Carolyn Tucker Halpern, Ph.D.
Anita M. Farel, Dr.PH.
Julie L. Daniels, Ph.D.
Chirayath M. Suchindran, Ph.D.
ABSTRACT
FERNANDA C. QUEIRÓS: The Effect of Early Life Disabilities on Human Capital Accumulation in Young Adulthood
(Under the Direction of Carolyn Tucker Halpern)
Rates of developmental disability are on the rise in the United States. However, little is
known about the accumulation of human capital by early adulthood among individuals with
disabilities. This dissertation examines the association between having a developmental disability and
six indicators of human capital: education attained, employment status, occupation type, subjective
perception of socioeconomic status, income, and wage rate, using data from the National
Longitudinal Study of Adolescent Health (Add Health). Add Health has followed a large, nationally
representative sample of individuals in the U.S. with four in-home interviews from adolescence
(Wave I) into young adulthood (Wave IV).
In the first paper, I use multivariate methods to describe the associations between
developmental disabilities and study outcomes using a sample of 13,040 Add Health participants who
participated in Wave I and Wave IV. Nearly 11% of this sample presented with a physical or
cognitive disability. Overall, respondents with disabilities reported worse outcomes when compared
with their peers, but differences varied by type of disability. Employment status was not significantly
different between the groups with and without disabilities, an unexpected finding.
Informed by the Social Cognitive Career Theory, the second paper investigates whether
expectations/goals and depression, along with educational level and work experience during
adolescence mediate the association between developmental disabilities and human capital
accumulation in early adulthood. I used a sample of 10,869 Add Health participants with valid Wave
following Baron and Kenny method. Depression, education at Wave III, and adolescent experience
were confirmed to be partial mediators of the main association between disabilities and human
capital, with variations between the disability groups. Education at Wave III had the largest effects,
while the association with depression and adolescent work was modest. Greater attention to the
emotional, educational and vocational context during adolescence may help to enhance these
adolescent experiences to improve young adult outcomes. More broadly, this dissertation highlights
the importance of considering multiple developmental experiences that may contribute to
ACKNOWLEDGMENTS
It is a great pleasure to thank everyone who helped me write my dissertation successfully. I
would never have been able to finish my dissertation without the guidance of my committee
members, Dr. Carolyn Halpern, Dr. Anita M Farel, Dr. Julie Daniels, Dr. Chirayath Suchindran
(Suchi), and Dr. George Wehby. I am thankful for all suggestions that helped me throughout this long
journey. I am sincerely and heartily grateful to my dissertation advisor, Carolyn Halpern, for the
support and guidance she showed me throughout my dissertation writing. I am sure it would have not
been possible without her help. I am truly indebted and thankful to my academic advisor, Anita Farel,
who has been of great support since I decided to pursue this degree in Maternal and Child Health. I
owe sincere and earnest thankfulness to my co-advisor, George Wehby, who has been present in my
professional and academic life since 2005. His insightful comments and constructive criticisms at
different stages of my research were thought-provoking and they helped me focus my ideas. I am
grateful to him for holding me to a high research standard and enforcing strict validations for each
research result, and thus teaching me how to be a better researcher. I am immensely thankful to all the
insightful suggestions of Suchi and Julie Daniels. Your questions and comments helped with the
improvement of my critical thinking and I will always have you as role models.
I would like to acknowledge Dr. Jonathan Kotch for his support in the last semester of my
studies. He is one of the best teachers that I have had in my life and the opportunity to be his research
assistant made an important impact in my life. Besides, I thank Dr. Isabel Lima for our discussions
about capabilities, Dr. Leila Amorim for kindly offer her time to discuss mediation analysis, and Dr.
Rita Lucena, my eternal mentor. I have to give a special mention for the support given by “my
cohort,” Christine Tucker, McLean Pollock, and Sherika Hill. You are not only a sample of the
smartest people I know, but also the best friends I could ever dream to make at this stage of my life.
I would like to express my heart-felt gratitude to my family. Through Skype they aided,
encouraged, and helped me throughout this endeavor. I dedicated this dissertation to all of you who
have always been rooting for me. My mother, Vera Lúcia Queirós, is the one who made all this
possible by investing on us and passing out the belief that education is the way to achieve a better and
more meaningful life (which is, indeed, a key conclusion of my dissertation). I am also indebted to
my beloved Barbara Siegel, who has supporting me since the beginning of this program, in many
ways. You are family.
Many friends have helped me stay sane through these difficult years. Their support and care
helped me overcome setbacks and stay focused on my graduate study. I greatly value their friendship
and I deeply appreciate their belief in me. I need to specifically mention Michelle Miranda, with
whom I shared an apartment, adventures/misadventures in a new country, and every single step of this
long journey to earn a doctoral degree. I am also grateful to Chris Campbell, who came into my life to
show that there is a solution to every problem. Your wisdom and love have made the last months of
this journey easier and more pleasant.
This research uses data from Add Health, a program project directed by Kathleen Mullan
Harris and designed by J. Richard Udry, Peter S. Bearman, and Kathleen Mullan Harris at the
University of North Carolina at Chapel Hill, and funded by grant P01-HD31921 from the Eunice
Kennedy Shriver National Institute of Child Health and Human Development, with cooperative
funding from 23 other federal agencies and foundations. Special acknowledgment is due Ronald R.
Rindfuss and Barbara Entwisle for assistance in the original design. Information on how to obtain the
Add Health data files is available on the Add Health website (http://www.cpc.unc.edu/addhealth). No
direct support was received from grant P01-HD31921 for this analysis. Finally, I appreciate the
financial support from CAPES/Fulbright (Coordenação de Aperfeiçoamento de Pessoal de Nível
Superior, Brazil/ Fulbright Program for non-US citizens, USA; 15087696-1836/07-2) that funded my
TABLE OF CONTENTS
LIST OF TABLES ... vii
LIST OF FIGURES ... x
CHAPTER 1: Introduction ... 1
Research Questions ... 7
CHAPTER 2: Early Life Disabilities and Human Capital Accumulation in Young Adulthood ... 9
CHAPTER 3: Early Life Disabilities and Human Capital Accumulation in Young Adulthood: the Mediating Roles of Psychosocial Well-being and Learning Experience During Adolescence ... 28
CHAPTER 4: Conclusions ... 60
APPENDIX 1: Goodness of fit of multivariate regression models ... 65
APPENDIX 2: Results for tests of goodness of fitness of multivariate regression models ... 71
APPENDIX 3: Odds ratios and beta coefficients from multivariate models of the associations between disability type and human capital outcomes ... 76
LIST OF TABLES
Table 1: Weighted sample characteristics and bivariate associations between sociodemographic and disability status for young adults in the
United States. ... 24
Table 2: Weighted sample characteristics and bivariate associations between educational/economic characteristics and disability status for young
adults in the United States. ... 25
Table 3: Adjusted odds ratios from logistic regression models of educational and vocational status among young adults with a disability as
compared to the group without a disability. ... 26
Table 4: Marginal effects of disabilities on mean income and wage rate in
young adulthood. ... 26
Table 5: Sociodemographic characteristics and outcomes of young adults in
the United States with and without a disability. ... 45
Table 6: Indicators of psychosocial well-being and learning experience
during adolescence (Weighted percentages). ... 46
Table 7: Mediations results (Sobel test) for psychosocial well-being and
learning experience during adolescence. ... 47
Table 8: Logistic regression results for causal step approach testing the effect of depression at wave I on education at wave IV for young adults
with disabilities. ... 48
Table 9: Logistic regression results for causal step approach testing the effect of depression at wave I on occupation at wave IV for young adults
with disabilities. ... 49
Table 10:Logistic regression results for causal step approach testing the effect of depression at wave I on average annual income at wave IV
for young adults with disabilities. ... 50
Table 11:Logistic regression results for causal step approach testing the effect of depression at wave I on minimum wage rate at wave IV for
Table 12:Logistic regression results for causal step approach testing the effect of education at wave III on education at wave IV for young
adults with disabilities. ... 52
Table 13:Logistic regression results for causal step approach testing the effect of education at wave III on occupation at wave IV for young adults with disabilities. ... 53
Table 14:Logistic regression results for causal step approach testing the effect of education at wave III on average annual income at wave IV for young adults with disabilities. ... 54
Table 15:Logistic regression results for causal step approach testing the effect of education at wave III on minimum wage at wave IV for young adults with disabilities. ... 55
Table 16:Logistic regression results for causal step approach testing the effect of adolescent work experience on education at wave IV for young adults with disabilities. ... 56
Table 17:Logistic regression results for causal step approach testing the effect of adolescent work experience on occupation at wave IV for young adults with disabilities. ... 57
Table 18:Logistic regression results for causal step approach testing the effect of adolescent work experience on average annual income at wave IV for young adults with disabilities. ... 58
Table 19:Logistic regression results for causal step approach testing the effect of adolescent work experience on minimum wage at Wave IV for young adults with disabilities. ... 59
Table 20:Goodness of fit for models of subjective socioeconomic status at wave IV. ... 71
Table 21:Goodness of fit for models of education at wave IV. ... 72
Table 22:Goodness of fit for models of employment status at wave IV. ... 72
Table 24:Goodness of fit for models of income at wave IV (Employed
respondents). ... 74
Table 25:Weighted design-based Wald tests assessing the predictors included in the GLM (Gamma, log) model for income at wave IV (Employed
respondents). ... 74
Table 26:Goodness of fit for models of wage rate at wave IV (Employed
respondents). ... 75
Table 27:Estimated cumulative odds ratio and 95% CI in cumulative ordinal logit regression for subjective perception of socioeconomic status by disability status, age, gender, race/ethnicity, parent education, family structure, language of survey administration, and recent
immigration status among young adults. ... 76
Table 28:Estimated cumulative odds ratio and 95% CI in cumulative ordinal logit regression for highest level of education attained by disability status, age, gender, race/ethnicity, parent education, family
structure, language of survey administration, and recent
immigration status among young adults. ... 77
Table 29:Estimates of adjusted odds ratio and 95% CI in logistic regression model for employment status by disability status, age, gender, race/ethnicity, parent education, family structure, language of survey administration, and recent immigration status among young
adults. ... 78
Table 30:Estimates of adjusted odds ratio and 95% CI in logistic regression model for occupation type by disability status, age, gender, race/ethnicity, parent education, family structure, language of survey administration, and recent immigration status among young
adults. ... 79
Table 31:Beta coefficients and 95% CI in generalized linear model for annual income by disability status, age, gender, race/ethnicity, parent education, family structure, language of survey administration, and
recent immigration status among young adults. ... 80
Table 32:Beta coefficients and 95% CI in generalized linear model for wage rate by disability status, age, gender, race/ethnicity, parent
education, family structure, language of survey administration, and
LIST OF FIGURES
Figure 1: Construction of analytical sample with detailed sample exclusions. ... 27
Figure 2: Conceptual model adapted from Lent, Brown, and Hackett (1994).
Social Cognitive Career Theory Model. ... 43
Figure 3: Construction of analytical sample for mediation analysis with
detailed sample exclusions. ... 44
Figure 4: Distribution of income at wave IV. ... 70
Figure 5: Distribution of wage rate at wave IV. ... 70
CHAPTER 1: Introduction
Human capital accumulation is a term mainly used by economists, and is not widespread
among researchers in the field of Maternal and Child Health (MCH). However, the stock of skills
gained through education and other learning experiences throughout a child’s development, and the
potential increase in adult earnings stemming from education, undoubtedly improve health, and
should be discussed more in our field. A better understanding of human capital accumulation could
help MCH professionals, researchers, and policy makers to develop and evaluate policies intended to
improve children’s future achievements. Understanding human capital accumulation for individuals
with disabilities may be especially important. Disabilities that occur during the development process
are known as developmental disabilities; they are the focus of this dissertation.1
Adolescence and the transition into adulthood are important stages of human development.2
however adolescents and young adults with disabilities are the least studied age-groups among those
with disabilities.3 This is an important gap because the needs of this population are similar to those of
their peers without a disability: they need adequate education, job training, employment, and social
inclusion. Unfortunately, these needs remain largely unmet.3
Given the rising prevalence of disabilities in our society, it is increasingly important to
understand the needs of this population. The World Health Organization estimated in 2010 that 15%
of the world’s population (more than a billion people) lived with some kind of disability; in 1970 this
estimate was 10%.4 The trend is not different in the United States.5-9 Recent estimates of the
prevalence of developmental disabilities in the United States among children 3 to 17 years indicate
estimate in 1997-1999.5 This increasing trend has direct implications on how the health, education,
and social needs of this population will be addressed as these children transition to adulthood.
The main source of information on the health of non-institutionalized civilians in the United
Sates, including data on disabilities, is the National Health Interview Survey (NHIS), a
cross-sectional household interview survey. These data do not allow for the establishment of temporality
between exposure and outcome, which limits our knowledge of how disabilities affect individuals
over the life course.10 Other important sources of nationally representative disability information,
such as the decennial census and supplementary surveys, as well as the Survey of Income and
Program Participation (SIPP) and the Current Population Survey (CPS), are also limited by
cross-sectional study design (decennial census), lack of any real disability measure (CPS), and poor
test-retest reliability (SIPP).11 The current study aimed to better explore the temporal relationship between
early life disability and human capital accumulation by young adulthood. Given the longitudinal
design of the data set used here, it also offered the opportunity to investigate potential mediators
linking disabilities and human capital accumulation in early adulthood.
Finally, current research on disabilities is limited by lack of theory.12-14 An innovative aspect
of this project is the use of theory. I used the Social Cognitive Career Theory (SCCT) to inform the
description of pathways pursued by individuals with physical and cognitive impairments compared to
individuals without disabilities in this sample. Measures present in the study data set represent key
constructs in this theory. To the best of my knowledge, no study to date has described work patterns
and expectations/goals among adolescents with disabilities, as well as their potential mediating role in
early adult outcomes.
Developmental disabilities
There are several definitions for disabilities, but the World Health Organization’s is probably
Disability is an umbrella term, covering impairments, activity limitations, and
participation restrictions. An impairment is a problem in body function or structure;
an activity limitation is a difficulty encountered by an individual in executing a task
or action; while a participation restriction is a problem experienced by an individual
in involvement in life situations.15
Under this term, for instance, children born with a condition such as cerebral palsy or Down
syndrome, young people victimized by a car accident or by war, a middle age person afflicted by
severe arthritis, or an elder person suffering from dementia would each be considered to have a
disability.4 I am interested in discussing neurodevelopmental disabilities, or simply developmental
disabilities, which are lasting conditions present at birth or developed before a person reaches age 22,
as defined by the CDC.1,16
Disabilities may significantly impact expected survival and necessitate frequent contact with
medical providers and thus high health care costs. Decouflé and Autry reported a surprisingly high
observed-to-expected mortality ratio of nearly 3 (30/10.1) among children and adolescents with
disabilities.17 Costs associated with disabilities are high, including expenditures associated with
special education, health care services, and supportive care.17 Affected children, when compared with
children without disabilities, have 1.5 times more doctor visits, spend more days in the hospital (464
vs. 55 days per 1,000), and have more visits with non- physician providers (3.0 vs. 0.6). They also
experience higher health care related expenditures (US$2,669 vs. $676).18
The relationship between disabilities and poverty is two-way: disability is both a cause and
consequence of income poverty.19 Thus, not surprisingly, low income families are disproportionately
affected.3,17 Data from 1997- 2008 indicate a nearly twofold higher prevalence of any developmental
disability among children insured by Medicaid when compared to those insured by private insurance.5
A partial explanation comes from the impact of having a child with disability on maternal
employment. For instance, Black single mothers have an estimated 17% reduction in likelihood of
when compared to other developed countries.19 Unfortunately, the importance of disabilities in
research about poverty worldwide is usually underrated.21
The impact of disabilities on education is notorious. Children with disabilities, worldwide, are
less like to start, stay, and finish school.4 In the United States, individuals with disabilities have twice
the number of school-days lost, and a 2.5-fold increase in the risk of repeating a grade in school
compared with non-affected children. Impacts vary by disability type; 47% of children with a learning
disability, for instance, at some point have to repeat a grade, compared to 30.3% with cerebral palsy
and 24.9% of children who have trouble hearing in both ears.18 The United Nations Convention on the
Rights of Persons with Disabilities acknowledged that children and adults with disabilities have the
right to participate in mainstream education systems, receiving adequate support when necessary.4 As
discussed in Paper 1, the effect of disabilities on educational achievement in young adulthood should
be a concern for public health practitioners, since it is necessary to take action to improve educational
outcomes for this population.
Disabilities can reduce quality of life. Individuals with disabilities are at greater risk for
depression and have lower expectations about their futures, especially if they come from low-income
families.22 A recent study of children and adolescents with developmental disabilities found
significantly higher rates of depression among groups with borderline (17%) and mild (28%)
intellectual disability compared with individuals who have a disability but not intellectual
impairment.16 Linkages are also seen among adults. An estimated 29.8% of adults with severe
disabilities suffer from frequent depression, compared to 14.6% of adults with moderate disabilities
and 4.2% of adults with no disabilities.23
Human capital accumulation
Economists noted several decades ago that people are as important for the wealth of their
nations as nonhuman assets are. Hence, investing in humans to increase their “capabilities” is a
adverse effects on human capital accumulation, including education, which impact employment
opportunities and social status. Human capital investment refers to any expenditure that helps
individuals to improve their skills, knowledge, or any other non-material assets.25 Schultz (p. 1) offers
some examples of investment in human capital:
Direct expenditure on education, health, and internal migration to take advantage of
better job opportunities are clear examples. Earnings foregone by mature students
attending school and by workers acquiring on-the-job training are equally clear
examples. (…) In these and similar ways the quality of human effort can be greatly
improved and its productivity enhanced. I shall contend that such investment in
human capital accounts for most of the impressive rise in the real earnings per
worker.26
Four main activities are of great importance for improving human capabilities: health related
investments, on-the-job training, schooling, and migration due to job opportunities.26,27 I am not
discussing the latter here. The importance of investments in health is, understandably, the most
discussed in the field of MCH, while in economics health is probably the least studied aspect of
human capital.28 The economic relationship between health and human capital could be drawn from
the ‘Envelope theorem,’ as discussed by Bleakley (pp. 3 – 4): “This theorem implies that
improvements in health affect income by making human capital more productive, but not via more
investment. This means that lifetime income would rise because childhood health allows you learn
faster and grow up stronger.”29
On-the job training refers to the process aiming to raise future productivity by teaching or
improving workers’ skills while on the job. Such investment varies depending on the goal of the
training and its type, which will drive the time and the amount of money devoted to the training
initiative.27 These types of training initially reduce worker’s earnings to increase them later on (e.g.,
trainee programs), which explains why the curve representing the relationship between age and
School settings, such as elementary school, universities, and technical schools, are also places
where one can gain knowledge. The gains from schooling are very similar to the ones discussed for
on-the-job training. For instance, during the school years a student may earn less than what he/she
would earn if not in school. Investment in education usually does not bring immediate, but rather long
term returns.27 Becker suggests, however, that able persons receive more education and other kinds of
training than their disabled peers.27,30 Such associations between schooling and work experience
instigated the aim to explore the mediational role of these factors during adolescence in the
association between human capital accumulation and disabilities in the Add Health sample.
Summary of prior research
Although not conducted under the label of human capital accumulation, there is a significant
corpus of studies on disability and its association with educational, vocational and economic
outcomes.8,12-14,19,31-36 Nonetheless, there is still a significant gap in the knowledge of how to improve
adult outcomes for individuals with disabilities.3,12 Previous research is characterized by the use of
cross-sectional data that are not representative of the U.S. population, either because the sample is not
intrinsically nationally representative or because it is restricted to individuals with more severe
disabilities.
In addition, there are few studies focusing on adolescents compared with studies including
young children or the elderly. Further, the majority of the studies in the disability field fail to use the
World Health’s Organization’s (WHO) framework recommended for classification of disabilities,
limiting comparability across studies and applicability of research findings for decision makers.6,19
Lastly, lack of theory for testing hypotheses about how observed relationships evolve is an issue in
the studies reviewed. Better understanding of the factors that influence adult employment among
individuals with disabilities could lead to higher work-force participation if adequate support were
Research Questions
This dissertation uses regression models to describe the association between developmental
disabilities and human capital accumulation. It also uses the Baron and Kenny framework to test
whether variables included in the conceptual model mediate the studied relationship. It uses a
nationally representative sample of U.S. adolescents followed into adulthood. The research questions
are grouped in two different papers. Following the presentation of these papers there is an overall
summary with conclusions regarding the importance of these findings for public health practice, as
well as implications for future research on human capital accumulation among individuals with
developmental disabilities. The research questions addressed are:
Paper 1: How are physical and cognitive disabilities, measured in adolescence, associated
with educational attainment, employment status, occupation, income, wage rate, and social
status in young adulthood? Do young adults with physical disabilities have better outcomes
when compared with individuals with cognitive disabilities?
Paper 2: Are the associations between developmental disabilities and human capital
accumulation outcomes in young adulthood mediated by expectations/goals, depression
status, work experience, and educational attainment during adolescence?
The increasing prevalence of disabilities highlights a public health need to comprehend key
associations between developmental disabilities and human capital accumulation. A recent estimate
has shown that expenditure on working-age individuals with disabilities increased between 2002 and
2008, mainly due to increased costs for health care and income maintenance; in 2008 the estimated
cost was an astounding $ 357 billion.37 However, these estimates do not distinguish between
disabilities that occurred early in life versus those that occurred in adult life. Not enough data are
available that a) describe the association between developmental disabilities and human capital
accumulation in young adulthood and b) test the pathways through which such associations originate
Research on disabilities needs more integration across disciplines to help the growing
population of people with disabilities to live “independent, fulfilling, and productive lives.”6 To reach
this goal basic clinical research to understand the causes and ways to prevent disabilities is not
sufficient. Describing paths through which disabilities impact human capital accumulation could help
policy makers to understand and better address the needs of this population. The increased federal
expenditures related to disabilities have direct implications for policies and programs. It is important
to increase expenditure on education and employment services. Nonetheless, investments in these
areas have remained low or even declined since 2002.37 There is definitely a need for better programs
to increase the opportunities available for working-age people with disabilities to enter the job
market, as recommended by American with Disabilities Act. Such investment could lead to a
reduction in reliance on shrinking federal resources.37 The findings from this dissertation can inform
CHAPTER 2: Early Life Disabilities and Human Capital Accumulation in Young Adulthood
Introduction
Disabilities are prevalent health conditions that often impose a large burden on affected
individuals, their families, and society. Disabilities, are either congenital or acquired after birth, and can
be broadly classified as physical, sensory, and cognitive. An individual has a disability if he/she has a
condition or impairment that interferes with one or more major life activities.3 The research described
here will focus on developmental (early life) disabilities, including chronic conditions caused by physical
and/or mental impairments occurring by age 22.1
Several metrics, based on different classification systems, suggest that the prevalence of
disabilities may be increasing. Data from the National Health Interview Survey reveal an increase in
overall disability rates in the population from 11.7% in 1970 to 15% in 1994.9 In 2005, it was estimated
that 18.7% of the population had a disability.38 The increasing trends in prevalence are similar across
various age groups.5,7,9,38 For example, the percentage of adults 18-44 years old with disabilities increased
from 8.8% in 1990 to 10.25% in 1994. Similarly, among children younger than 18, prevalence of
disability increased from 4.2% to 5.6% among girls between 1970 and 1994 and from 5.6% to 7.9%
among boys. The increasing prevalence of disabilities is partially explained by the aging of the American
population and advances in medical treatment.4,6 Similarly, advances in neonatal and pediatric care have
significantly improved the survival of infants at the greatest risk of developing a disability, such as very
preterm and low birth weight children.6,8
Disabilities can adversely affect human capital accumulation, defined here as acquiring
component of human capital and a key determinant of economic performance; it also affects both
long-term socioeconomic status and quality of life.39 Children and adolescents with physical and cognitive
disabilities typically have more limited access to formal education than their non-disabled peers.40 Also,
individuals with disabilities have poorer employment opportunities reflected in lower paying jobs, lower
occupational status, and higher unemployment rates.41 For example, in 2011 the rate of unemployment
among people with disabilities was 15.6% compared to 9.3% among people without a disability.42 In
addition, individuals with disabilities are at greater risk of experiencing poverty. It has been estimated that
34% of adults with disabilities in the US live in households with annual incomes of $15,000 or less,
compared to 12% of non-disabled peers.5
Adulthood is typically characterized by the achievement of specific milestones, such as
completing one’s education, a full-time job, and marriage or childbearing.14 These milestones are directly
related to human capital. The transition starts in the late teens and for the majority of cases may continue
throughout the late twenties, or even early thirties.14,43 Transition into adulthood can be challenging for
any adolescent, but for adolescents with disabilities and their families, this transition may be more
difficult.8 A study using latent class analysis to compare young adults 18 – 26 years old with and without
disabilities concluded that only 15%-25% of men and women with a disability fall into a class of single
adults pursuing post-secondary education. Conversely, 70% of individuals without disabilities were
assigned to this latent class. The majority of individuals with disabilities were single, living in their
parents’ home, not in school or nor engaged in full-time employment (very dependent class, nearly 40%
of respondents with disabilities); or were single, living at home, and working (roughly 35% of
respondents with disabilities).14
Better understanding of human capital accumulation of adults who have lived with disabilities –
in many cases since birth or early childhood – is useful for identifying policies and early life interventions
to improve the socioeconomic success of affected individuals.12 There is currently little knowledge about
how to improve long-term wellbeing of individuals with developmental disabilities. Previous research on
age group for all types of disabilities, including cognitive disabilities, meaning that their needs are not
fully understood nor well considered in educational programs and policies. Further, advocacy and
employment initiatives tend to ignore them.3 Moreover, little is known about the impact of physical
disabilities, particularly disabilities with which the individual has lived since early childhood, on the
process of human capital accumulation. Studies using nationally representative longitudinal data to
examine the transition of adolescents with disabilities to adulthood are few, and those that do exist have
limitations1. Such studies are critical to identify sensitive periods early in life and opportunities for
optimally timed interventions to reduce barriers to a successful transition to adulthood.3,43,44
Using nationally representative data from the National Longitudinal Study of Adolescent Health
(Add Health), this paper examines how early life disabilities are associated with human capital
accumulation in young adulthood, focusing on educational attainment, employment status, occupation,
income, wage rate, and social status. We hypothesize that: (1) young adults with physical and cognitive
disabilities will demonstrate lower education and economic achievements compared to individuals
without disabilities; and (2) individuals with physical disabilities alone will perform better on these
outcomes than individuals with cognitive disabilities.
Methods
Data
The National Longitudinal Study of Adolescent Health (Add Health) is a nationally representative
sample of adolescents in grades 7 to 12 (12 to 19 years of age) in the 1994-5 school year. To date, four
waves of in-home interviews have been completed. The main goal of Add Health is to explain the causes
of adolescent health and health behavior with special emphasis on the effects of multiple contexts of
adolescent life45 Add Health collected data through in-home and in-school self-administered
1
questionnaires completed by adolescents, as well as information from adolescents’ parents/guardians and
school administrators. A sample of 80 high schools and 52 middle schools from the US was selected with
unequal probability of selection. Incorporating systematic sampling methods and implicit stratification
into the Add Health study design ensured this sample is representative of US schools with respect to
region of country, urbanicity, school size, school type, and ethnicity.45 Adolescents were followed after
baseline and studied at three other points in time (Waves II, III and IV), with the most recent round of
in-home interviews occurring in 2008, when the sample was 24 to 32 years of age. Add Health collected data
from incarcerated individuals as well as non-institutionalized civilians, at Waves III and IV.46
A total of 20,745 adolescents answered the in-depth home questionnaire at Wave I (1994-1995).
At that time, Add Health over-sampled individuals with certain characteristics, including 957 individuals
with physical disabilities. Collection of Wave II data occurred in 1996 and nearly 15,000 adolescents who
participated in Wave I were interviewed again, approximately 89% of eligible cases. At Wave III
(2001-2002), a total of 15,197 respondents participated, representing nearly 77% of eligible participants at that
time. A total of 15,701 individuals participated in Wave IV (2008), which represented 80% of eligible
participants at that Wave. We used information from in-home (Waves I and IV) and parent interviews for
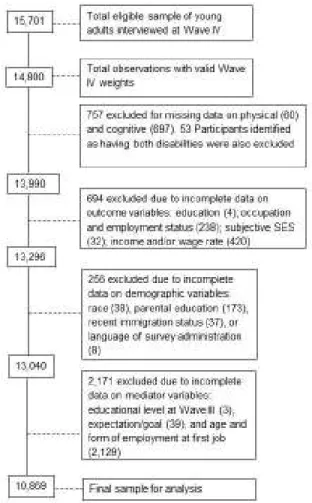
participants with valid Wave IV weights (n = 14,800). Figure 1 provides a detailed breakdown of the
analytical sample construction. Respondents were excluded from final analysis if they were missing data
for measures of disabilities (n = 757), outcomes (n = 694), and demographics (n = 256). Our sample of
respondents presenting both cognitive and physical disabilities was very small (n = 53), precluding our
ability to run analytical comparisons for this sample separately. We therefore excluded this group from
analysis. Applying these exclusion criteria yielded a final sample size of 13,040. All Add Health study
procedures were approved by the Institutional Review Board for the Protection of Human Subjects at the
University of North Carolina at Chapel Hill. Current analyses were deemed exempt from further review
Measures
The data set used in this study adopted the World Health Organization framework for
classification of health and disability: the International Classification of Functioning, Disability and
Health (ICF)2.47 Such a framework has been recommended for research about disabilities to increase
comparability across studies and improve applicability of research findings for decision makers.6,19 In the
ICF disability is used as an umbrella term for physical and mental impairments, activity limitation and
participation restrictions.6,47 We describe below the disability measures in detail.
Developmental disabilities. Respondents were grouped into one of three categories depending on
disability status at the Wave I interview: no disability (referent), physical disability only, and cognitive
disability only. Physical disabilities were measured in terms of physical functional limitation and activity
restriction.48 Details are available elsewhere.49 Cheng and Udry developed a Physical Disability Index
(PDI) for the Add Health data based on a combination of parents’ and adolescents’ responses at Wave I.
The PDI has four categories: nondisabled, minimally disabled, mildly disabled, and more severely
disabled.49 For this study, we collapsed the three categories representing a physical disability (minimally,
mildly, and more severely disabled) into one binary category due to very small cell sizes for some of
these categories. Hence, we had a binary indicator for having a physical disability without cognitive
disability. Mental ability of individuals identified by the PDI as having a physical disability was not
statistically different from the average scores observed for the nondisabled group.49
Cognitive disability was measured in Add Health at Waves I and III using the Add Health Picture
Vocabulary Test (AHPVT), a condensed version of the revised Peabody Picture Vocabulary Test
(PPVT).50 The PPVT correlates moderately with intelligence tests, such as the Stanford-Binet Intelligence
scale (r = 0.72) and the Weschler Intelligence Scale for Children – WISC (r = 0.72).50 It is an instrument
validated to measure receptive vocabulary for standard American English for individuals in the age range
of 2.6 to 90+ years.50 Raw scores obtained by the Add Health version are highly correlated (0.96) with
2 The International Classification of Impairments, Disabilities, and Handicaps (ICIDH) was the framework
scores generated by the original PPVT.51 Hence, lacking measures of intelligence, we used AHPVT
scores as a proxy for cognitive ability, consistent with previous studies.51-53 Test scores are
age-standardized to a mean of 100 and a standard deviation of 15, as in the PPVT. Cut points are parallel to
those used in intelligent quotient classification strategies.54
Using Wave I AHPVT scores, respondents were initially assembled in five categories: below 70
(extremely low), 70-79 (borderline), 80-89 (low average), 90-109 (average) and 110 and above (high
average, superior, and very superior).54 The cognitive disability group includes individuals with scores
below 80, the “extremely low” and “borderline” groups. For the same reason described for the physical
disability measure, we group the two cognitive disability categories into one disability category and the
other two groups in a non-disabled category. Thus, we have a binary 0/1 indicator for having a cognitive
disability without physical disability. It is important to note that the “cognitively disabled” definition in
this study refers to adolescents with low scores on this particular test of oral vocabulary. As
acknowledged by Haydon and collaborators, language skills influence test performance.52 The present
paper follows the same strategy used by these authors to minimize this measurement bias by controlling
for recent immigration status and language of survey administration.
Young adult outcomes. All outcome variables were taken from Wave IV, when respondents were
ages 24-32 years.Educational attainment is the highest level of education reported by respondents.
Education is represented by an ordinal variable with four categories: for “less than high school,” “high
school graduate,” “some education beyond high school,” and “college graduate or higher degree.”55 Five
measures of socioeconomic performance were used: employment status, annual earned income, wage
rate, occupation, and subjective perception of own socioeconomic status.
Employment status was a dichotomous indicator for working at least 10 hours per week. Annual
earned income was measured as a continuous variable for all pretax earnings in the previous year3. In the
few cases where respondents answered “Don’t know,” a follow-up question requested individuals to
3
select an income range that reflected the best estimate. In order to treat all available responses as
continuous, the midpoints of the ten possible income ranges were used in these cases. Also for those
respondents working at the time of the Wave IV interview, the wage rate was computed4.
Current or most recent occupation was coded according to a variation of the Standard
Occupational Classification and Coding Structure (SOC), the framework used by Add Health to classify
occupation.56 Occupations in the SOC fall into 23 major groups and are grouped together according to
similar job duties, and in some cases skills, education, and/or training. We planned to adopt the
classification by Kirchhoff and collaborators57, which is based on the SOC. They excluded military
occupations due to potential differences in skill requirements to be admitted into a military career, which
tends to exclude individuals with disabilities. They created three categories: ‘‘Professional/Managerial’’
(which includes 10 SOC groups), ‘‘Service/Blue Collar Non-Physical,” (derived from 12 SOC groups)
and ‘‘Service/Blue Collar Physical” (derived from the same 12 SOC groups of the previous category).
Add Health also asked participants to describe the level of physical activity required to perform their jobs.
However, there was a large amount of missing data (n=2,447) for this question due to a planned skip in
the questionnaire. Thus, following the same rationale as Kirchhoff et al., but not using the
sub-classification of physical or non-physical, we classified respondents into two categories, represented by
the binary variable ‘‘Professional/Managerial’’ (1) and ‘‘Service/Blue Collar” (0).
Finally, subjective perception of own socioeconomic status (subjective SES)was measured by
asking respondents to mark their SES level on a 10-step ladder5. This measure is based on the MacArthur
scale of subjective social status, which is strongly linked to several SES domains (e.g., educational level,
individual income, and occupation).58,59 The variable was recoded to have three categories (collapsing
4
Annual earnings were divided by 12 to represent monthly income. Wage rate was then computed by dividing the total monthly earnings by the total number of hours worked in a month. Respondents were asked “How many hours a week (do/did) you usually work at this job?” We multiplied the answer by 4.1 to obtain estimated hours per month worked.
5
categories 1,2,3; 4,5,6; and 7,8,9,10) because categories 1,2, 8, 9, and 10 had small cell sizes when
tabulated against the disability variable with three categories.
Control variables.Covariates of interest are background variables that are both theoretically and
empirically relevant to the outcomes in this study and may also influence disability risk. (14, 15, 17, 33)
Age at Wave IV was measured in years and computed at the time of the interview. Gender is a
dichotomous variable (0=male, 1=female). We created dummy variables for the categories of
race/ethnicity, measured at Wave I (White, non-Hispanic; Black or African American, non-Hispanic;
Hispanic, all races; and Others, with White as the reference category).60 Socioeconomic status of the
respondent’s family of origin was based on highest level of education for either parent and was coded
using the same categories as respondent education.55 Recent immigration status, measured at Wave I, was
a dichotomous variable (0 = nonimmigrant or immigrated more than five years ago and 1 = immigrated
within the last 5 years), as was language of survey administration (0 = non-English and 1 = English).52
Family structure, also measured at Wave I, is represented by dummy variables equivalent to three
categories (2 biological parents, 2 parents–1 or more not biological, and “other” family structure, with 2
biological parents as the reference category).60
Data analysis
We first examined bivariate associations among disabilities, covariates, and
educational/vocational outcomes. Pearson Chi-square test was used to compare frequency distributions
and adjusted Wald tests were used to compare mean income and wage rate. Logistic regression was used
to model dichotomous outcomes (employment status and occupation), controlling for the covariates
described above. Subjective perception of socioeconomic status and education were analyzed as ordinal
variables using ordinal logistic.61 Due to their positive skewed distribution (See figures 2 and 3), income
and wage rate were examined using generalized linear models (glm), with a gamma family and log link.
All models fit the data well. (See Appendix 1 and 2 for details) The data were analyzed using the software
Stata 11.2 (College Station, TX) and survey commands were used to adjust for Add Health's complex
Results
Characteristics of participants and bivariate associations with disability
Among the 13,040 participants in the study sample 10.5% had some level of a developmental
physical or cognitive disability. Nearly 5.5% of respondents were classified as having a physical disability
only and 5% as having a cognitive disability only. Table 1 presents sociodemographic characteristics of
the study population. Respondents in the analysis sample were between 24 and 33 years of age at Wave
IV, with a mean age of 28.8 years (SE = 0.1). Half of respondents were male and almost 70% were
non-Hispanic White. Most parents had a high school diploma (~33%) or some education beyond high school
(~29%). The majority of respondents grew up in a family with two biological parents (~ 56%). The
breakdown by disability category is also shown on this table.
The human capital measures of individuals with disabilities were different from those without
disabilities (Table 2). Overall bivariate tests indicate significant associations between disability status and
all sociodemographic characteristics, except for age, and all human capital outcomes. When compared
with individuals without disabilities, young adults with physical disabilities were less likely to: have a
college degree or higher (33.2% vs. 23.8%); be currently employed (77.9% vs. 83.0%); work in a
Managerial/ occupation (34.5% vs. 38.1%); and rank themselves at higher levels of the SES ladder6
(14.3% vs. 19.0%). Their mean annual working income and wage rate were lower than their non-disabled
peers (37,798 vs. 39, 298 U.S. dollars, and 18.4 vs. 19.1 dollars/hour, respectively). Respondents with
cognitive disabilities, compared to those without a disability, were less likely to: have a college degree or
higher (11.7% vs. 33.2%); be currently employed (77.9% vs. 83.0%); work in a Managerial/ occupation
(21.11% vs. 38.1%); or rank themselves at higher levels of the SES ladder (18.6% vs. 19.0%). Their mean
annual working income and wage rate were lower than their non-disabled peers (27, 305 vs. 39, 298 U.S.
dollars, and 13.4 vs. 19.1 dollars/hour, respectively).
6
Multivariate analysis
Table 3 presents the results for multivariate models of education, employment status, occupation,
and subjective SES; Table 4 reports the results for income and wage rate. As mentioned above, all models
are adjusted for age, biological sex, race/ethnicity, highest parental education, family structure, language
of survey administration, and recent immigration status. Adjusting for all covariates, young adults with
disabilities fare significantly worse on most outcomes compared to respondents without disabilities.
Physical disability. Respondents with physical disabilities had lower educational attainment
levels (OR 0.69, 95% CI: 0.57-0.85) and ranked themselves in lower positions on the subjective SES
ladder (OR=0.71, 95% CI: 0.57-0.88). However, respondents with a physical disability were not
statistically different from the group without a disability on employment status, occupation type, average
annual income, or wage rate.
Cognitive disability. Compared to individuals without disabilities, young adults with a cognitive
disability also had lower educational attainment (OR = 0.41, 95% CI: 0.33 – 0.52) and, when employed,
were less likely to have a professional/managerial occupation (OR = 0.50, 95% CI: 0.39 – 0.64). Unlike
respondents with a physical disability, respondents with a cognitive disability, when employed, earned
US$10,419 less annually (95% CI: -14,954.79 – -5883.37) and US$ 5.38 hourly (95% CI: -7.64 – -3.12).
Individuals with cognitive disabilities were not statistically different from those without a disability on
employment status or subjective perception of socioeconomic status.
Discussion
We evaluated the association between having a developmental physical or cognitive disability
and young adults’ achievements on education, employment, earned income, and subjective SES using a
nationally representative sample of in-school adolescents in the 1994-95 school year. We found that
individuals with disabilities, especially those with cognitive disabilities, were disadvantaged when
Both respondents with physical and cognitive disabilities had lower educational levels when
compared with individuals without disabilities. It is well known that individuals with cognitive
disabilities attain lower educational levels in adulthood.34 As previously observed in a study using
longitudinal data14 individuals with any type of disability were less likely to achieve age appropriate
education. Thus, our findings are consistent with similar cross-sectional and longitudinal studies, and also
highlight that poor educational outcomes also affect individuals with physical disabilities.12,14
Respondents with a physical disability also saw themselves as lower on the socioeconomic ladder. In
contrast, respondents with a cognitive disability were not different from those with no disability on the
SES ladder, but were less likely to be in professional/managerial occupations, had lower mean incomes,
and lower wage rates.
Present findings for the cognitive disability group are consistent with those seen in other studies,
and also indicate that when working, individuals with cognitive disabilities occupy low-paying jobs and
low occupational status.12 Data from the 90’s indicate that the vast majority of workers with
developmental disabilities ages 22 to 65 were more likely to be engaged in blue collar occupations.35
Thus, our findings suggest no change in occupation type since that time. However, we find no differences
related to cognitive disability in perception of socioeconomic status or employment status. We discuss
subjective perception of socioeconomic status and employment status findings below.
While almost all indicators of human capital at young adulthood were clearly worse for
individuals with cognitive disabilities, respondents with physical disabilities had vocational and economic
outcomes similar to those without a disability. Nonetheless, educational outcomes and subjective
perception of own socioeconomic status were significantly worse for young adults with physical
disabilities when compared to their peers without a disability. Although it has been described that, overall,
individuals with disabilities are underrepresented in the work force12 our findings suggest that individuals
with physical disabilities should be considered separately, given that we did not observe significant
differences in employment, occupation status, income, or wage rates between individuals with and
In contrast to other studies, neither disability group differed from the reference group in terms of
employment status when other variables are controlled.12,14 In a post-hoc sensitivity analysis we observed
that the predictors with strongest associations with employment status were family structure and parental
education. The association between disability and employment is statistically significant when these
controls are not included in the models. Studies have shown how family of origin characteristics
associated with poverty strongly predict economic outcomes later in life62, and our findings suggest that
this is also true for individuals with disabilities.
Specifically regarding income and wage rate findings, we suggest there may be two different
mechanisms operating for the groups with disabilities. A study investigating labor market discrimination
against women with disabilities concluded that functional limitations influence employment status, but
not earnings.36 The authors speculated that those who are employed meet the requirements to be in the
job. Thus, their limitations would not affect their productivity nor their earnings. This rationale seems to
be applicable to individuals with physical disabilities of both genders in our sample, whose earnings were
not significantly different from the reference group7. However, in our sample employed individuals with
cognitive disabilities did earn significantly less than young adults without disabilities. Assuming they also
meet job requirements, given their employment, our findings suggest that individuals with a cognitive
disability may be more likely to be discriminated against because of their disability status. Hence, even
when employed, they are not equally respected as those without a disability or with a physical disability.
Study contribution. Our study brings the follow contributions to better understanding of the
transition of individuals with disabilities to adult life: (1) educational outcomes, despite current policies,
are worse for individuals with disabilities; and (2) differences in subjective perception of socioeconomic
status suggest that, despite other positive outcomes, individuals with physical disabilities perceive
themselves to be lower in status than similarly educated/employed individuals without disabilities. In
contrast, individuals with cognitive disabilities perceive no SES differences, suggesting that the needs of
this group are different. Hence, groups with physical disabilities should be considered separately from
7
groups with cognitive disabilities. Our study shows that they are more similar to individuals without
disabilities than are those with cognitive disabilities.
Study implications. Individuals with physical disabilities must be studied separately from
individuals with cognitive disabilities when assessing policy impact. Despite policies that have been in
place for decades (such as the 1990’s Individuals with Disabilities Education Act – IDEA, and Americans
with Disabilities Act – ADA), multiple indicators of human capital are still far worse for individuals with
disabilities compared to those without. The IDEA, for instance, requires that a plan for transition be
incorporated into the individualized education program (IEP) no later than an adolescent’s 16th birthday.63
This federal law was implemented in 1990, which suggests that younger individuals in our sample could
have benefitted from this law when participants were between 12 and 19 years old. However, policy
implementation is an evolving and political process, and poses challenges for individuals and service
delivery systems.63 As for educational outcomes, our results suggested that this cohort probably did not
benefit from IDEA.
On the other hand, one can hypothesize that ADA may have contributed to positive results among
young adults with physical disabilities in our sample given that more time elapsed between the
implementation of this policy and the time when sample members would have begun adult employment.
ADA’s title I (Employment) states that “Employers, employment agencies, labor organizations and joint
labor-management committees must have non-discriminatory application procedures, qualification
standards, and selection criteria in all other terms and conditions of employment.”64 Considering that we
have enough power to detect significant differences across groups, one explanation for this lack of
difference is the positive impact of this federal policy on employment, income and wage rates for
individuals with physical disabilities.
Previous work using data from the Panel Study of Income Dynamics (PSID) from 1981 to 199633
did not observe a positive effect of this policy, but also did not suggest a negative impact as did another
study using 1986 through 1993 data from the Survey of Income and Program Participation (SIPP).41 Both
law in 1990 while our study evaluated outcomes measured in 2008.41 Conversely, individuals with
cognitive disabilities, as defined in our analysis sample, do not appear to have benefited from these
policies.
Importance of subjective socioeconomic status for policy development. As mentioned earlier,
human capital is more than just economic outcomes. Our findings indicate that educational outcomes still
have to be improved for people with disabilities. Individuals with physical disabilities, who did not differ
in income and occupation from those not disabled, did differ in education and in subjective
socioeconomic status, which are significantly correlated in this sample. Although subjective SES does not
perfectly correlate with the others indicators of SES, as observed in previous studies,58,59 its stronger
correlation with education indicates the important role of education in the self-perception of status in a
society.
Accumulating human capital and being “capable” of entering adult life is, ultimately, one of the
main goals of individuals in our society. It is necessary to identify whether, and how, existing policies are
helping to reduce inequalities by improving the capability of individuals with disabilities to successfully
transition into adulthood. Our findings suggest the answer may vary by disability type, specifically on the
level of functionality an individual with any type of disability possesses. It also depends on the indicators
used to assess the transition, which, again, should consider different elements of human capital
accumulation.
Study strengths. In contrast to previous research using longitudinal data, our sample included
youth in grades 7 - 12 with varying levels of impairment.14 The large and diverse Add Health sample is an
important strength of present analyses. Combining the strengths of this data set (a longitudinal, nationally
representative one) with the focus on adolescents with disabilities will help the field to better understand
the impact of developmental disabilities through the life span.
Study limitations. First and foremost, despite the advantage of having individuals with different
levels of impairment represented in our sample, we were not able to stratify our analysis by level of
which suggested that outcomes were more affected by more severe impairment. Results from studies
using such an approach would help public health stakeholders to better determine health, educational, and
vocational intervention policies based on functionality levels instead of traditional classification of
diseases. Second, our measure for cognitive disability – the Add Health Peabody Vocabulary Test – is
only a proxy of intelligence. Ideally, different facets of cognitive functioning would be directly measured
to accurately classify cognitive disabilities. Although Add Health intentionally oversampled individuals
with physical disabilities, the broad scope of the overall study did not allow for the level of precision of
disability measurement that would be possible in a study focused on disability. Finally, our measure for
employment status represents individuals that were working at least 10 hours/week. Full time status may
yield different results from those observed in our multivariate analysis.
Conclusion
Understanding how disabilities affect success in school and in work is crucial to improve
outcomes for individuals with disabilities. As hypothesized, we observed in this study that individuals
with developmental disabilities, depending on type and outcome examined, are disadvantaged relative to
those without disabilities. Individuals with either physical or cognitive disabilities fared worse on
educational outcomes. However, individuals with physical disabilities not only presented better outcomes
when compared with the group with cognitive disabilities, but also achieved comparable vocational and
economic outcomes to the group without a disability. Facilitating similar socio-economic opportunities
for individuals with disabilities who are able to work should be as important as guaranteeing an adequate
health transition. Our findings for young adults with physical disabilities suggest the potential benefits of
society viewing support for individuals with disabilities as a social responsibility rather than a medical
Table 3: Adjusted odds ratios from logistic regression models of
educational and vocational status among young adults with a disability as compared to the group without a disability.
Outcomes Physical disability
a OR (95% CI)
Cognitive disability a OR (95% CI)
Highest Education .69 (.57-.85)** .41 (.33-.52)**
Employment status .75 (.54-1.03) .77 (.54-1.08)
Occupation .84 (.66-1.09) .50 (.39-.64)**
Subjective SES .71 (.57-.87)** 1.01 (.79-1.30)
Table presents results of binary and ordered logistic regression models comparing outcomes between young adults with a disability and those without a disability (reference categories: College graduate, Employed, Currently working, Managerial occupations, Highest position on the SES ladder), controlling for sex, age, race/ethnicity, and highest parental education.
a
Referent group is the group with no disabilities. OR= odds ratio; CI= confidence interval.
* p < .05; **p < .01
Table 4: Marginal effects of disabilities on mean income and wage rate in young adulthood.
Outcomes Physical disability a
Mean (95% CI)
Cognitive disability a Mean (95% CI)
Mean Income , in U.S. dollars -2030.417 (-6011.69 1950.858) -10,419.05 (-4954.73 -5883.37)* Wage rate, in U.S. dollars/hour -1.08 (-3.02 0 .85) -5.38 (-7.64 -3.12)*
Table presents results of marginal effects estimated by generalized linear models, controlling for: gender, age, race/ethnicity, highest parental education, family structure, recent immigration status, and language of survey administration. Sub-population of workers (n=10,801).
a
Referent group is the group with no disabilities. CI= confidence interval.
Figure 1: Construction of analytical sample with detailed sample exclusions.
CHAPTER 3: Early Life Disabilities and Human Capital Accumulation in Young Adulthood: the Mediating Roles of Psychosocial Well-being and Learning Experience During Adolescence
Introduction
Approximately 1 in 6 children in the United States had a developmental disability in 2006 –
2008.5 A developmental disability occurs any time before persons reach their 22nd birthday.1 It is
well known that post-school outcomes for people with disabilities are poorer than those of their peers
without disabilities. The transition to adulthood for the former population is marked by special
challenges and barriers.14
Several studies have shown that young adults with disabilities are less likely to have achieved
milestones associated with the early transition into adulthood, such as having attained age-appropriate
education and employment.13,14,42 When individuals with disabilities are employed, they are more
likely to work at a low paying job31 and to earn less.12 Despite these documented outcomes, relatively
little is known about how to characterize the pathways underlying this link.12
Some studies have suggested that characteristics such as lack of self-determination and
depression interfere with career development and the transition into adulthood.16,22,23,32 However, to
date, there are few longitudinal studies examining these relationships among individuals with
developmental disabilities. In addition, current research on disabilities is usually limited by lack of
theory.3,13,14 which would otherwise enrich discussion, and understand of research findings.
Researchers and practitioners, in the best of circumstances, collect and interpret evidence based on