SREE Spring 2015 Conference Abstract Template A-4
Title Page
Title:
Meaningful Effect Sizes, Intra-class Correlations, and Proportions of Variance Explained by Covariates for Planning 3 Level Cluster Randomized Experiments in Prevention Science
Authors and Affiliations:
Nianbo Dong, Wendy M. Reinke, and Keith C. Herman University of Missouri
Catherine P. Bradshaw University of Virginia
Desiree W. Murray
Duke University and Frank Porter Graham Child Development Institute, University of North Carolina, Chapel Hill
1
Background / Context:
Cluster randomized experiments are now widely used to examine intervention effects in prevention science (National Research Council & Institute of Medicine, 2009). In designing cluster randomized experiments with sufficient statistical power to detect a meaningful effect size of an intervention with precision, researchers need to make reasonable assumptions about the design parameters to estimate the required sample sizes. Three critical design parameters associated with statistical power are: (1) effect sizes, (2) intra-class correlations (ICCs), and (3) proportions of variance explained by a covariate at different levels (R-squared). The larger the desired/expected effect size, the larger the statistical power. However, the assumption of the desired effect size of an intervention needs to be realistic, which could be small but still meaningful. Statistical power is sensitive to ICC, and it decreases when ICC increases. Good covariates can improve estimate precision and increase statistical power. All the above design parameters are closely related to the statistical power or the sample sizes required to detect the intervention effects with sufficient power. Recently, several studies have been conducted to report the ICCs and R-squared for academic achievement outcome measures (e.g., Hedges and Hedberg [2007; 2014] on mathematics and reading and Westine, Spybrook, and Taylor [2014] on science achievement) and outcome measures for teacher professional development (Kelcey & Phelps, 2014). However, there is limited information about these design parameters on social behavioral outcomes to inform prevention scientists designing cluster randomized trials.
In addition, it is meaningful to use empirical benchmarks for interpreting effect size in prevention science. The effect size (i.e., the standardized mean difference, calculated by the difference of the means between the treatment and control groups, divided by the pooled standard deviation of the two groups) provides one way to interpret the substantive or practical significance as compared to the statistical significance of interventions (Hill, Bloom, Black, & Lipsey, 2008). The conventional interpretation of the effect size magnitudes is to use the rules of thumb suggested by Cohen (1988); that is, an effect size of approximately 0.20 is considered “small”, approximately 0.50 is considered “medium”, and approximately 0.80 is considered “large”. Cohen’s guidance has been widely used by researchers and policy makers in interpreting effect sizes. More recently, Hill, Bloom, Black, and Lipsey (2008) argued that effect sizes should be interpreted with respect to empirical benchmarks that are relevant to the intervention, target population, and outcome measure being considered. In particular, these benchmarks can include: (a) normative expectations for change, (b) policy-relevant performance gaps, and (c) effect size results from similar studies. Hill and colleagues (2008) illustrated these benchmarks regarding academic achievement. However, there are no comparable studies in social behavioral domains that would provide empirical benchmarks necessary for researchers and policy makers to interpret the magnitude of the intervention effects on social behavioral outcomes.
Purpose / Objective / Research Question / Focus of Study:
The purpose of this study is to provide reference values of these design parameters by analyzing data from four large scaled intervention studies. In particular, we are going to estimate: (1) the empirical benchmark of meaningful effect sizes regarding the developmental annual growth, and policy-relevant demographic performance gaps (race/ethnicity, gender, and SES); (2) ICC for schools or/and teacher/class; and (3) R-squared at different levels (school,
2
Significance / Novelty of study:
This study will contribute to the literature by providing empirical reference values of these design parameters on social-behavioral outcomes. Researchers can use these reference values to conduct power analysis for designing cluster randomized experiments examining similar behavioral outcomes for young children. In addition, this study will help researchers further understand those outcome measures and interpret the intervention effects.
Research Design:
Data. Data for this study came from four separate cluster randomized trials (RCTs) evaluating the effectiveness of school-based prevention interventions. Two of the cluster RCTs evaluated the efficacy of the Incredible Years Teacher Classroom Management (IY TCM) program (Reinke, Herman, & Dong, 2014; Murray et al., 2014). IY TCM is a universal classroom management training program for teachers.
The first of these two IY TCM trials was conducted in Missouri. Participants in this group randomized trial were 105 teachers and 1818 students in grades kindergarten to third from nine urban schools serving primarily African American students (Reinke et al., 2014). Teachers were randomly assigned to receive IY TCM or to a wait-list control group. The majority of teacher participants were female (97%) and white (75%; 22% African American and 3% other). The student sample included more males (52%) and African American students (76; 22% White, and 2% other), and half the student sample qualified for free or reduced lunch. The second IY TCM trial (Murray et al., 2014) enrolled 1276 students in grades K-2 from 97 classrooms across 11 schools. Classrooms were randomly assigned to receive the IY TCM program or to a wait-list comparison condition. Participating schools were drawn from three rural to semi-rural school districts in the central part of North Carolina. The sample of children was ethnically diverse (54% Caucasian, 22% Hispanic, and 17% African-American). Teachers were primarily female and Caucasian (94.8% and 81.4%, respectively. Distribution of teachers across grade levels was unequal (K=36, 1st=26, 2nd=35).
Data from two additional cluster RCTs investigated the impact of a school-level prevention intervention called Positive Behavior Intervention and Support (PBIS) (Bradshaw, Mitchell, & Leaf, 2010; Bradshaw, Pas, Goldweber, Rosenberg, & Leaf, 2012). PBIS is a school level intervention that attempts to reduce disruptive behaviors and promote prosocial behaviors.
The first of the PBIS trials involved a group randomized evaluation of PBIS Plus, an enhanced version of PBIS which includes a structured intervention for students who do respond to the school-wide supports (Bradshaw et al., 2012). The trial included 42 elementary schools in Maryland. Data were collected on 29,569 students and 3,202 staff. The majority of students were African American (54.3%; 33.1% White; 7.9% Hispanic). Forty-three percent qualified for free and reduced lunch. The second of the PBIS trials involved a randomized controlled effectiveness trial of SWPBIS conducted in 37 elementary schools in five school districts in Maryland
(Bradshaw et al., 2010). Participating schools were diverse with regard to setting and economic characteristics; 48% were suburban, 41% urban fringe, and 49% received Title I support. The trial included 12,341 students with roughly equal numbers of African American (45.1%) and White (46.1%) students.
3
Variables. The Teacher Observation of Classroom Adaptation-Checklist (TOCA-C;
Koth, Bradshaw, & Leaf, 2009) is a nonclinical measure of children’s behavior completed by teachers. For over 30 years, various version of the TOCA have been used in large-scale research trials to assess the impact of school-based prevention interventions on teacher ratings of
children’s behavior. Subscales of the TOCA-C include disruptive behavior, concentration problems, prosocial behaviors, emotional regulation using a Likert scale (from 1 = never to 6=
almost always). The psychometric properties of the TOCA have been well documented (see Koth
et al., 2009). The Social Competence Scale-Teacher version (T-COMP; CPPRG, 1995) is a measure of social and academic competence completed by teachers. This measure includes a 6-point, Likert-type scale with item responses ranging from 0 (almost never) to 5 (almost always).
Scores are summed into three subscales (prosocial behavior, emotional regulation, and academic competence) and a total competence score. Previous research has found adequate psychometric properties for the three subscales and the total score (see CPPRG, 1995; Gouley, Brotman, & Huang, 2008). Demographics. The other relevant variables used in the analyses include student
grade, race/ethnicity, gender, status of free or reduced-price lunch, and treatment status.
Analytic Plan. Applying similar approaches as Hill, Bloom, Black, and Lipsey’s (2008), we calculated two types of benchmarks: (a) normative expectations for change, and (b) policy-relevant demographic performance gaps.
BENCHMARK 1: NORMATIVE EXPECTATIONS FOR CHANGE. The first empirical benchmark refers to expectations for annual growth or change in the absence of an intervention. In the context of prevention and educational sciences, the question is: “How does the effect of an intervention compare to a typical year of growth for a given target population of students?” (Hill, et al., 2008, p.173). Hill, et al. (2008) calculated annual growth in achievement in effect size by calculating the difference of mean scores in adjacent grades divided by pooled student-level standard deviation for the two adjacent grades. In addition to calculating annual growth using adjacent grades, we used measures at both the beginning and the end of grades. We computed annual growth by calculating the mean score difference between the end and the beginning of each grade divided by pooled student-level standard deviation for the scores at the end and the beginning of each grade using data from the control group only. The 95% confidence intervals were also calculated.
BENCHMARK 2: DEMOGRAPHIC PERFORMANCE GAPS AMONG SUBGROUPS. It is well known that there are policy-relevant demographic academic performance gaps among subgroups, and educational policies have been made to reduce performance gaps regarding race/ethnicity, gender, and social economics status (SES). In this context, the question is: “How do the effects of an intervention compare with existing differences among subgroups of
students…, ?” (Hill, et al., 2008, p.174). These demographic performance gaps in effect sizes are calculated by the mean differences between two subgroups of children (White vs. Black, White vs. Hispanic, Female vs. Male, and eligible vs. ineligible free or reduced-price lunch) divided by the pooled standard deviation of two groups. For the outcome measure at the beginning of each grade, i.e., the pretest prior to receiving intervention, we used all the participants from both study groups; for the posttest outcome measure after receiving the intervention, we only use the sample from the control group to estimate the natural gaps.
4 reduced price lunch. We calculated the intraclass correlations and the proportions of variance explained by the covariates for three-level models, where students (level 1) nested within classrooms (level 2), and classrooms nested within schools (level 3). In addition, we used the formulas that were developed by Hedges, Hedberg, and Kuyper (2012) to calculate the standard errors of the ICCs and 95% confidence intervals for three-level models. We estimated these parameters using four models: (1) unconditional model, (2) conditional on demographic
variables, (3) conditional on pretest, and (4) conditional on demographic and pretest. Because the data that we used were from intervention studies, we included the treatment condition in all the models to eliminate the treatment effects in estimating ICCs and R-squared.
Findings / Results:
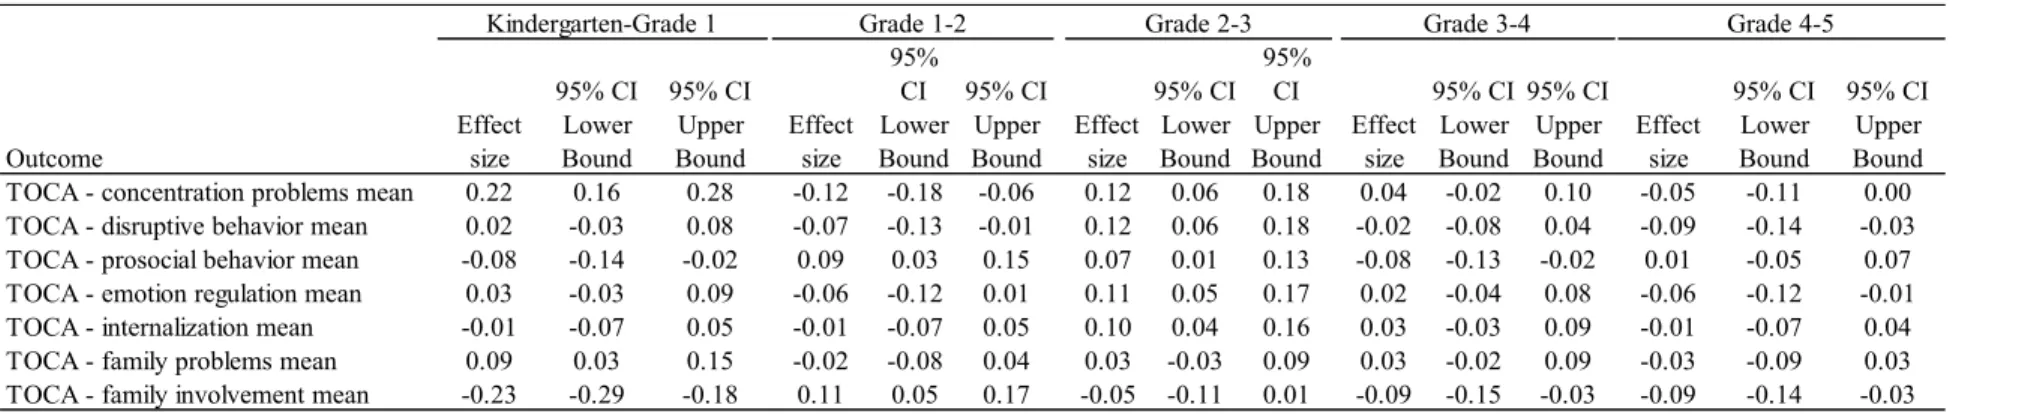
(a) Normative expectations for change. The results of the normative expectations for change (annual gains) as measured by the difference between two adjacent years are presented at Table 1. In general, the annual gains are small. Most gains are less than 0.10.
[Table 1 about here]
Supposing that the effect size for an intervention on prosocial behavior is 0.10 at Grade 2, then based on the results in Table 1, we can interpret the effect sizes of this intervention as
representing about 111% (=0.10/0.09) improvement over the annual gain for second-graders. More discussions about this interpretation can be found in Lipsey et al. (2012).
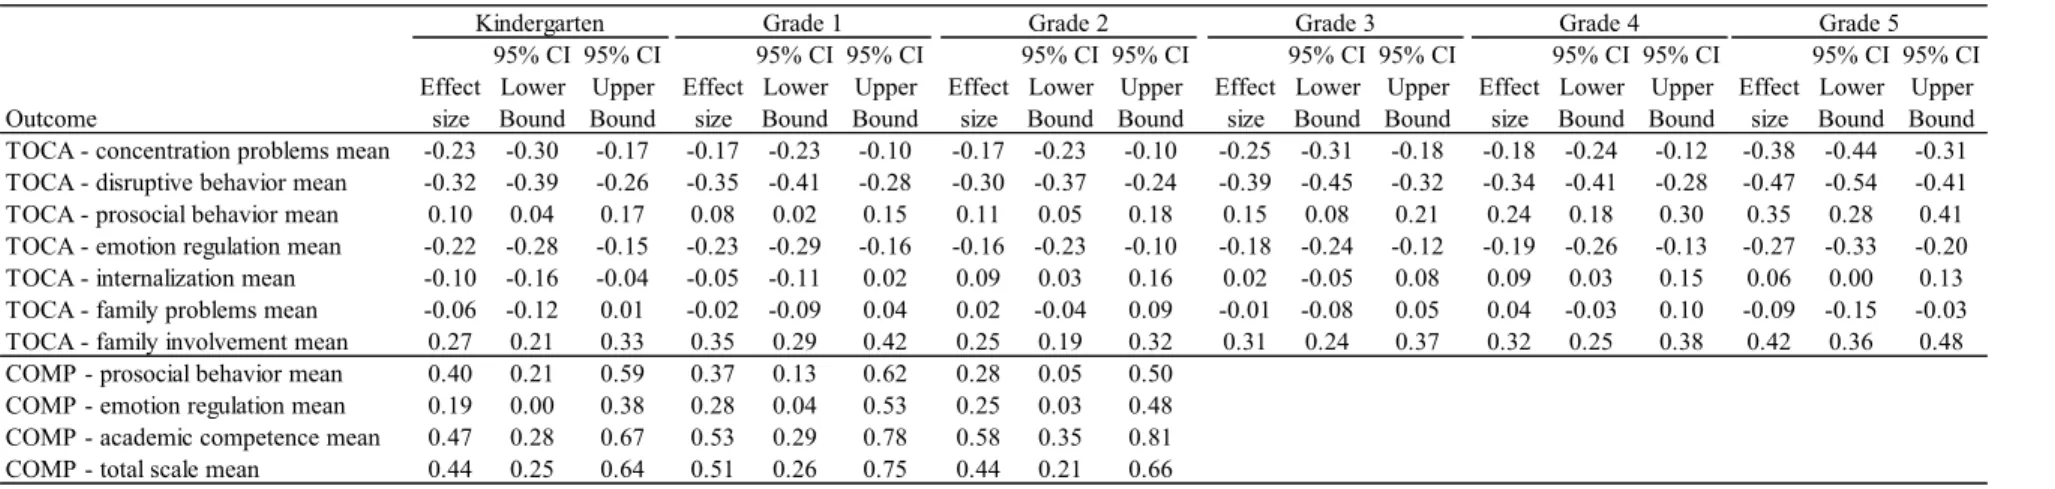
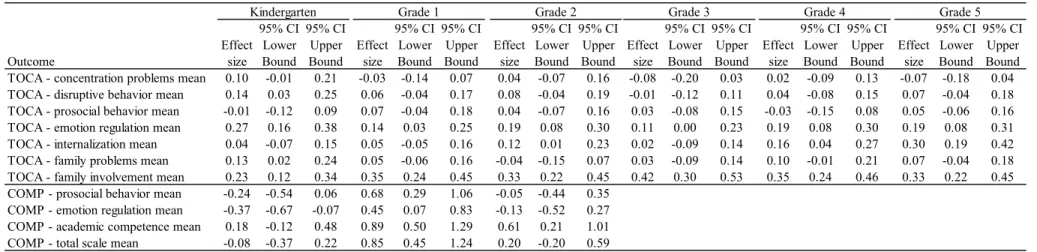
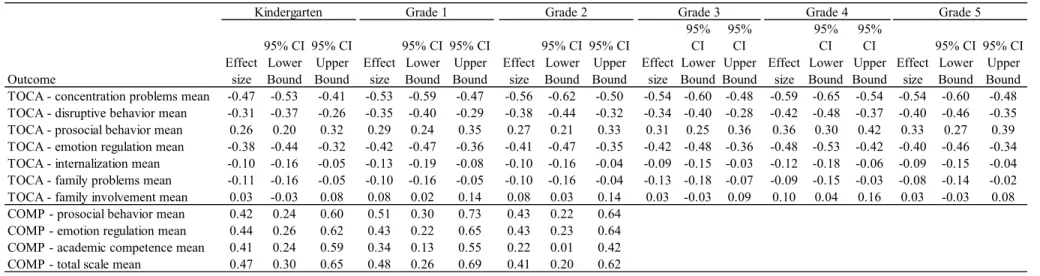
(b) Demographic performance gaps among subgroups. Tables 2 – 5 report standardized mean difference effect sizes for the performance differences between selected subgroups on the TOCA and T-COMP measures. Statistically significantly large gaps exist for most measures across subgroups favoring students who are white, female, and ineligible for free or reduced-price lunch.
[Tables 2 - 5 about here]
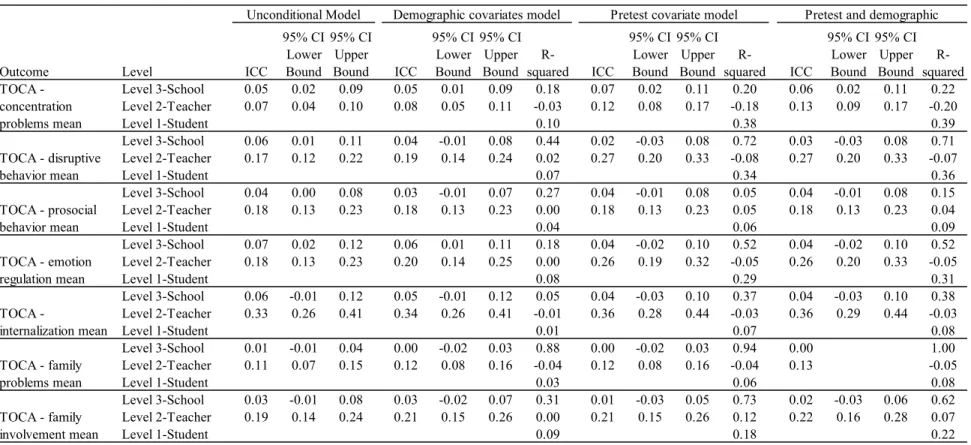
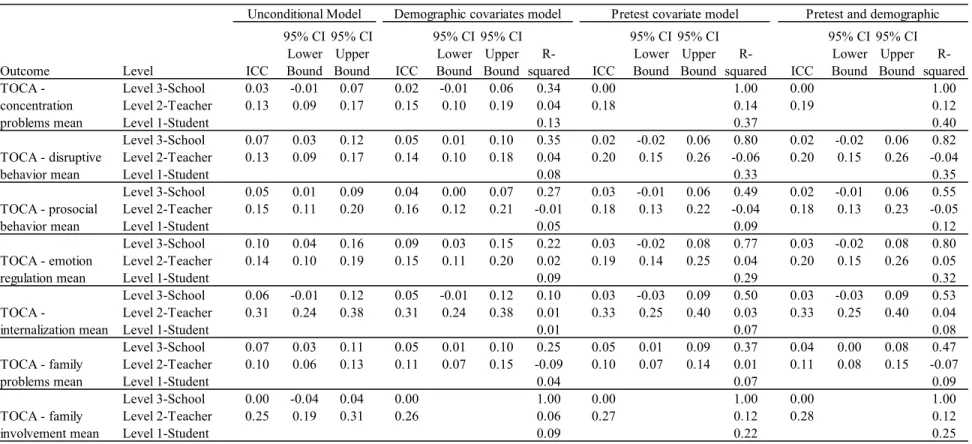
(c) Intraclass correlations (ICCs) and proportions of variance explained by the covariates (R-squared). Tables 6 – 10 report the results of the ICCs at the school level and class level and 95% confidence intervals for the unconditional model, demographic covariates model, pretest covariate model, and demographic and pretest covariates model for Grades 1 - 5, respectively. Pretest used the measures at the end of prior year (lower grade). In addition, the proportions of variance explained by these covariates at level 1 ( 2
1
R ), at level 2 ( 2 2
R ), and at level 3 ( 2 3
R ), are also reported. The essential parameters for power analysis are the unconditional ICCs ( 2 for level 2 and 3 for level 3), 2
1 R , 2
2
R , and 2 3
R . The ICCs in the covariates models provide
information about the proportions of variance at level 2 and level 3 after the covariates have been adjusted.
[Tables 6 – 10 about here]
In general, the ICCs at the class level are much bigger than the ICCs at school level, and usually
2 < 0.10 and 3 > 0.10. Regarding the proportions of variances explained by the covariates,
demographic covariates usually have smaller contribution in explaining variances than pretest. However, demographic covariates can explain a large amount of variance at school level.
Conclusions: This study provides reference values for power analysis in planning 3-level cluster
SREE Spring 2015 Conference Abstract Template A-1
Appendices
Not included in page count.
Appendix A. References
References are to be in APA version 6 format.
Bradshaw, C. P., Mitchell, M. M., & Leaf, P. J. (2010). Examining the effects of schoolwide positive behavioral interventions and supports on student outcomes results from a
randomized controlled effectiveness trial in elementary schools. Journal of Positive Behavior Interventions, 12(3), 133-148.
Bradshaw, C. P., Pas, E. T., Goldweber, A., Rosenberg, M. S., & Leaf, P. J. (2012). Integrating school-wide positive behavioral interventions and supports with tier 2 coaching to student support teams: The PBIS plus model. Advances in School Mental Health Promotion, 5(3),
177-193.
Bradshaw, C. P., Waasdorp, T. E., & Leaf, P. J. (2012). Effects of school-wide positive
behavioral interventions and supports on child behavior problems. Pediatrics, 130(5),
e1136-e1145.
Hedges, L. V., & Hedberg, E. (2007). Interclass correlation values for planning
group-randomized trials in education. Educational Evaluation and Policy Analysis, 29(1): 60–87.
Hedges, L. V., Hedberg, E. C. and Kuyper, A. M. (2012). The variance of intraclass correlations in three- and four-level models. Educational and Psychological Measurement, 72 (6), 893-909. DOI: 10.1177/0013164412445193
Hedges, L. V., & Hedberg, E. (2014). Intraclass Correlations and Covariate Outcome Correlations for Planning Two- and Three-Level Cluster-Randomized Experiments in Education. Evaluation Review, 37(6), 445-489.
Hill, C. J., Bloom, H. S., Black, A. R., & Lipsey, M. W. (2008). Empirical Benchmarks for Interpreting Effect Sizes in Research. Child Development Perspectives, 2 (3), 172–177.
Lipsey, M.W., Puzio, K., Yun, C., Hebert, M.A., Steinka-Fry, K., Cole, M.W., Roberts, M., Anthony, K.S., Busick, M.D. (2012). Translating the Statistical Representation of the Effects of Education Interventions into More Readily Interpretable Forms. (NCSER 2013-3000).
Washington, DC: National Center for Special Education Research, Institute of Education Sciences, U.S. Department of Education. This report is available on the IES website at
http://ies.ed.gov/ncser/.
Kelcey, B., & Phelps, G. (2014). Strategies for Improving Power in School Randomized Studies of Professional Development. Evaluation Review, 37(6), 520-554.
Koth, C.W., Bradshaw, C. P., & Leaf, P. J. (2009). Teacher observation of classroom
adaptation-checklist: Development and factor structure. Measurement and Evaluation in Counseling and Development, 42, 15-30.
Murray, D.W., Rabiner, D., & Carrig, M. (Mar 2014). Grade level effects of the Incredible Years Teacher Training Program on emotion regulation and attention. Paper presented at the 2014
meeting of the Society for Research on Educational Effectiveness (SREE). Washington, D.C.
SREE Spring 2015 Conference Abstract Template A-2 Adults: Research Advances and Promising Interventions. Washington, DC: The National Academies Press.
Reinke, W. M., Herman, K. C., & Dong, N. (March, 2014). A group randomized evaluation of the Incredible Years Teacher Training program. March, 2014. Paper presented as part of symposium entitled, What can we learn through replication? The role of individual-level risk factors and implementation supports in the impact of social-emotional learning programs on student outcomes, at the Annual Meeting of Society for Research on Educational
Effectiveness. Washington, DC.
Westine, C. D., Spybrook, J. & Taylor, J. A. (2014). An Empirical Investigation of Variance Design Parameters for Planning Cluster-Randomized Trials of Science Achievement.
SREE Spring 2015 Conference Abstract Template
Appendix B. Tables and Figures
Not included in page count.
Table 1: Annual gains (adjacent years)
Outcome
Effect size
95% CI Lower Bound
95% CI Upper Bound
Effect size
95% CI Lower Bound
95% CI Upper Bound
Effect size
95% CI Lower Bound
95% CI Upper Bound
Effect size
95% CI Lower Bound
95% CI Upper Bound
Effect size
95% CI Lower Bound
95% CI Upper Bound
TOCA - concentration problems mean 0.22 0.16 0.28 -0.12 -0.18 -0.06 0.12 0.06 0.18 0.04 -0.02 0.10 -0.05 -0.11 0.00
TOCA - disruptive behavior mean 0.02 -0.03 0.08 -0.07 -0.13 -0.01 0.12 0.06 0.18 -0.02 -0.08 0.04 -0.09 -0.14 -0.03
TOCA - prosocial behavior mean -0.08 -0.14 -0.02 0.09 0.03 0.15 0.07 0.01 0.13 -0.08 -0.13 -0.02 0.01 -0.05 0.07
TOCA - emotion regulation mean 0.03 -0.03 0.09 -0.06 -0.12 0.01 0.11 0.05 0.17 0.02 -0.04 0.08 -0.06 -0.12 -0.01
TOCA - internalization mean -0.01 -0.07 0.05 -0.01 -0.07 0.05 0.10 0.04 0.16 0.03 -0.03 0.09 -0.01 -0.07 0.04
TOCA - family problems mean 0.09 0.03 0.15 -0.02 -0.08 0.04 0.03 -0.03 0.09 0.03 -0.02 0.09 -0.03 -0.09 0.03
TOCA - family involvement mean -0.23 -0.29 -0.18 0.11 0.05 0.17 -0.05 -0.11 0.01 -0.09 -0.15 -0.03 -0.09 -0.14 -0.03
SREE Spring 2015 Conference Abstract Template Table 2: White-Black gaps
Outcome
Effect size
95% CI Lower Bound
95% CI Upper Bound
Effect size
95% CI Lower Bound
95% CI Upper Bound
Effect size
95% CI Lower Bound
95% CI Upper Bound
Effect size
95% CI Lower Bound
95% CI Upper Bound
Effect size
95% CI Lower Bound
95% CI Upper Bound
Effect size
95% CI Lower Bound
95% CI Upper Bound TOCA - concentration problems mean -0.23 -0.30 -0.17 -0.17 -0.23 -0.10 -0.17 -0.23 -0.10 -0.25 -0.31 -0.18 -0.18 -0.24 -0.12 -0.38 -0.44 -0.31 TOCA - disruptive behavior mean -0.32 -0.39 -0.26 -0.35 -0.41 -0.28 -0.30 -0.37 -0.24 -0.39 -0.45 -0.32 -0.34 -0.41 -0.28 -0.47 -0.54 -0.41 TOCA - prosocial behavior mean 0.10 0.04 0.17 0.08 0.02 0.15 0.11 0.05 0.18 0.15 0.08 0.21 0.24 0.18 0.30 0.35 0.28 0.41 TOCA - emotion regulation mean -0.22 -0.28 -0.15 -0.23 -0.29 -0.16 -0.16 -0.23 -0.10 -0.18 -0.24 -0.12 -0.19 -0.26 -0.13 -0.27 -0.33 -0.20 TOCA - internalization mean -0.10 -0.16 -0.04 -0.05 -0.11 0.02 0.09 0.03 0.16 0.02 -0.05 0.08 0.09 0.03 0.15 0.06 0.00 0.13 TOCA - family problems mean -0.06 -0.12 0.01 -0.02 -0.09 0.04 0.02 -0.04 0.09 -0.01 -0.08 0.05 0.04 -0.03 0.10 -0.09 -0.15 -0.03 TOCA - family involvement mean 0.27 0.21 0.33 0.35 0.29 0.42 0.25 0.19 0.32 0.31 0.24 0.37 0.32 0.25 0.38 0.42 0.36 0.48 COMP - prosocial behavior mean 0.40 0.21 0.59 0.37 0.13 0.62 0.28 0.05 0.50
COMP - emotion regulation mean 0.19 0.00 0.38 0.28 0.04 0.53 0.25 0.03 0.48 COMP - academic competence mean 0.47 0.28 0.67 0.53 0.29 0.78 0.58 0.35 0.81 COMP - total scale mean 0.44 0.25 0.64 0.51 0.26 0.75 0.44 0.21 0.66
Grade 3 Grade 4
SREE Spring 2015 Conference Abstract Template Table 3: White-Hispanic gaps
Outcome
Effect size
95% CI Lower Bound
95% CI Upper Bound
Effect size
95% CI Lower Bound
95% CI Upper Bound
Effect size
95% CI Lower Bound
95% CI Upper Bound
Effect size
95% CI Lower Bound
95% CI Upper Bound
Effect size
95% CI Lower Bound
95% CI Upper Bound
Effect size
95% CI Lower Bound
95% CI Upper Bound TOCA - concentration problems mean 0.10 -0.01 0.21 -0.03 -0.14 0.07 0.04 -0.07 0.16 -0.08 -0.20 0.03 0.02 -0.09 0.13 -0.07 -0.18 0.04 TOCA - disruptive behavior mean 0.14 0.03 0.25 0.06 -0.04 0.17 0.08 -0.04 0.19 -0.01 -0.12 0.11 0.04 -0.08 0.15 0.07 -0.04 0.18 TOCA - prosocial behavior mean -0.01 -0.12 0.09 0.07 -0.04 0.18 0.04 -0.07 0.16 0.03 -0.08 0.15 -0.03 -0.15 0.08 0.05 -0.06 0.16 TOCA - emotion regulation mean 0.27 0.16 0.38 0.14 0.03 0.25 0.19 0.08 0.30 0.11 0.00 0.23 0.19 0.08 0.30 0.19 0.08 0.31 TOCA - internalization mean 0.04 -0.07 0.15 0.05 -0.05 0.16 0.12 0.01 0.23 0.02 -0.09 0.14 0.16 0.04 0.27 0.30 0.19 0.42 TOCA - family problems mean 0.13 0.02 0.24 0.05 -0.06 0.16 -0.04 -0.15 0.07 0.03 -0.09 0.14 0.10 -0.01 0.21 0.07 -0.04 0.18 TOCA - family involvement mean 0.23 0.12 0.34 0.35 0.24 0.45 0.33 0.22 0.45 0.42 0.30 0.53 0.35 0.24 0.46 0.33 0.22 0.45 COMP - prosocial behavior mean -0.24 -0.54 0.06 0.68 0.29 1.06 -0.05 -0.44 0.35
COMP - emotion regulation mean -0.37 -0.67 -0.07 0.45 0.07 0.83 -0.13 -0.52 0.27 COMP - academic competence mean 0.18 -0.12 0.48 0.89 0.50 1.29 0.61 0.21 1.01 COMP - total scale mean -0.08 -0.37 0.22 0.85 0.45 1.24 0.20 -0.20 0.59
Grade 3 Grade 4 Grade 5
SREE Spring 2015 Conference Abstract Template Table 4: Female-male gaps
Outcome
Effect size
95% CI Lower Bound
95% CI Upper Bound
Effect size
95% CI Lower Bound
95% CI Upper Bound
Effect size
95% CI Lower Bound
95% CI Upper Bound
Effect size
95% CI Lower Bound
95% CI Upper Bound
Effect size
95% CI Lower Bound
95% CI Upper Bound
Effect size
95% CI Lower Bound
95% CI Upper Bound TOCA - concentration problems mean -0.47 -0.53 -0.41 -0.53 -0.59 -0.47 -0.56 -0.62 -0.50 -0.54 -0.60 -0.48 -0.59 -0.65 -0.54 -0.54 -0.60 -0.48 TOCA - disruptive behavior mean -0.31 -0.37 -0.26 -0.35 -0.40 -0.29 -0.38 -0.44 -0.32 -0.34 -0.40 -0.28 -0.42 -0.48 -0.37 -0.40 -0.46 -0.35
TOCA - prosocial behavior mean 0.26 0.20 0.32 0.29 0.24 0.35 0.27 0.21 0.33 0.31 0.25 0.36 0.36 0.30 0.42 0.33 0.27 0.39
TOCA - emotion regulation mean -0.38 -0.44 -0.32 -0.42 -0.47 -0.36 -0.41 -0.47 -0.35 -0.42 -0.48 -0.36 -0.48 -0.53 -0.42 -0.40 -0.46 -0.34 TOCA - internalization mean -0.10 -0.16 -0.05 -0.13 -0.19 -0.08 -0.10 -0.16 -0.04 -0.09 -0.15 -0.03 -0.12 -0.18 -0.06 -0.09 -0.15 -0.04 TOCA - family problems mean -0.11 -0.16 -0.05 -0.10 -0.16 -0.05 -0.10 -0.16 -0.04 -0.13 -0.18 -0.07 -0.09 -0.15 -0.03 -0.08 -0.14 -0.02
TOCA - family involvement mean 0.03 -0.03 0.08 0.08 0.02 0.14 0.08 0.03 0.14 0.03 -0.03 0.09 0.10 0.04 0.16 0.03 -0.03 0.08
COMP - prosocial behavior mean 0.42 0.24 0.60 0.51 0.30 0.73 0.43 0.22 0.64
COMP - emotion regulation mean 0.44 0.26 0.62 0.43 0.22 0.65 0.43 0.23 0.64
COMP - academic competence mean 0.41 0.24 0.59 0.34 0.13 0.55 0.22 0.01 0.42
COMP - total scale mean 0.47 0.30 0.65 0.48 0.26 0.69 0.41 0.20 0.62
Grade 3 Grade 4 Grade 5
SREE Spring 2015 Conference Abstract Template
Table 5: Eligible-ineligible free or reduced-price lunch gaps
Outcome
Effect size
95% CI Lower Bound
95% CI Upper Bound
Effect size
95% CI Lower Bound
95% CI Upper Bound
Effect size
95% CI Lower Bound
95% CI Upper Bound
Effect size
95% CI Lower Bound
95% CI Upper Bound
Effect size
95% CI Lower Bound
95% CI Upper Bound
Effect size
95% CI Lower Bound
95% CI Upper Bound TOCA - concentration problems mean 0.29 0.22 0.35 0.28 0.22 0.35 0.27 0.21 0.34 0.38 0.32 0.45 0.29 0.23 0.36 0.35 0.29 0.42 TOCA - disruptive behavior mean 0.23 0.17 0.29 0.27 0.21 0.33 0.25 0.18 0.31 0.32 0.25 0.38 0.29 0.23 0.36 0.30 0.24 0.37 TOCA - prosocial behavior mean -0.19 -0.26 -0.13 -0.10 -0.17 -0.04 -0.02 -0.09 0.04 -0.24 -0.30 -0.17 -0.13 -0.20 -0.07 -0.21 -0.28 -0.15 TOCA - emotion regulation mean 0.17 0.11 0.24 0.22 0.15 0.28 0.16 0.10 0.23 0.24 0.18 0.31 0.30 0.24 0.37 0.25 0.18 0.31 TOCA - internalization mean 0.20 0.13 0.26 0.15 0.09 0.21 0.08 0.01 0.14 0.18 0.12 0.25 0.19 0.12 0.25 0.07 0.00 0.13 TOCA - family problems mean 0.37 0.31 0.43 0.31 0.25 0.38 0.26 0.19 0.32 0.27 0.21 0.34 0.39 0.32 0.45 0.35 0.29 0.42 TOCA - family involvement mean -0.54 -0.61 -0.48 -0.59 -0.66 -0.53 -0.55 -0.61 -0.48 -0.63 -0.70 -0.57 -0.53 -0.60 -0.47 -0.49 -0.56 -0.43 COMP - prosocial behavior mean -0.32 -0.51 -0.13 -0.31 -0.53 -0.09 -0.15 -0.36 0.06
COMP - emotion regulation mean -0.16 -0.35 0.02 -0.37 -0.59 -0.15 -0.04 -0.25 0.17 COMP - academic competence mean -0.50 -0.69 -0.31 -0.37 -0.58 -0.15 -0.39 -0.60 -0.18 COMP - total scale mean -0.41 -0.60 -0.22 -0.43 -0.65 -0.21 -0.27 -0.48 -0.06
Grade 3 Grade 4 Grade 5
SREE Spring 2015 Conference Abstract Template Table 6: ICC and R-squared at Grade 1
Outcome Level ICC
95% CI Lower Bound
95% CI Upper
Bound ICC
95% CI Lower Bound
95% CI Upper Bound
R-squared ICC
95% CI Lower Bound
95% CI Upper Bound
R-squared ICC
95% CI Lower Bound
95% CI Upper Bound
R-squared
Level 3-School 0.02 -0.01 0.05 0.01 -0.01 0.04 0.33 0.02 -0.02 0.05 0.41 0.02 -0.02 0.05 0.45
Level 2-Teacher 0.10 0.07 0.14 0.11 0.07 0.15 0.02 0.16 0.11 0.21 0.04 0.16 0.11 0.21 0.04
Level 1-Student 0.09 0.40 0.42
Level 3-School 0.10 0.04 0.15 0.08 0.02 0.13 0.28 0.05 0.00 0.11 0.62 0.06 0.00 0.11 0.61
Level 2-Teacher 0.16 0.11 0.21 0.17 0.12 0.22 0.03 0.24 0.18 0.30 -0.03 0.24 0.18 0.30 0.00
Level 1-Student 0.08 0.34 0.37
Level 3-School 0.02 -0.01 0.06 0.02 -0.02 0.05 0.19 0.02 -0.01 0.06 -0.14 0.02 -0.02 0.06 -0.08
Level 2-Teacher 0.16 0.12 0.21 0.17 0.12 0.22 0.00 0.16 0.12 0.21 0.04 0.17 0.12 0.22 0.03
Level 1-Student 0.04 0.04 0.07
Level 3-School 0.08 0.03 0.13 0.07 0.02 0.13 0.18 0.05 0.00 0.10 0.54 0.05 0.00 0.11 0.54
Level 2-Teacher 0.19 0.14 0.24 0.20 0.15 0.25 0.03 0.24 0.18 0.30 0.04 0.24 0.18 0.30 0.07
Level 1-Student 0.09 0.28 0.31
Level 3-School 0.12 0.04 0.20 0.12 0.04 0.20 0.02 0.09 0.01 0.16 0.36 0.09 0.01 0.16 0.36
Level 2-Teacher 0.30 0.24 0.37 0.30 0.24 0.37 0.01 0.30 0.24 0.37 0.10 0.30 0.23 0.37 0.11
Level 1-Student 0.01 0.04 0.05
Level 3-School 0.03 0.00 0.06 0.02 -0.01 0.04 0.53 0.01 -0.01 0.04 0.57 0.01 -0.02 0.04 0.69
Level 2-Teacher 0.11 0.07 0.14 0.11 0.07 0.15 -0.01 0.11 0.07 0.15 0.00 0.12 0.08 0.16 0.00
Level 1-Student 0.04 0.05 0.07
Level 3-School 0.04 -0.01 0.10 0.02 -0.03 0.08 0.53 0.03 -0.03 0.08 0.46 0.03 -0.03 0.08 0.53
Level 2-Teacher 0.28 0.22 0.35 0.31 0.24 0.38 0.01 0.32 0.25 0.39 0.06 0.33 0.26 0.40 0.07
Level 1-Student 0.11 0.19 0.23
Pretest covariate model
TOCA - emotion regulation mean
TOCA -
internalization mean
TOCA - family problems mean
TOCA - family involvement mean
Pretest and demographic
TOCA - concentration problems mean
TOCA - disruptive behavior mean
TOCA - prosocial behavior mean
SREE Spring 2015 Conference Abstract Template Table 7: ICC and R-squared at Grade 2
Outcome Level ICC
95% CI Lower Bound
95% CI Upper
Bound ICC
95% CI Lower Bound
95% CI Upper Bound
R-squared ICC
95% CI Lower Bound
95% CI Upper Bound
R-squared ICC
95% CI Lower Bound
95% CI Upper Bound
R-squared
Level 3-School 0.00 0.00 0.00 0.00
Level 2-Teacher 0.14 0.15 0.04 0.20 0.09 0.20 0.10
Level 1-Student 0.12 0.39 0.42
Level 3-School 0.05 0.00 0.11 0.03 -0.02 0.08 0.49 0.04 -0.03 0.10 0.48 0.04 -0.03 0.10 0.54
Level 2-Teacher 0.20 0.14 0.25 0.21 0.16 0.27 0.01 0.28 0.21 0.35 -0.02 0.28 0.21 0.35 -0.01
Level 1-Student 0.08 0.35 0.37
Level 3-School 0.03 -0.02 0.07 0.02 -0.02 0.06 0.31 0.01 -0.03 0.05 0.65 0.01 -0.03 0.05 0.60
Level 2-Teacher 0.20 0.15 0.26 0.21 0.15 0.26 0.03 0.22 0.16 0.28 -0.02 0.22 0.16 0.28 0.02
Level 1-Student 0.05 0.07 0.10
Level 3-School 0.02 -0.03 0.06 0.00 -0.04 0.05 0.83 0.02 -0.04 0.08 -0.18 0.02 -0.04 0.08 0.08
Level 2-Teacher 0.23 0.17 0.29 0.25 0.19 0.31 0.00 0.28 0.22 0.35 0.07 0.29 0.22 0.36 0.07
Level 1-Student 0.08 0.31 0.33
Level 3-School 0.03 -0.04 0.10 0.02 -0.05 0.09 0.14 0.00 1.00 0.00 1.00
Level 2-Teacher 0.42 0.34 0.50 0.42 0.34 0.51 0.00 0.44 0.01 0.45 0.01
Level 1-Student 0.01 0.06 0.06
Level 3-School 0.00 0.00 0.00 0.00
Level 2-Teacher 0.16 0.16 0.02 0.16 0.04 0.17 0.04
Level 1-Student 0.04 0.06 0.08
Level 3-School 0.04 -0.01 0.09 0.02 -0.02 0.07 0.47 0.00 -0.04 0.05 0.91 0.02 -0.03 0.06 0.69
Level 2-Teacher 0.22 0.17 0.28 0.25 0.19 0.31 -0.01 0.27 0.21 0.33 0.06 0.27 0.21 0.34 0.06
Level 1-Student 0.09 0.22 0.25
Demographic covariates model
TOCA -
internalization mean
TOCA - family problems mean
TOCA - family involvement mean
Pretest covariate model Pretest and demographic
TOCA - concentration problems mean
TOCA - disruptive behavior mean
TOCA - prosocial behavior mean
TOCA - emotion regulation mean
SREE Spring 2015 Conference Abstract Template Table 8: ICC and R-squared at Grade 3
Outcome Level ICC
95% CI Lower Bound
95% CI Upper
Bound ICC
95% CI Lower Bound
95% CI Upper Bound
R-squared ICC
95% CI Lower Bound
95% CI Upper Bound
R-squared ICC
95% CI Lower Bound
95% CI Upper Bound
R-squared
Level 3-School 0.05 0.02 0.09 0.05 0.01 0.09 0.18 0.07 0.02 0.11 0.20 0.06 0.02 0.11 0.22
Level 2-Teacher 0.07 0.04 0.10 0.08 0.05 0.11 -0.03 0.12 0.08 0.17 -0.18 0.13 0.09 0.17 -0.20
Level 1-Student 0.10 0.38 0.39
Level 3-School 0.06 0.01 0.11 0.04 -0.01 0.08 0.44 0.02 -0.03 0.08 0.72 0.03 -0.03 0.08 0.71
Level 2-Teacher 0.17 0.12 0.22 0.19 0.14 0.24 0.02 0.27 0.20 0.33 -0.08 0.27 0.20 0.33 -0.07
Level 1-Student 0.07 0.34 0.36
Level 3-School 0.04 0.00 0.08 0.03 -0.01 0.07 0.27 0.04 -0.01 0.08 0.05 0.04 -0.01 0.08 0.15
Level 2-Teacher 0.18 0.13 0.23 0.18 0.13 0.23 0.00 0.18 0.13 0.23 0.05 0.18 0.13 0.23 0.04
Level 1-Student 0.04 0.06 0.09
Level 3-School 0.07 0.02 0.12 0.06 0.01 0.11 0.18 0.04 -0.02 0.10 0.52 0.04 -0.02 0.10 0.52
Level 2-Teacher 0.18 0.13 0.23 0.20 0.14 0.25 0.00 0.26 0.19 0.32 -0.05 0.26 0.20 0.33 -0.05
Level 1-Student 0.08 0.29 0.31
Level 3-School 0.06 -0.01 0.12 0.05 -0.01 0.12 0.05 0.04 -0.03 0.10 0.37 0.04 -0.03 0.10 0.38
Level 2-Teacher 0.33 0.26 0.41 0.34 0.26 0.41 -0.01 0.36 0.28 0.44 -0.03 0.36 0.29 0.44 -0.03
Level 1-Student 0.01 0.07 0.08
Level 3-School 0.01 -0.01 0.04 0.00 -0.02 0.03 0.88 0.00 -0.02 0.03 0.94 0.00 1.00
Level 2-Teacher 0.11 0.07 0.15 0.12 0.08 0.16 -0.04 0.12 0.08 0.16 -0.04 0.13 -0.05
Level 1-Student 0.03 0.06 0.08
Level 3-School 0.03 -0.01 0.08 0.03 -0.02 0.07 0.31 0.01 -0.03 0.05 0.73 0.02 -0.03 0.06 0.62
Level 2-Teacher 0.19 0.14 0.24 0.21 0.15 0.26 0.00 0.21 0.15 0.26 0.12 0.22 0.16 0.28 0.07
Level 1-Student 0.09 0.18 0.22
Unconditional Model Demographic covariates model Pretest covariate model Pretest and demographic
TOCA - concentration problems mean
TOCA - disruptive behavior mean
TOCA - prosocial behavior mean
TOCA - emotion regulation mean
TOCA -
internalization mean
TOCA - family problems mean
SREE Spring 2015 Conference Abstract Template Table 9: ICC and R-squared at Grade 4
Outcome Level ICC
95% CI Lower Bound
95% CI Upper
Bound ICC
95% CI Lower Bound
95% CI Upper Bound
R-squared ICC
95% CI Lower Bound
95% CI Upper Bound
R-squared ICC
95% CI Lower Bound
95% CI Upper Bound
R-squared
Level 3-School 0.03 -0.01 0.07 0.02 -0.01 0.06 0.34 0.00 1.00 0.00 1.00
Level 2-Teacher 0.13 0.09 0.17 0.15 0.10 0.19 0.04 0.18 0.14 0.19 0.12
Level 1-Student 0.13 0.37 0.40
Level 3-School 0.07 0.03 0.12 0.05 0.01 0.10 0.35 0.02 -0.02 0.06 0.80 0.02 -0.02 0.06 0.82
Level 2-Teacher 0.13 0.09 0.17 0.14 0.10 0.18 0.04 0.20 0.15 0.26 -0.06 0.20 0.15 0.26 -0.04
Level 1-Student 0.08 0.33 0.35
Level 3-School 0.05 0.01 0.09 0.04 0.00 0.07 0.27 0.03 -0.01 0.06 0.49 0.02 -0.01 0.06 0.55
Level 2-Teacher 0.15 0.11 0.20 0.16 0.12 0.21 -0.01 0.18 0.13 0.22 -0.04 0.18 0.13 0.23 -0.05
Level 1-Student 0.05 0.09 0.12
Level 3-School 0.10 0.04 0.16 0.09 0.03 0.15 0.22 0.03 -0.02 0.08 0.77 0.03 -0.02 0.08 0.80
Level 2-Teacher 0.14 0.10 0.19 0.15 0.11 0.20 0.02 0.19 0.14 0.25 0.04 0.20 0.15 0.26 0.05
Level 1-Student 0.09 0.29 0.32
Level 3-School 0.06 -0.01 0.12 0.05 -0.01 0.12 0.10 0.03 -0.03 0.09 0.50 0.03 -0.03 0.09 0.53
Level 2-Teacher 0.31 0.24 0.38 0.31 0.24 0.38 0.01 0.33 0.25 0.40 0.03 0.33 0.25 0.40 0.04
Level 1-Student 0.01 0.07 0.08
Level 3-School 0.07 0.03 0.11 0.05 0.01 0.10 0.25 0.05 0.01 0.09 0.37 0.04 0.00 0.08 0.47
Level 2-Teacher 0.10 0.06 0.13 0.11 0.07 0.15 -0.09 0.10 0.07 0.14 0.01 0.11 0.08 0.15 -0.07
Level 1-Student 0.04 0.07 0.09
Level 3-School 0.00 -0.04 0.04 0.00 1.00 0.00 1.00 0.00 1.00
Level 2-Teacher 0.25 0.19 0.31 0.26 0.06 0.27 0.12 0.28 0.12
Level 1-Student 0.09 0.22 0.25
Unconditional Model Demographic covariates model Pretest covariate model Pretest and demographic
TOCA - concentration problems mean
TOCA - disruptive behavior mean
TOCA - prosocial behavior mean
TOCA - emotion regulation mean
TOCA -
internalization mean
TOCA - family problems mean
SREE Spring 2015 Conference Abstract Template Table 10: ICC and R-squared at Grade 5
Outcome Level ICC
95% CI Lower Bound
95% CI Upper
Bound ICC
95% CI Lower Bound
95% CI Upper Bound
R-squared ICC
95% CI Lower Bound
95% CI Upper Bound
R-squared ICC
95% CI Lower Bound
95% CI Upper Bound
R-squared
Level 3-School 0.04 0.00 0.07 0.02 -0.01 0.06 0.43 0.04 0.00 0.09 0.17 0.04 -0.01 0.08 0.33
Level 2-Teacher 0.12 0.08 0.16 0.13 0.09 0.17 0.04 0.17 0.12 0.22 0.05 0.18 0.13 0.23 0.05
Level 1-Student 0.10 0.38 0.39
Level 3-School 0.07 0.02 0.12 0.03 -0.01 0.08 0.57 0.04 -0.01 0.09 0.63 0.03 -0.02 0.08 0.72
Level 2-Teacher 0.15 0.11 0.19 0.17 0.12 0.21 -0.01 0.22 0.16 0.28 -0.01 0.23 0.17 0.28 -0.01
Level 1-Student 0.07 0.35 0.36
Level 3-School 0.03 -0.01 0.06 0.02 -0.02 0.06 0.20 0.03 -0.01 0.07 -0.03 0.02 -0.02 0.06 0.21
Level 2-Teacher 0.14 0.09 0.18 0.14 0.10 0.19 -0.01 0.15 0.10 0.19 -0.03 0.15 0.11 0.20 -0.03
Level 1-Student 0.05 0.08 0.10
Level 3-School 0.03 -0.01 0.08 0.02 -0.03 0.06 0.55 0.02 -0.03 0.08 0.48 0.02 -0.04 0.07 0.65
Level 2-Teacher 0.20 0.15 0.26 0.22 0.16 0.28 -0.02 0.26 0.20 0.33 0.04 0.27 0.21 0.34 0.03
Level 1-Student 0.07 0.32 0.33
Level 3-School 0.04 -0.03 0.10 0.03 -0.03 0.10 0.10 0.02 -0.04 0.09 0.40 0.02 -0.04 0.09 0.48
Level 2-Teacher 0.32 0.24 0.39 0.32 0.25 0.39 0.01 0.34 0.27 0.42 0.01 0.34 0.27 0.42 0.02
Level 1-Student 0.01 0.11 0.11
Level 3-School 0.01 -0.02 0.04 0.00 -0.02 0.03 0.69 0.00 1.00 0.00 1.00
Level 2-Teacher 0.13 0.09 0.17 0.13 0.09 0.17 0.02 0.13 0.06 0.13 0.09
Level 1-Student 0.02 0.06 0.07
Level 3-School 0.06 0.01 0.12 0.06 0.00 0.11 0.14 0.06 0.01 0.12 0.15 0.06 0.00 0.12 0.24
Level 2-Teacher 0.21 0.16 0.27 0.21 0.15 0.27 0.09 0.21 0.15 0.27 0.19 0.21 0.15 0.27 0.22
Level 1-Student 0.07 0.18 0.20
Unconditional Model Demographic covariates model Pretest covariate model Pretest and demographic
TOCA - concentration problems mean
TOCA - disruptive behavior mean
TOCA - prosocial behavior mean
TOCA - emotion regulation mean
TOCA -
internalization mean
TOCA - family problems mean