SCHOOL READINESS:
DOES IT MATTER IF PARENTS AND CAREGIVERS THINK ALIKE?
Dari Jigjidsuren
A dissertation submitted to the faculty of the University of North Carolina at Chapel Hill in partial fulfillment of the requirements for the degree of Doctor of Philosophy in the
School of Social Work.
Chapel Hill 2013
Approved by:
Kathleen A. Rounds, Ph.D.
Richard M. Clifford, Ph.D.
Iheoma U. Iruka, Ph.D.
Michael C. Lambert, Ph.D.
iii
ABSTRACT
DARI JIGJIDSUREN: School readiness: Does it matter if parents and caregivers think alike?
(Under the direction of Kathleen Rounds and Dick Clifford)
Growing market competition and increasingly high standards for the global
workforce have placed a greater emphasis on school readiness, a complex construct that
has yet to be understood and achieved. This dissertation study strives to contribute to the
body of readiness research by offering new insights into factors associated with
improving child outcomes. The study uses the data from the Early Childhood
Longitudinal Study, Birth Cohort (ECLS-B) to examine parents’ and caregivers’ views of
school readiness and their relationship to children’s cognitive outcomes in preschool and
kindergarten. Multiple regression analyses were used to investigate the associations
between parents’ and caregivers’ views and child outcomes, and the moderating effects
of race/ethnicity and SES on child outcomes. Also, the study measured congruence of
school readiness views between parents and caregivers using advanced statistical
methodologies such as absolute congruence index, weighted and unweighted kappa
statistic (Kw), agreement indices (rWG), and average deviation indices (AD).
This dissertation study advances the existing research on school readiness in
several ways. This study is the first of its kind to measure congruence of school readiness
iv
individually paired parents and caregivers. Next, the study validated and revised the
school readiness measure, initially used in the 1993 National Household Education
Survey and subsequently used for the ECLS-B. Third, the study offers insights into the
complexity of the meaning of school readiness for practitioners working in diverse
cultural contexts. The findings from this study support the notion that parents and
caregivers play a critical role in children’s early development and reveal the associations
between the views of parents and caregivers and children’s test scores in math and
reading. However, given the magnitude of findings and their conflicting nature, the
question about the associations between congruence of views and child outcomes remains
inconclusive. The study demonstrates the need for more refined instruments to more
accurately measure school readiness, and suggests that future research focus on cultural
v
To the memory of my parents, Naidan Jigjidsuren and Erkhembayar Mishgee,
who instilled in me a love of learning. So much of who I am today is because of you.
vi
ACKNOWLEDGEMENTS
First and foremost, I am most grateful to the members of my committee who were
more than generous with their expertise and precious time. Dr. Kathleen Rounds, my
committee chair and advisor, has been an unfailing source of guidance, encouragement,
support, and patience throughout my graduate studies at UNC-Chapel Hill. For
everything you’ve done for me, Kathleen, thank you. Dr. Dick Clifford has spent
countless hours reading, encouraging, listening, and providing helpful insights and
suggestions. Dick, I can never thank you enough for all of the time you devoted to me.
Dr. Iheoma Iruka, Dr. Michael Lambert, and Dr. Joelle Powers have provided precious
feedback and constant encouragement over the past two years. Valuable statistical advice
from Iheoma and Michael inspired me to conduct a more thorough analysis for this
dissertation study.
I would like to thank my colleagues at the ECTA Center of the FPG Child
Development Institute for their profound understanding and unwavering support over the
years. I have been truly fortunate to be a part of such an amazing community of early
childhood professionals. My deepest gratitude goes to two very special people at FPG:
my supervisor, Betsy Ayankoya, and Shelley deFosset, my friend and colleague, without
whom I could not have made it this far. Thank you for believing in me, assisting me, and
giving me the confidence to continue on this doctoral journey.
I would like to acknowledge the UNC School of Social Work Doctoral Program
vii
equipment, software, and a venue to carry out the analysis of restricted data. I also offer
my gratitude to Dr. Sheryl Zimmerman at the School of Social Work for her valuable
support in the final stretch of completing this dissertation. I am also thankful Ms. Jennie
Vaughn for her assistance with editing.
Finally, and most importantly, I would like to thank my lovely children—Elana,
Chingun and Bryson— and my husband, Tsogt-Erdene, for their support throughout this
long journey. I am sincerely grateful for your love, encouragement, and endless patience,
tolerating my mood swings and forgiving many evenings, nights, and weekends I spent
away from you. Thanks also go out to my niece E. Khulan, my sister Ariunaa, brother
Tansag, my extended family, and, of course, to all my friends. There are no words to
convey how much I appreciate the faith you all had in me. Without the support of all of
viii
TABLE OF CONTENTS
LIST OF TABLES ... x
LIST OF FIGURES ... xii
Chapter I INTRODUCTION ... 1
II WHAT IS SCHOOL READINESS? ... 6
School Readiness Beliefs ... 9
Congruence of School Readiness Views ... 13
Significance to Social Work ... 13
III THEORETICAL AND CONCEPTUAL FRAMEWORKS ... 17
Vygotsky’s Sociocultural Theory ... 17
Conceptual Framework of the Study ... 23
IV RESEARCH METHODS ... 25
Research Questions ... 25
Study Design ... 26
Sample... 28
Data Collection ... 28
Measures ... 30
ix
V RESULTS ... 45
Preliminary Analysis ... 45
Study 1 ... 47
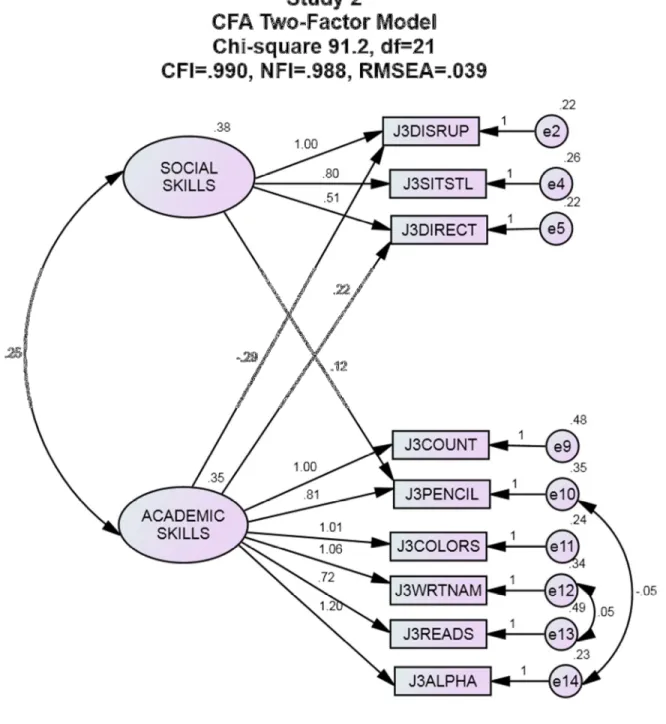
Study 2 ... 59
Study 3 ... 72
Congruence Analysis ... 77
Main Analyses ... 90
VI DISCUSSION AND CONCLUSION ... 110
Discussion ... 110
Study Limitations ... 114
Implications for Practice, Research and Policy ... 115
Conclusion ... 120
APPENDICES ... 123
x
LIST OF TABLES
Table
1. School Readiness Instrument and Suggested Corresponding
Domains of School Readiness ... 33
2. Suggested Standards for Interpreting Interrater Agreement Statistics ... 44
3. Demographic Characteristics for Final Sample (n = 4,500) ... 46
4. Initial PAF with Promax Rotation: Total Variance Explained (n = 2,250) ... 48
5. Parallel Analysis: Raw Data Eigenvalues, and Mean and Percentile Random Data Eigenvalues in PAF/Common Factor Analysis ... 50
6. Study 1: Split-Half Sample PAF Analysis with Promax Rotation: Communalities, and Matrix Characteristics for Parents’ Views ... 52
7. Summary of Goodness-of-Fit Indices for Alternate Models of the School Readiness Instrument Measuring Parents’ Views, Subsample B (n = 2,250) ... 57
8. Total Variance Explained ... 60
9. Initial PAF Analysis with Promax Rotation, Subsample B, Caregivers’ Responses (n = 2,250) ... 62
10. Parallel Analysis: Raw Data Eigenvalues, and Mean and Percentile Random Data Eigenvalues in PAF/Common Factor Analysis, Subsample B ... 63
11. PAF Analysis with 2 Factors and Promax Rotation, Subsample B (n = 2,250) ... 64
12. Study 2: Split-Half Sample PAF Analysis with Promax Rotation: Communalities, and Matrix Characteristics for Caregivers’ Views ... 66
13. Summary of Goodness-of-Fit Indices for Alternate Models of the School Readiness Instrument Measuring Caregivers’ Views, Subsample A ... 70
14. Tests for Invariance of Parents’ Views (P3) using the
xi
15. Tests for Invariance of Caregivers’ Views (J3) using the
School Readiness Instrument: Goodness-of-Fit Statistics ... 76
16. Distribution Percentage of Parent and Caregiver Responses to the
School Readiness Instrument ... 78
17. Absolute Congruence Index of Parent-Caregiver Responses
by Individual Item (n = 4,500) ... 81
18. Distribution of Parent-Caregiver Responses by Absolute Difference Score,
(n = 4,500) ... 83
19. Percentage Agreement and Kappa Statistics, Weighted and Unweighted
(n = 4,500) ... 85
20. Means, Standard Deviations, and Distributions of Interrater Agreement
Indices for Single Items (n = 4,500) ... 88
21. Means, Standard Deviations, and Distributions of Interrater Agreement
Indices for Multiple Items (n = 4,500) ... 89
22. Means and Standard Deviations by Race/Ethnicity ... 92
23. Summary of Kruskal Wallis H Test for Paired Group Comparison ... 93
24. Simple Correlations between Predictors (n = 4,500) ... 94-95
25. Predictors of Child Cognitive Outcomes at Waves 3 and 4,
Total Score versus Academic and Social Skills subscales ... 98-99
26. Summary of Hierarchical Regression Analyses for Variables Predicting Child Outcomes in Waves 3 and 4, Using the 9-item
School Readiness Instrument ... 101
27. Summary of Hierarchical Regression Analyses for Variables Predicting Child Outcomes in Waves 3 and 4, using the Academic
and Social Skills subscales ... 102
28. Hierarchical Regression Analyses Predicting the Effects of Congruence of School Readiness Views, Race/Ethnicity and SES on Child Outcomes,
using the 9-item School Readiness Instrument ... 103-104
29. Hierarchical Regression Analyses Predicting the Effects of Congruence of School Readiness Views, Race/Ethnicity and SES on Child Outcomes,
xii
LIST OF FIGURES
Figure
1. Conceptual Framework of the Congruence Model ... 24
2. Data Analysis Plan ... 35
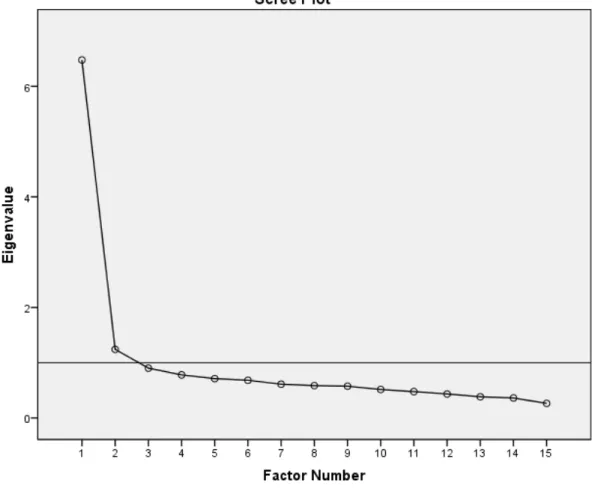
3. Study 1: Scree Plot of Factors in the Measure of Parents’ Views ... 49
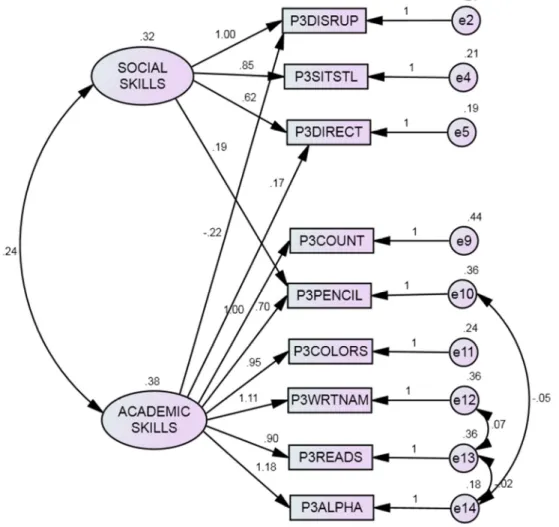
4. Study 1: Confirmatory Factor Analysis with Two-Factor Model
of Parents’ Views ... 58
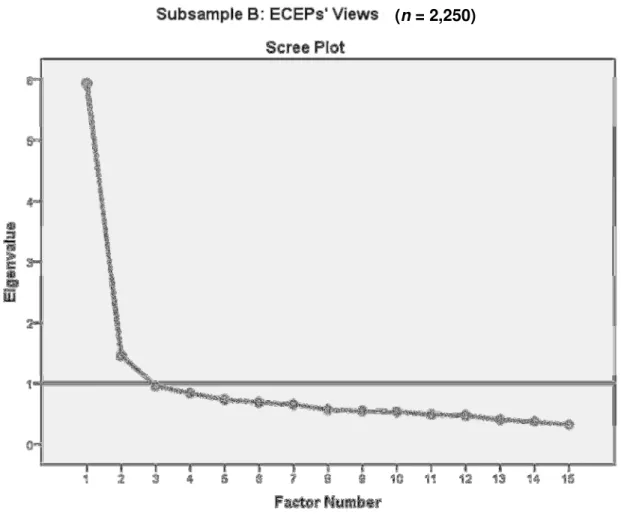
5. Scree Plot of Factors in the Measure of Caregivers’ Views(Subsample B) ... 61 6. Study 2: Confirmatory Factor Analysis with Two-Factor Model
of Caregivers’ Views ... 71
7. Distribution Frequency of Parents’ and Caregivers’ Responses
1
CHAPTER 1
INTRODUCTION
Every year, over a million American students drop out of high school, and one out of
every four high school students fails to graduate on time. In today’s increasingly complex
world of technological advances and demanding job markets, the future for these youth looks
graver than ever. High school dropouts are at increased risk for significant negative
consequences that affect every aspect of their lives. They are more likely to experience
unemployment, poor health, incarceration, and poverty, and have a shorter life span
compared to their better educated peers (Levin, 2005; Sum, Khatiwada, & McLaughlin,
2009; Tyler & Loftstrom, 2009).
Dropouts have an intergenerational effect on family members and spread negative
influences to family and friends, contributing to neighborhood poverty. Moreover, these
adverse effects extend far beyond the dropout youth, their families, peers, and communities.
Dropouts impose a heavy cost on the nation’s economy as a result of lower tax revenues,
greater public assistance expenses and higher crime rates (Belfield & Levin, 2007; Heckman
& Masterov, 2007). For every new class of students who fail to graduate from high school,
over $200 billion is lost in lifetime tax revenues and increased public expenditures; high
school dropouts constitute nearly 50% of the heads of households receiving social welfare
and more than 75% of all prison inmates (Melville, 2006). Calls to address the national crisis
of high school dropouts have received significant attention in recent years. The results of
2
decision to drop out; poor academic performance is frequently cited as one of the key reasons
for dropping out of school (Bridgeland, Dilulio, & Morison, 2006; Johnston, 2010;
Rumberger, 2001; Rumberger & Lim, 2008).
The manifestations of academic failure may go ignored until much later, the
foundation for poor school performance is often laid in early childhood (Entwisle, Alexander,
& Olson, 2005; Karoly, Kilburn, & Cannon, 2005; Knudsen, Heckman, Cameron, &
Shonkoff, 2006; Pianta, Cox, & Snow, 2007). In fact, when children first come to school,
they already vary greatly in their skills and competencies (Brooks-Gunn & Markman, 2005;
Carlton & Winsler, 1999; Laosa, 2005), with some children falling far behind their peers
(Burchinal et al., 2011; Duncan, Morris, & Rodrigues, 2011; Isaacs, 2012; Jacobson
Chernoff, Flanagan, McPhee, & Park, 2007; West, Denton, & Germino-Hausken, 2000).
Once in school, children who are not ready for school face the risks of being late in learning
to read, write, and do math, and are less proficient compared with children who enter school
with mastery of basic skills (Duncan et al., 2007; Layzer & Price, 2008). In 1993, Slavin and
colleagues wrote that “[s]uccess in the early grades does not guarantee success throughout
the school years and beyond, but failure in the early grades does virtually guarantee failure in
later schooling” (p. 10). Researchers confirm that performance in elementary school
determines children’s academic success and social performance in later years (Campbell,
Helms, Sparling, & Ramey, 1998; Fergus-Morrison, Rimm-Kaufman, & Pianta, 2003;
Reynolds, 2000). Children who enter school ill-prepared are more likely to experience
academic failure, school dropout, emotional problems, juvenile delinquency, and,
3
Schweinhart, 1998; Baydar, Brooks-Gunn, & Furstenberg, 1993; Duncan, Magnuson, Kalil,
& Ziol-Guest, 2012).
The issue of “children’s short term cognitive, social and emotional development …
[and] their long term success in school and later life” (Organization for Economic
Cooperation and Development [OECD], 2001, p. 13) has been emphasized in decades of
research. Circumstances such as parenting styles and beliefs, parents’ race/ethnicity, home
learning environment, neighborhood, and larger social environment along with individual
child characteristics are instrumental in shaping child experiences in early ages (Britto,
Brooks-Gunn, & Griffin, 2006; Burchinal, Roberts, Zeisel, Hennon, & Hooper, 2006;
Carnegie Task Force, 1994; Duncan & Murnane, 2011; Hanson et al., 2011; Martin, Ryan, &
Brooks-Gunn, 2010; Shonkoff & Phillips, 2000; Son & Morrison, 2010; Yoshikawa,
Gassman-Pines, Morris, Gennetian, & Godfrey, 2010). In particular, the devastating
influences of poverty and household socioeconomic status (SES) on children are well
documented (Duncan, Ziol-Guest & Kalil, 2010; Isaacs, 2012; Layzer & Price, 2008;
McLoyd, 1998; Reardon, 2011). Multiple national and international studies that examined the
effects of poverty and SES on early childhood outcomes found that children from low-SES
households are statistically less likely “to develop the same level of skills and intellectual
capital as children from high-SES backgrounds” (OECD, 2006, p. 34). For example, the
preschool follow-up of the Early Childhood Longitudinal Study, Birth Cohort (ECLS-B)
determined that at age 4, the average receptive vocabulary, literacy, and mathematics scores
of children in the highest 20% of SES are at least one standard deviation higher compared to
those of children in the lowest 20 percent (Jacobson Chernoff et al., 2007). In a British study,
4
points at 22 months (SE = 2.0) compared to children from high-SES families, and by age 10
the gap reached 28% (SE = 2.5) (Feinstein, 2003). The Programme for International Student
Assessment (PISA) evaluations (OECD, 2001) also reported that family poverty was
correlated with poor educational outcomes.
In all counties, children from middle class families academically perform
significantly better compared to their peers from lower-SES families—the difference is
attributed to high SES children’s “daily access to codes, language and cultural resources
valued in mainstream education” (OECD, 2006, p. 35). Economically disadvantaged children
may not have role models or may not have been exposed to opportunities to acquire skills
and competencies such as language acquisition, self-confidence, and self-regulation that
underlie successful learning (OECD, 2006). Researchers (Duncan, Brooks-Gunn, &
Klebanov, 1994; Duncan, Yeung, Brooks-Gunn, & Smith, 1998; Duncan et al., 2012; Guo,
1998; Mistry, Benner, Biesanz, & Clark, 2010) further caution that childhood poverty is most
destructive at early stages of learning because acquisition of certain skills is essential for
progressing to the next stage and poverty may seriously impede children’s early learning and
acquisition of fundamental skills.
One frequent remedy to help compensate for disadvantages experienced by children
in poverty is early childhood intervention (Barnett, 1990, 2011; Dearing, McCartney, &
Taylor, 2009; Schweinhart et al., 2005; Votruba-Drzal, Coley, Maldonaldo-Carreno,
Li-Grining, & Chase-Lansdale, 2010; Reynolds, 2000). There is ample evidence indicating that
effective early intervention programs positively impact the cognitive and social skills of
young children (Barnett et al., 1998; Burchinal & Cryer, 2003; Campbell et al., 1998; Li,
5
Longitudinal studies such as the Carolina Abecedarian Project and the High/Scope Perry
Preschool Program demonstrate long-term benefits of early childhood programs for
individuals and society (Barnett, 1996, 2000; Campbell, Pungello, Miller-Johnson,
Burchinal, & Ramey, 2001; Heckman & Masterov, 2007; Knudsen et al., 2006).
Nevertheless, parents’ responsibility for education of the youngest members of the
society cannot be dismissed. Family is the primary context for children’s early experiences,
and research affirms the central role of parents in children’s development (NICHD [National
Institute of Child Health and Human Development] Early Child Care Research Network,
2003b). Parents themselves, their attitudes, and the ways they raise their young children have
significant, long-lasting impact on children’s outcomes (Epstein, Coates, Salinas, Saunders,
& Simon, 1997; Ramey & Ramey, 1999; Snow, Burns, & Griffin, 1998). Therefore, effective
partnerships among parents, educators and other professionals are needed to help children
6
CHAPTER 2
WHAT IS SCHOOL READINESS?
The concept of school readiness or children’s readiness to start school has been
familiar to educators for over 200 years. Swiss educator Johann Heinrich Pestalozzi (1746 -
1827) first mentioned a similar concept in his writings in 1801 (Pestalozzi, 1801/1894). The
concept didn’t become popular in the English-speaking world until his works were translated
into English about a century later. After another century there is still no agreement about the
definition of school readiness among parents, educators, researchers, and policymakers
(Thompson & Raikes, 2007).
There are several different views of what constitutes school readiness. The most
commonly used perspective of school readiness is indicated by chronological age; that is,
using a certain cutoff date to determine when children are ready for school. In most countries
children start school sometime between the ages of 4 and 7 (OECD, 2006); the United States
follows the chronological age requirement of 5 as the typical school entrance age.1 To determine a child’s school readiness, U.S. schools use a cutoff date that varies from state to
state—the date can be as early as July 1 or as late as January 1 of the following year (Saluja,
Scott-Little, & Clifford, 2000). Other countries have somewhat similar criteria; one exception
is New Zealand, where children start school on their 5th birthday (Clifford & Crawford,
2009).
1
School refers to a type of facility that offers formal educational courses to young children. Because
7
The chronological age definition is common in countries with universal primary
education, where children’s right to education is exercised equally regardless of economic
wealth, social status, and other factors. Although using children’s chronological age is a
convenient tool for policymakers and administrators, there are arguments about the great
range of variability in skills among children of the same age, particularly those at both ends
of the age range. Those arguments, coupled with budgetary considerations, often lead to
establishing an older age for school entry—for example, the state of North Carolina has
recently shifted the school cutoff date from October 16 to September 1.
A new definition of school readiness was proposed by Kagan (1992) in early 1990s.
It consisted of two different constructs: readiness for learning and readiness for school and
emphasized the individual child using domains of development and the child’s skills and
competencies. According to Kagan and Rigby (2003), readiness for learning was a
developmental progression to the level when the individual was “ready” to learn specific
concepts, and concerned “the domains of physical development, intellectual ability, and
emotional maturity and health” (p. 1). Readiness for school was different from readiness for
learning, and was understood as a set of skills and competencies, such as cognitive and
linguistics skills, needed in order to be successful in the academic environment (Kagan,
1990; Kagan & Rigby, 2003). The National Education Goals Panel (NEGP, 1997) further
extended this definition by outlining three different aspects of school readiness: ready
schools, ready children, and ready communities. In this expanded definition, child readiness
was based on five domains of child development and learning: (a) physical well-being and
motor development; (b) social and emotional development; (c) approaches to learning; (d)
8
By adopting this definition, NEGP also recognized that the burden for children’s
school readiness should be equally shared by schools, communities, children, and their
parents. Still, despite the efforts expended by stakeholders, reaching school readiness remains
a complex goal. There is no single “formula” for preparing children for school that is agreed
upon by policymakers, educators, parents, and teachers. Nor do there exist universal
instructions for identifying school-ready children. No single readiness test may be trusted as
a reliable method for measuring school readiness (Kagan, Scott-Little, & Clifford, 2003)
given the considerable variability in the range of normal development among children of the
same age (Lewit & Baker, 1995), social and cultural differences, varying purposes of
assessment and the limited accuracy of assessment instruments (Kagan et al., 2003; La Paro
& Pianta, 2000; Meisels, 1989, 2002). Moreover, due to the complexities of the definition of
school readiness, parents, caregivers, and teachers do not share a common understanding of
the construct of school readiness. However, their assumptions about children’s educational
needs and early learning processes frequently guide their teaching. Considering the
significant impact of individual beliefs, values and attitudes on educational practices and
child outcomes (Alexander, Entwisle, & Horsey, 1997; Axinn, Barber, & Thornton, 1999;
Olsen & Bruner, 1996), there is an emerging need to take a closer look at stakeholders’ views
related to school readiness. The following section will examine parents’ and caregivers’
beliefs2 about school readiness and compare the beliefs held by different stakeholders.
2
9
School Readiness Beliefs
Parents are the primary nurturers, supporters, intermediaries, and advocates for their
children (Pianta, 2003), regardless of SES, education, ethnic background, and employment.
As a child’s first teachers, parents make important decisions about the learning experiences
to which their young children are exposed before the start of formal schooling; the quality of
early experiences may enhance or, conversely, impede child development (Stipek, Milburn,
Clements, & Daniels, 1992). Literature suggests that parents’ educational decisions are often
influenced by their beliefs about early learning and school readiness (Barbarin et al., 2008;
Graue, 1992). Parents’ beliefs about school readiness are rooted in a particular system of
values parents hold and their perceived demands of school (Eisenhart & Graue, 1990). How
parents understand school readiness defines their choice of kindergarten, the types of
educational activities parents engage with their young children (Bates et al., 1994; Stipek et
al., 1992), and the skills and competencies parents nurture in their children (Barbarin et al.,
2008).
Studies examining parents’ views of school readiness found that parents had differing
values. In a study by Eisenhart and Graue (1990), parents of children about to start
kindergarten were more concerned about their child’s social development and emotional
maturity than their academic skills. The sociocultural constitution of the construct of school
readiness suggests that the meaning of readiness may differ substantially across diverse
groups (Graue, 1993). A handful of studies that closely examined the concept of school
readiness indicate that parents’ views of school readiness are determined by their education,
socioeconomic, racial, and cultural backgrounds (Diamond, Reagan, & Bandyk, 2000;
10
(1992) found that less educated (and, thus, often poorer) parents were more likely to
emphasize performance and value formal teaching approaches compared to better educated
parents. However, other studies reported minimal differences in the perceptions of parents
from different backgrounds (Barbarin et al., 2008; Piotrkowski, Botsko, & Matthews, 2000).
Similar to parents, other influential adults in a child’s life such as caregivers and
teachers hold their own sets of school readiness perceptions and make decisions guided by
these ideas. Caregivers and teachers may emphasize particular developmental domains that
they view as important for school success. They may have varying expectations and ratings
of child’s school readiness. For example, a study that compared preschool and kindergarten
teachers’ expectations for children’s kindergarten entry skills found that preschool teachers
had higher expectations of children’s performance than their kindergarten teacher colleagues.
While preschool teachers marked 78 items (51% of items) as Important, kindergarten
teachers selected only 6 items or 4% of items (Hains, Fowler, Schwartz, Kottwitz, &
Rosenkoetter, 1989).
Studies that explored preschool teachers’ thoughts about school readiness found that
preschool teachers prioritized socioemotional development, placing less importance on
academic skills. A study of Australian preschool teachers (Cuskelly & Detering, 2003) found
that social skills and emotional maturity were the two most important child characteristics
essential for school readiness. While 70% of the preschool teachers rated social skills and
emotional maturity as Most important for school, about 60% rated academic competence as
Important. Among popular strategies to promote school readiness suggested by preschool
teachers, the top three choices included encouragement/support/praise of children (49.21%
11
Past studies often focused on kindergarten teachers’ perceptions of school readiness.
According to the national survey of 7,000 kindergarten teachers conducted by the Carnegie
Foundation for the Advancement of Teaching (Boyer, 1991), teachers rated 35% of
kindergarteners who entered school in 1990 as not ready for school. Teachers stated
deficiencies in the following areas: proficiency in language—88% of entering
kindergarteners, emotional maturity—86%, general knowledge—83%, social confidence—
80%, moral awareness—60%, and physical well-being—33%. A small study of rural
kindergarten teachers’ perceptions of school readiness (Espinosa, Thornburg, & Mathews,
1997) revealed that rural teachers viewed a higher percentage of their students as prepared
for school than did Boyer’s national sample of teachers. Rural teachers reported that 32% of
kindergartners were deficient in problem-solving skills, 28% could not sit and pay attention
when appropriate, 25% were not ready to learn expected math and literacy concepts, and
25% could not effectively take turns and share with others. Physical development was the
area of least concern for teachers, with only 7% of kindergartners rated as not physically
healthy (Espinosa et al., 1997).
However, these findings are not supported by other studies. In a study of 1,339 public
school kindergarten teachers (Heaviside & Farris, 1993), participants identified the three
most important qualities for kindergarten readiness were for a child to be: (a) physically
healthy, rested, and well-nourished (96%); (b) able to communicate needs, wants, and
thoughts verbally (84%); and (c) enthusiastic and curious in approaching new activities (76
%). A small study of 28 Kansas kindergarten teachers found that 80% of teachers rated few
items from the academic, self-care, and communication categories, including: (a) identifying
12
warning words. Others (Johnson, Gallagher, Cook, & Wong, 1995) argued that teachers
emphasized independence and self-help skills over academic competence. A more recent
study found that kindergarten teachers were primarily concerned about children’s social and
emotional competencies and behaviors, including being able to follow directions and
communicate needs and thoughts, and not be disruptive (Lin, Lawrence, & Gorell, 2003).
Based on these findings, some researchers suggest that parents and teachers may hold
different perceptions about attributes and behaviors important for a child’s academic success
(Ackerman & Barnett, 2005). One of the earliest studies by West, Germino-Hausken, and
Collins (1993) compared parents’ and kindergarten teachers’ responses by examining the
1993 National Household Education Survey (NHES) and the Fast Response Survey System
(FRSS). Consistent with their report, parents believed that it was Very important or Essential
that children know the alphabet (58% of parents vs. 10% of kindergarten teachers), are able
to count to 20 or more (59% vs. 7%), are able to use a pencil or a paintbrush (65% vs. 21%),
and sit still (80% vs. 42%) prior to kindergarten entry. Interestingly, parents’ views were
found to be associated with their education level—compared to parents with a college degree,
significantly more parents who did not graduate from high school rated knowing the alphabet
(73% vs.41%), counting to 20 (70% vs. 50%), and being able to use a paintbrush or a pencil
(78% vs. 54%) as Essential or Very important. West and colleagues (1993) also cautioned
that when the readiness expectations of teachers and parents differ substantially, some
children may be viewed as “unready” and treated differently.
Although some findings indicate that parents’ responses substantially differ from
teachers’ responses, the scarcity of recent research in this area suggests that professionals
13
previous studies, there is a need to examine their rigor. In addition, with the increased
emphasis on academic achievement and on measures of achievement used in high-stakes
decisions about schools and teachers, it may be that parents’ and teachers’ values have
reached a point of convergence.
Congruence of School Readiness Views
It seems logical to believe that to facilitate close and effective collaboration between
parents and schools and to promote children’s academic outcomes, parents’ views of school
readiness should be aligned with caregivers’ and teachers’ views (King & Boardman, 2006;
Welch & White, 1999). The report by the National Center for Education Statistics (West et
al., 1993) stated:
If parents and teachers hold similar beliefs, then there is a greater opportunity for congruence between the skills parents encourage in their children prior to school entry and the skills teachers look for as children enter kindergarten. Such congruence may contribute to a teacher’s positive evaluation of the child early in his or her school life and to the child having a successful early school experience. (p. 1)
Prior research, although not focused on views of school readiness, supports the notion that
higher congruence in parent and teacher perceptions and expectations is linked to more
positive academic outcomes in children and youth (Benner & Mistry, 2007; Peet, Powell, &
Donnel, 1997).
According to Sirotnik (1981), congruence is the notion of agreement or disagreement
between matched pairs. Congruence research is widely used by researchers in many fields,
including medicine, political science, and psychology to assess attitudes, beliefs, perceptions,
expectations, goals, and responses. In education, congruence research (sometimes called
concordance studies) has examined congruence in parent and teacher educational
14
outcomes (Peet et al., 1997), and ratings of their relationships (Iruka, Winn, Kingsley, &
Orthodoxou, 2011). However, despite the recent renewed interest in school readiness,
research on the congruence of school readiness views between parents and teachers is
virtually non-existent. The few studies that examined congruence between parents and
kindergarten teachers or early care providers were conducted more than a decade ago (Hains
et al., 1989; Welch & White, 1999). Therefore, the goal of this dissertation study is to close
the gap in existing research by examining the congruence level of school readiness views
held by parents and caregivers, and the relationship between the congruence of parents’ and
caregivers’ school readiness views and children’s cognitive outcomes in preschool and
kindergarten.
Significance to Social Work
The effects of school readiness go well beyond the child’s academic success and
social performance. School readiness also has long lasting implications for the economic and
social well-being of individuals, their families, and the overall society. While narrowly
defined as an educational concept pertaining to young children, school readiness is essential
for raising well-educated, economically productive, and happier individuals in good health,
who have better jobs, higher earnings, and more opportunities to contribute to the country’s
economic and social development (OECD, 2011). Therefore, school readiness must be
viewed as a complex concept related to multiple disciplines including education, economics,
health, and social science.
Moreover, school readiness, with its extensive impacts on individuals and society has
become a critical issue of social and economic justice. Today many preschoolers are already
15
develop and succeed academically in the years to come. According to a report by Child
Trends (Halle et al., 2009), the effects of income and race/ethnicity may be detected as early
as 9 months of age. Analysis of the ECLS-B data indicates that only 48% of low income
children are ready for school at age 5 compared with 75% of children from more affluent
families (Isaacs, 2012). In the 1998 Early Childhood Longitudinal Study (ECLS-K),
cognitive scores for African American and Hispanic kindergartners were significantly lower
than those of their White peers—about two-thirds of a standard deviation lower in math and
half a standard deviation lower in reading (Duncan & Magnuson, 2005).
Adverse effects of poverty and its associated risks on children’s wellbeing, such as
poor health outcomes (Currie, 2005), lower levels of cognitive and social development
(Duncan et al., 1994; Liaw & Brooks-Gunn, 1994; West et al., 2000), and academic
underachievement (McLoyd, 1998) have been broadly documented in the literature. In
addition, compared to higher income mothers, women in poverty are more likely to be less
educated, single, depressed, and have more health problems and poor parenting skills (Hart &
Risley, 1995; Isaacs, 2012), which has significant effects on their children. Children from
low SES households have lower school readiness and lower scores on cognitive and language
assessment tests (West et al., 2000).
Social work researchers with an understanding of wider societal contexts are
instrumental in investigating the complex issue of school readiness and the achievement gap
for disadvantaged children. The findings from the current study will contribute to promoting
a social work knowledge base in early childhood development and inform programs and
policies. Improved understanding of school readiness will help practitioners develop and
16
failure and their families, and raise awareness about school readiness among parents,
community members, educators, and policymakers. Finally, equipped with better research
evidence and a greater understanding of the importance of school readiness, social workers
17
CHAPTER 3
THEORETICAL AND CONCEPTUAL FRAMEWORKS
Over the past years a number of theoretical perspectives have been applied to the
school readiness research. One of them is Gesell’s maturational theory informed by Darwin’s
theory of evolution. Maturational theory is known to emphasize the biological basis of child
development and downplay the role of environment. Gesell strongly advocated for the “gift
of time”—the belief, that, if given sufficient time, children will master skills following their
inner urges. Until then, he believed, children were not ready to learn and any attempts to
teach children skills and knowledge in advance were destined to fail (Noel & Newman, 2008;
Salkind, 2004). Another theoretical perspective that offered comprehensive insights about the
importance of contextual factors in human development is Bronfenbrenner’s ecological
systems theory (Bronfenbrenner, 1979). In his ecological model, Bronfenbrenner framed
child-environment interactions as the key to understanding development, and mapped the
systems of relationships surrounding every child and their effects on the child.
Vygotsky’s Sociocultural Theory
One theory that has recently received extensive recognition among scholars and
educators is the sociocultural theory of human development developed by Russian
psychologist Lev Semenovich Vygotsky (1896-1934). Unlike other well known theorists,
Vygotsky did not have the opportunity for research and professional exchange, nor did he
18
for a sociocultural theory that recognizes human development as a result of a dynamic
interaction between individuals and society and emphasizes the importance of culture in
human development. This theory suggests that social interaction brings gradual and
continuous changes in a child’s thought and behavior processes and that learning can vary
from one culture to another (Woolfolk, 1998). For Vygotsky, learning results from a child’s
interactions with more knowledgeable persons such as adult family members or peers in the
given social context using cultural tools such as language.
According to Salkind (2004), Vygotsky’s theory rests on four major principles:
• Children actively participate in their development and construct their own knowledge.
For example, if a child faces the need to learn to read, the child will attempt to learn
to read given the appropriate environment.
• Development cannot be separated from its social context. Vygotsky suggested that
culture or social context, along with maturation and environmental effects, were
instrumental in determining children’s development. He asserted that two biologically
identical children raised in different social environments will be different in spite of
having identical sets of genes.
• Learning can lead development. Vygotsky viewed learning not as actual development
but rather as setting the stage for development. By contrast, supporters of learning
theory (Gagne, 1968) stated that development was the cumulative effect of learning.
Vygotsky argued that development follows learning (Newman & Newman, 2007).
• Language plays a central role in mental development. Vygotsky considered language
19
A critical element in Vygotsky’s theory is the zone of proximal development (ZPD),
defined as “the distance between the actual developmental level as determined by
independent problem solving and the level of potential development as determined through
problem solving under adult guidance or in collaboration with more capable peers”
(Vygotsky, 1978, p. 86). This concept indicates that children can do more when an adult or
other more competent person assists and guides them. The term proximal shows that the task
goes slightly beyond the child’s current competence and that the assistance complements and
builds on the child’s existing abilities rather than teaches the child new behaviors. Following
the increasingly complex path of human development, the ZPD expands upwards as the child
masters new skills (Van Geert, 1998).
Several definitions have been applied to the ZPD. Some defined it as the “range of
tasks” (e.g., Berk, 2009, pp. 265-266) that a child cannot yet perform independently but can
accomplish with some help, whereas others described ZPD as skills and abilities that are in
the process of developing (e.g., Green & Piel, 2010). Chaiklin (2007) argued that these
definitions are erroneous as “even the classic definition refers to the level of development,
not tasks” (p. 41), and suggested that such definitions should be interpreted as indicators of
the level of development. Perhaps, a more accurate description is the definition of the ZPD as
“an individual range of learning potential” proposed by Zuckerman (2007, p. 181).
Vygotsky’s approach has captured the interest of a large number of researchers and
practitioners for a number of reasons. First, his theory shifted focus from behavior to
cognition. Sociocultural theory combines the social environment and cognition, and asserts
that interactions with other people are essential for cognitive development. It also recognizes
20
concept of the ZPD has important implications for education and parenting. Vygotsky argued
that conventional tests were not adequate measures of children’s capacity to learn as they
could only evaluate the level of a child’s accomplishment when working independently. To
demonstrate the inadequacy of the conventional assessment, Vygotsky (1934/1986) described
a case of two boys who both at the 8-year-old level on a conventional intelligence test.
However, when presented with new problems and offered slight assistance, one boy scored at
the 9-year-old level and the second scored at the 12-year-old level. Vygotsky believed that in
order to assess a child’s developmental level, it is important to look into the child’s potential
for new learning, in addition to the skills and competencies the child has already mastered
(Crain, 2000).
Those who came after Vygotsky have further expanded and enriched his theoretical
principles with new concepts and practical applications. For example, the concept of
scaffolding, first brought up by Wood, Bruner and Ross (1976), is currently widely used in
educational practice along with the ZPD to describe the process of cognitive learning. In that
context, scaffolding refers to various techniques used by a more experienced person to
support a child in becoming independent in his/her learning. Depending on the child’s level
of performance, scaffolding may take different forms including asking focused questions,
helping the child break the task into smaller steps, giving encouragement, and providing
feedback about progress. For example, a child might not be able to draw with crayons but
could do so with the mother’s assistance. In that case, the mother acts as a scaffold. The
mother’s level of assistance, however, will be adjusted as the child’s learning progresses.
Soon she may only put out crayons and paper on the desk until eventually the child has
21
According to postVygotskians there are two aspects of school readiness originating
from Vygotsky’s theory of child development. The first is social context which includes
societal schooling practices and expectations for the child. The other aspect is the child’s
knowledge of those expectations and his/her ability to meet them. Typically, direct
participation in school activities and interaction with teachers and peers is the best way to
gain knowledge. Therefore, Vygotsky suggested that school readiness is developed during
the first month of schooling, not before school entry. While schools typically do not require
specific skills for school entry, there are certain competencies that make it easier for children
to develop readiness. They include the child’s ability for self-regulation, ability to use
cultural tools to solve problems, and ability to undertake the specific position of a “student”
(Bodrova & Leong, 2007).
Vygotsky’s theory has been criticized for several reasons. Rogoff (2003) challenged
the overemphasis on language as the most important cultural tool in the development of
higher cognitive processes. Rogoff argued that in contrast to societies where verbal
conversation is an essential communication tool, some cultures may have other, equally
important tools, or in some communities, verbal language may not be used much as a cultural
tool. Others (Davydov & Radzikovskii, 1985) criticized Vygotsky’s theory for paying little
attention to the effects of biological factors on a child’s cognition and neglecting the
biological line of human development. Another criticism was that the theory creates a threat
to the child’s independence because it focuses on assistance and guidance by a competent
individual (Crain, 2000).
Despite the criticism, Vygotsky’s sociocultural theory seems well formulated and fits
22
contrast to the maturational viewpoint, which views development leading learning and
recommends giving children “the gift of time” before learning, Vygotsky’s perspective
emphasizes that social interactions and scaffolding experiences lead children’s development.
According to Vygotsky’s perspective, waiting for children to mature enough to demonstrate
school success is counterproductive. Instead, parents and early childhood educators should
provide children with appropriate social opportunities and scaffold early experiences needed
to develop important competencies (Carlton & Winsler, 1999). The terms of scaffolding and
ZPD determine bidirectionality of school readiness, which means that a child does not
mature into readiness but develops the important skills and competencies through early
experiences and assisted learning situations (Carlton & Winsler, 1999)
Theories of child development inform research and practice and provide frameworks
for understanding the development and early learning of children from diverse cultural and
socioeconomic backgrounds. Despite offering different and sometimes conflicting views on
child development, all three theories discussed above continue to be used extensively by
various child development and medical professionals. Many parents and health care
providers still rely heavily on maturation concepts, and the bioecological theory exposing the
complexity of interactions in human development remains a well known framework in social
science research. Vygotsky’s sociocultural theory complements Bronfenbrenner’s by adding
increased emphasis on social and cultural interactions; recently the concepts of scaffolding
and ZPD have been gaining extensive popularity among early childhood educators and
23
Conceptual Framework of the Study
This study utilized the conceptual model presented in Figure 1. The conceptual model
draws on Vygotsky’s sociocultural theory that proposes that social interactions and assisted
learning experiences with more knowledgeable persons have major impact on children’s
learning and development (Woolfolk, 1998). The model supports the hypothesis that parents’
and early care and education providers’ (ECEPs’)3 views, and, in particular, congruent views, may explain some variation in child outcomes. Although not shown on the conceptual model
in order to maintain its simplicity, the model implies bi-directionality of relations between
child outcomes and parents’ and caregivers’ views. The conceptual model further suggests
that parents’ and caregivers’ perceptions may have a combined effect on child outcomes.
Based on Vygotsky’s theory, the model emphasizes the importance of culture in learning,
and implies moderating effects of SES and race/ethnicity on the relationship between
parents’ and caregivers’ views of school readiness and child outcomes. The model also
includes control variables such as child demographics, maternal depression status, and
caregivers’ race/ethnicity and education. Although not shown on the model, moderating
effects of child’s race/ethnicity and SES are implied.
3
24
Reading Score Wave 3
Figure 1. Conceptual Framework of the Congruence Model
Control variables:
• Child, parent and ECEP demographics
(race, gender, age)
• SES, rural residence
• Child health status (low birth weight) • Mother’s depression
• ECEP’s education
Moderator variables:
• Race/ethnicity
• SES
Preschool Outcomes
Kindergarten Outcomes
Math Score Wave 4 Math Score
Wave 3
Reading Score Wave 4 ECEP’s
Views
25
CHAPTER 4
RESEARCH METHODS
Research Questions
The aim of this study is to examine the relationships among parents’ and caregivers’
views about school readiness in association with children’s early cognitive skills (language
and literacy, and mathematics). The conceptual model offers the following hypotheses:
• Hypothesis 1: There is a relationship between parents’ early views4 of school readiness and child cognitive outcomes in preschool and kindergarten.
• Hypothesis 2: There is a relationship between caregivers’ early views of school
readiness and child cognitive outcomes in preschool and kindergarten.
• Hypothesis 3: Parents’ views of school readiness are congruent with caregivers’
views of school readiness.
• Hypothesis 4: The degree of congruence of parents’ and caregivers’ views of
school readiness predicts child cognitive outcomes in preschool and kindergarten.
• Hypothesis 5: SES and race moderate the relationship between parents’ and
caregivers’ views and child cognitive outcomes in preschool and kindergarten.
To better understand the role of parents and caregivers in children’s cognitive
development over time, the study seeks to answer the following questions raised by the
conceptual model:
4
26
1) Is there a relationship between parents’ early views of school readiness and child
cognitive outcomes in preschool and kindergarten?
2) Is there a relationship between caregivers’ views of school readiness and child
cognitive outcomes in preschool and kindergarten?
3) To what degree are parents’ views of school readiness congruent with caregivers’
views of school readiness?
4) Does the degree of congruence of parents’ and caregivers’ views of school
readiness predict child cognitive outcomes in preschool and kindergarten?
5) Do SES and race moderate the relationship between parents’ and caregivers’
views and child cognitive outcomes in preschool and kindergarten?
Study Design
To answer the research questions, this study used the Early Childhood Longitudinal
Study, Birth Cohort (ECLS-B) dataset. The ECLS-B is a large national study funded by the
U.S. Department of Education’s National Center for Education Statistics (NCES), and
several other federal education and health policy agencies. It is a part of the Early Childhood
Longitudinal Study (ECLS), which consists of two cohorts—the birth cohort (ECLS-B) and a
kindergarten cohort (ECLS-K). The ECLS-B has a nationally representative sample of
children born in the United States in 2001 and followed from birth through first grade. The
ECLS-K collected data from a different sample of children from kindergarten through eighth
grade. Together these studies provide policymakers, researchers, child care providers,
teachers, and parents with valuable information about children’s health, nutrition, early
27
The ECLS-B study focuses on child and family characteristics that influence early
development and school readiness for children during the first 6 years of life. Five waves of
data were collected from a nationally representative sample of approximately 10,7005 children born between January and December 2001. The first wave data were collected on
about 10,200 children when the children were approximately 9 months of age. The data
collection took place between October 2001 and December 2002. The second wave of data
collection was conducted with an estimated 9,200 children between January and December
2003 when the children were about 2 years of age. The third or preschool wave data
collection took place during the academic year 2005-2006, and approximately 8,750 children
were directly assessed. At that time children were approximately 48 months old and many
attended preschool. Kindergarten data collection occurred in two consecutive waves—2006
and 2007— as children reached the kindergarten-eligible age in two different years. At the
kindergarten 2006 wave the ECLS-B sample was reduced by 15% due to budget limitations.
The 2006 data collection included all children in the selected subsample regardless of
kindergarten entry; at that point approximately 75% of children were in kindergarten or
higher. The final or kindergarten 2007 wave collected data from approximately 1,900
children who entered kindergarten in fall 2007. About 1,550 were first-time kindergartners
and nearly 200 were repeating kindergarten. For more information about the sampling design
please refer to Appendix A.
The ECLS-B study design utilized several unique elements to produce comprehensive
data for researchers and early childhood professionals. The study oversampled specific
population groups such as American Indian/Alaska Natives/Multiracial, Chinese Americans,
5
28
twins, and low birth weight (LBW) infants. Data on child development and early experiences
was collected longitudinally from children, their parents, caregivers, child care center
directors, and school teachers using direct assessments, interviews, observations,
audiotaping sessions, video recordings, and computer-assisted interviews.
Sample
This dissertation study used a sample of children who participated in both the
preschool and kindergarten 2006 wave cognitive assessments, and who had parent and
caregiver interviews from the preschool wave. Data were available on 8,750 child cognitive
assessments, 8,950 parent interviews, and 6,000 caregiver interviews in the preschool wave.
Of these, overlapping data were available for 6,000 children. In the kindergarten 2006 wave,
cognitive assessment scores were available for 6,900 children. Overlapping data on child
direct cognitive assessments for the preschool and kindergarten 2006 waves, and parent and
caregiver interviews for the preschool wave, were available for a sample of approximately
4,500 children.
Data Collection
During the preschool and kindergarten 2006 waves, data were collected through
direct assessments of children’s cognitive abilities, in-person home interviews with child’s
primary caregivers (mostly the child’s mother), and telephone interviews with the caregiver
with whom the child spent the most time on a weekly basis.
Child Direct Assessments
Children were assessed in two cognitive domains—early reading (language and
literacy) and mathematics. The 30- to 45-minute assessments used a computer-assisted
personal interview (CAPI) and were conducted one-on-one with each child. The ECLS-B
29
contained a routing test that determined a child’s approximate skills.The child’s performance
on this routing test determined the difficulty level of the second-stage test. The assessment
instruments in both early reading and mathematics assessment had three difficulty levels—
easy, middle difficulty, or higher difficulty items.
It is important to note that children with certain physical limitations and those who
did not speak English may have been excluded from cognitive assessment. Because of the
auditory and visual stimuli required, for example, children who used Braille or sign language
were not administered the cognitive component. Additionally, non-Hispanic children who did
not speak English were not assessed because the cognitive battery was available only in
English and Spanish. However, because too few children took the Spanish cognitive
assessment, the Spanish child assessment score was not calculated (Najarian, Snow, Lennon,
& Kinsey, 2010).
Parent Interviews
Data from parents/guardians were collected during home visits using a
computer-assisted personal interviewing (CAPI) technique with interviewers recording responses on a
laptop computer and a self-administered questionnaire when parents/guardians entered their
own responses. The preschool and kindergarten 2006 wave parent interviews were practically
identical and lasted approximately 80 minutes. The interview collected data about the child’s
early development, health status, child care arrangements, and learning experiences as well
as the respondent’s family structure, home environment, attitudes, child care use, and
household income.
Typically, the parent interview respondent was a household member identified as
30
preferred by the study design, a father, stepparent, foster parent, grandparent, relative, or a
nonrelative guardian could be interviewed. According to the ECLS-B user’s manual (Snow et
al., 2009), the child’s mother or female guardian was the respondent for the majority of
cases: 96.0% for the preschool wave and 94.8% for the kindergarten 2006 wave.6 Interviews were conducted primarily in English; however, instruments in Spanish, bilingual
English-Spanish interviewers, and interpreters were available for respondents who spoke other
languages.
Telephone Interviews
Data were collected from caregivers of children who regularly received regular
nonparental care. In the ECLS-B, regular nonparental care was defined as care provided by
someone other than the child’s parent at least once each week (Snow et al., 2009). In cases
when a study child had two or more individuals providing care, the primary provider was the
person who provided the most care. A completed parent interview and parent permission to
contact the caregiver were required to conduct the telephone interview. The caregiver
interviews used computer-assisted interviewing (CAI) technique and lasted 24 and 30
minutes for home-based and center-based cases, respectively.
Measures
Child Assessment Measures
According to the National Education Goals Panel (1997), basic academic skills
constitute an important dimension of school readiness. Therefore, a child’s early reading and
early mathematics direct assessment scores were used as indicators of school readiness. For
the ECLS-B, the items for cognitive assessment were adapted from existing child-assessment
instruments such as PreLas 2000 (Duncan & De Avila, 1998), the Peabody Picture
6
31
Vocabulary Test—Third Edition (PPVT-III; Dunn & Dunn, 1997), the Preschool
Comprehensive Test of Phonological and Print Processing (Pre-CTOPPP; Lonigan, Wagner,
Torgesen, & Rashotte, 2002), and the Test of Early Mathematical Ability-3 (TEMA-3;
Ginsburg & Baroody, 2003). Some items came from the Family and Child Experiences
Survey (FACES) and ECLS-K, or were developed specifically for the ECLS-B (Najarian et
al., 2010). These standardized batteries are based on key milestones of child development
and early school skills and are frequently used as measures of child cognitive outcomes
(Duncan et al., 2007; Magnuson, Meyers, Ruhm, & Waldfogel, 2004; U.S. Department of
Education, Institute of Education Sciences [IES], 2008; Wright et al., 2001).
Measures of Parents’ and Caregivers’ Views of School Readiness
Currently there are no established tools for measuring adults’ views of school
readiness. The ECLS-B used a 15-item measure in parents’ and caregivers’ interviews.
Further investigation revealed that the described measure was composed from Developmental
accomplishments and difficulties items (19 items, 5 subscales) and Teacher feedback items
(11 items, 4 subscales) used in the School Readiness Component of the 1993 National
Household Education Survey (U.S. Department of Education, National Center for Education
Statistics [NCES], 1999). In the ECLS-B surveys for parents and caregivers these items were
used obtain parents’ and caregivers’ ratings of the skills and behaviors commonly considered
as important for school readiness. Responses were based on a 5-point Likert scale and ranged
from Not important (1) to Essential (5) for the caregivers’ scale, and from Essential (1) to
Not important (5) for the parents’ scale. This dissertation study used the sum of the items in
the Likert scale survey in each respective interview to assess parents’ and caregivers’ views
32
caregivers’ scale. The 15 items of the ECLS-B school readiness measure7 are presented in Table 1. More discussion about scale validity and reliability is in the next section.
7
Table 1
School Readiness Instrument and Suggested Corresponding Domains of School Readiness
Items* Domain of school readiness8
a. Finishes task
b. Can count to 20 or more c. Takes turns and shares
d. Has good problem-solving skills e. Is able to use pencils and paintbrushes f. Is not disruptive of the class
g. Knows English language
h. Is sensitive to other children’s feelings i. Sits still and pays attention
j. Knows most of the letters of the alphabet k. Can follow directions
l. Identifies primary colors and shapes m. Communicates needs, wants, and thoughts
verbally in primary language n. Writes own name
o. Reads or pretends to read storybooks
a. Approaches Toward Learning
b. Cognition and General Knowledge/Language Development c. Social and Emotional Development/Approaches Toward Learning d. Approaches Toward Learning
e. Physical Well-Being and Motor Development
f. Social and Emotional Development/Approaches to Learning g. Language Development/Cognition and General Knowledge h. Social and Emotional Development
i. Approaches to Learning/Social and Emotional Development j. Language Development/Cognition and General Knowledge k. Language Development/Cognition and General Knowledge l. Cognition and General Knowledge/Language Development m. Language Development/Cognition and General Development
n. Language Development/Motor Development
o. Language Development/Approaches Toward Learning
*Items derived from Parent Interview (items PA095a-o) and Caregivers’ Questionnaire (items CB040a-o).
8
Domains of school readiness as defined by the National Education Goals Panel (1997).
3
34
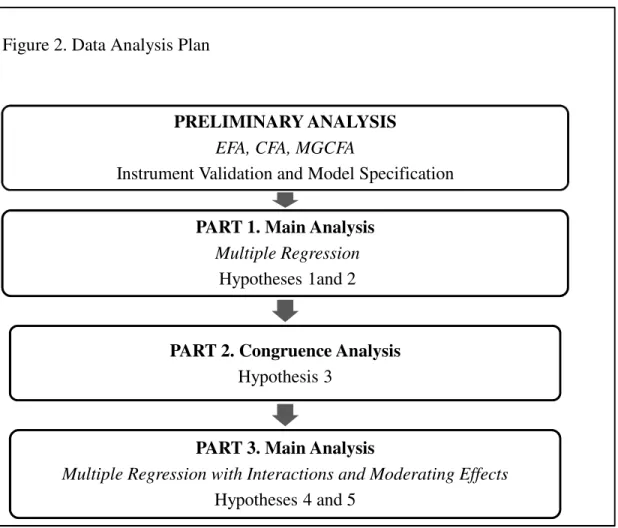
Data Analysis
Data analyses were conducted in several steps, and two of them served as important
prerequisites to performing the main analysis. Schematic depiction of the data analysis plan
is presented in Figure 2. The preliminary analysis involved examination and validation of the
measure of parents’ and caregivers’ views on school readiness. The sample was randomly
split into two equal subsamples for cross-validation. Exploratory factor analysis (EFA) was
performed on the first subsample to explore the underlying structure of latent constructs,
separately for parents’ and caregivers’ data. EFA served as an empirical test of the
multidimensionality of the construct of school readiness, and further refined the instrument
by determining and retaining the influential factors. Next, confirmatory factor analysis (CFA)
was performed on the second subsample both for parents’ and caregivers’ data. CFA
examined the EFA findings and developed the best fitting models by applying fit indices.
Finally, multiple group confirmatory factor analysis (MGCFA) was conducted to examine
measurement invariance and test the equivalence of items and factorial structure of the
instrument across two subsamples.
In the main part of analysis, multivariate regression analyses were performed to
explore the relationship of parents’ and caregivers’ views and other predictors to children’s
cognitive outcomes. In the next step, the congruence of parents’ and caregivers’ views on
school readiness was assessed using multiple statistical techniques ranging from the simplest
(calculating absolute difference scores between paired parent and caregiver responses) to the
more sophisticated (estimating agreement indices). Then, interactions between congruence of
parents’ and caregivers’ views of school readiness and their relationship with children’s
35
20.0, Amos Graphics, and STATA 12.0 versions of statistical software were used in the
analyses. More detailed description for each analytic step is provided below.
Figure 2. Data Analysis Plan
Preliminary Analysis: Instrument Validation and Model Specification
As mentioned earlier, a 15-item School Readiness Instrument used by ECLS-B was
adapted from the 1993 National Household Education Surveys Program questionnaires.
However, the instrument had no known psychometric properties. Based on the review of
literature and exploration of suggested domains of school readiness (NEGP, 1997) a priori
hypothesis was that the measure consisted of multiple underlying latent factors including
Academic Skills and Social and Behavioral Competence or Social Skills.
PRELIMINARY ANALYSIS EFA, CFA, MGCFA
Instrument Validation and Model Specification
PART 1. Main Analysis Multiple Regression
Hypotheses 1and 2
PART 2. Congruence Analysis
Hypothesis 3
PART 3. Main Analysis
Multiple Regression with Interactions and Moderating Effects