EARLY BRAIN DEVELOPMENT IN CHILDREN AT RISK FOR SCHIZOPHRENIA
Veronica A. Murphy
A dissertation submitted to the faculty at the University of North Carolina at Chapel Hill
in partial fulfillment of the requirements for the degree of Doctor of Philosophy in the
Neuroscience Curriculum in the School of Medicine.
Chapel Hill
2019
ii
iii
ABSTRACT
Veronica A. Murphy: Early brain and cognitive development in children at risk for
schizophrenia
(Under the direction of John H. Gilmore)
Schizophrenia is a severe and complex mental illness that is heterogeneous in its
presentation of symptoms and outcomes and affects approximately 1.1% of individuals in
the United States. The etiology of the disorder is still unknown, but it is thought to be
highly influenced by genetic and environmental factors. First-degree relatives of patients
with psychiatric disorders are a great resource for understanding the familial (genetic) risk
of psychosis with recurrence of risk ranging from 15% to 40% in offspring. Brain structure
alterations, cognitive deficits, and social impairments that are common in mental illness
are also present in at risk adolescents and youth for schizophrenia, to improve methods
of early recognition and intervention. However, cognitive dysfunction and negative
symptoms appear to arise much earlier than the onset of psychosis.
iv
cerebrospinal fluid (EA-CSF) in a cohort of TD (N=105) and SCZHR (N=38) children,
and its relationship to brain structure using 3T MRI and the ELC scores at ages 1 and 2
years. Lastly, we examined the brain structure and cognitive development relationship
to EA-CSF and the heritability of EA-CSF in a cohort of monozygotic (N=117) and
dizygotic (N=158) twins ages, 1 and 2 years. Our results showed that alterations of
cognition and brain structure associated with risk for schizophrenia are evident in very
early childhood. EA-CSF volume is heritable at both ages 1 and 2 years and is
v
To my parents, Anthony and Helen Murphy, for without them, I am nothing. I now
recognize the great effort you took to ensure that Anthony and I had the tools to
navigate this life, and without you, I am still unsure of where I would be. Your sacrifice
for your children has always shown me pure, unconditional love.
To my brother and sister, I appreciate all that you have done for me in ways greater
than I can express. To my sisterhood, Lexie, Somara, Lauren, Chandra, Brittany,
Meeks, Haley, Brittany, Ashley, Aisha, Lydie, Octavia, Lucy, Angie, and Zayna (Bayna),
thank you for literally pushing me through.
vi
ACKNOWLEDGMENTS
Without the collaborative nature of the EBDS laboratory, none of this work would be
possible. I am forever grateful for my PI, Dr. John H. Gilmore, who has been
consistently kind, patient, and encouraging throughout my entire matriculation as a
graduate student and who has created a collaborative and friendly lab environment that
is inclusive to all. I give similar regards to my “2nd” PI, Dr. Martin Styner, who has been
one of the greatest teachers I have had. To my peers, Alex, Shaili, Jessica, and Mark, I
am grateful for the times we shared and the science we have accomplished as a team.
I want to show my appreciation to all members of the EBDS lab who have helped me
accomplish many projects, answer many questions, and guide my research. I thank
you. To Joe Blocher and Dr. Cornea, your help throughout this journey is truly
invaluable, and I am forever grateful for the moments we spent teaching me things that
weren’t only new to me but interesting.
To my thesis committee, I appreciate the fantastic feedback and questions you always
gave me. You have truly helped shape my mind as a research scientist, and I am
eternally grateful.
vii
viii
PREFACE
Chapter 1 provides a brief background of brain development, proposed
pathophysiological mechanisms of psychosis and a review of altered brain and cognitive
structure seen in schizophrenia. This chapter concludes with an overview of the aims
and hypotheses for this report.
Chapter 2 is a research chapter that outlines the motivation and results of aim 1.
It describes the relationship between being at risk for schizophrenia and brain and
cognitive development. This chapter is a manuscript under review at Schizophrenia
Bulletin.
Chapter 3 is a research chapter that addresses the second specific aim. It details
the relationship of being at risk for schizophrenia and having increased extra-axial CSF
(EA-CSF) by characterizing the distribution of EA-CSF. This chapter is a manuscript in
preparation.
Chapter 4 is a research chapter that addresses the third specific aim. It details
the genetic and environmental contributions of EA-CSF in the developing brain. This
manuscript is in preparation.
ix
TABLE OF CONTENTS
CHAPTER 1 – INTRODUCTION ... 1
Basics of early brain development ... 1
CSF development, circulation, and signaling ... 2
Schizophrenia, a neurodevelopmental disorder ... 3
Proposed pathophysiological mechanisms ... 5
Alterations of cognition and brain structure in schizophrenia patients and HR ... 6
Rationale and Specific Aims ... 7
CHAPTER 2 – EARLY BRAIN STRUCTURE AND COGNITIVE DEVELOPMENT IN
CHILDREN AT RISK FOR SCHIZOPHRENIA ... 10
Introduction ... 10
Materials and Methods ... 12
Results ... 17
Discussion... 20
Limitations ... 23
Conclusions ... 24
Chapter 3 INCREASED EXTRA-AXIAL CEREBROSPINAL FLUID IS ASSOCIATED
WITH DECREASED CORTICAL THICKNESS AND DELAYED MOTOR
DEVELOPMENT IN EARLY CHILDHOOD ... 103
Introduction ... 103
Materials and Methods ... 104
x
Discussion... 110
Limitations ... 114
Conclusion ... 114
Chapter 4 INCREASED EXTRA-AXIAL CEREBROSPINAL FLUID IS HERITABLE IN
MONOZYGOTIC AND DIZYGOTIC TWIN PAIRS IN INFANCY ... 172
Introduction ... 172
Materials and Methods ... 173
Results ... 178
Discussion... 181
Limitations ... 185
Conclusion ... 186
Chapter 5 CONCLUSION ... 240
Summary of Findings ... 240
CONTRIBUTIONS TO THE FIELD ... 241
FUTURE DIRECTIONS ... 250
Overall Conclusions ... 259
xi
LIST OF TABLES
Table 2.1 Continuous and Categorical Variables for mothers with schizophrenia and
control mothers ... 25
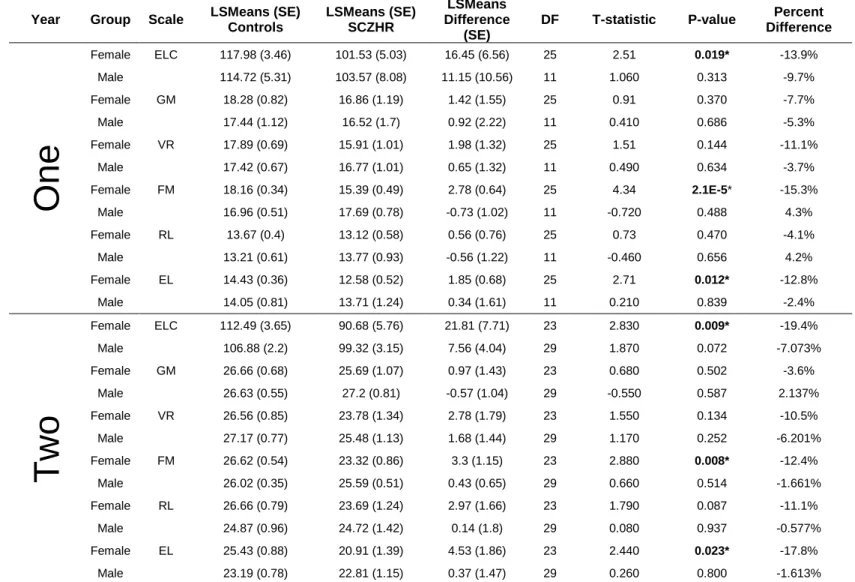
Table 2.2. Comparison of Mullen ELC and Scales in SCZHR Infants and Typically
Developing Controls ... 27
Table S2.1 SCZHR vs Control Infants Main Analysis at One and Two Years-Mullen
Scales of Early Learning ... 30
Table S2.2 SCZHR vs Control Infants Secondary Analysis Propensity Matching Sample
at One and Two Years-Mullen Scales of Early Learning ... 31
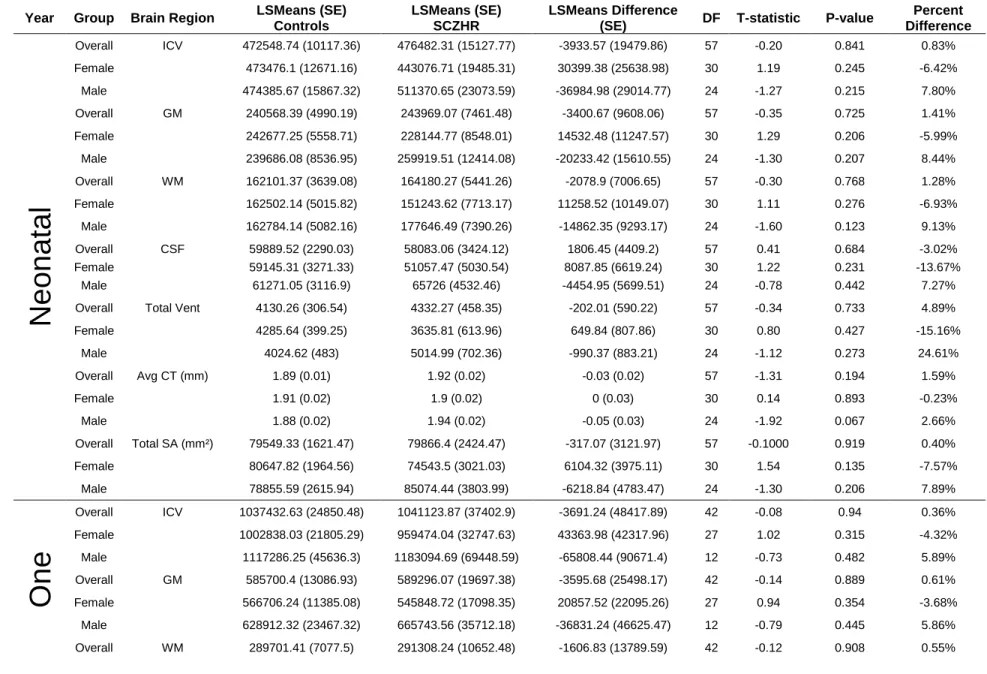
Table S2.3 SCZHR vs Control Infants Main Analysis at Birth, Year One and Year Two-
Brain Tissue Volumes (mm³) ... 32
Table S2.4 SCZHR vs Control Infants Secondary Analysis Propensity Matching Sample
at Birth, Year One and Year Two- Brain Tissue Volumes (mm³) ... 35
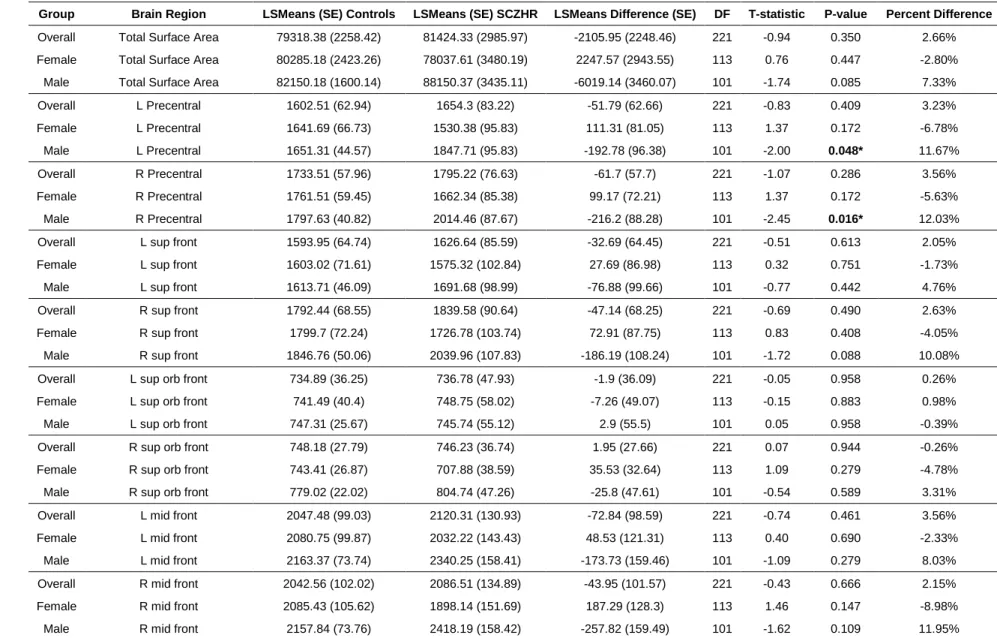
Table S2.5. SCZHR vs Control Infants Main Analysis at Birth, Year One and Year Two-
Surface Area (mm²) ... 38
Table S2.6. SCZHR vs Control Infants Main Analysis at Birth, Year One and Year Two-
Surface Area (mm²) ... 62
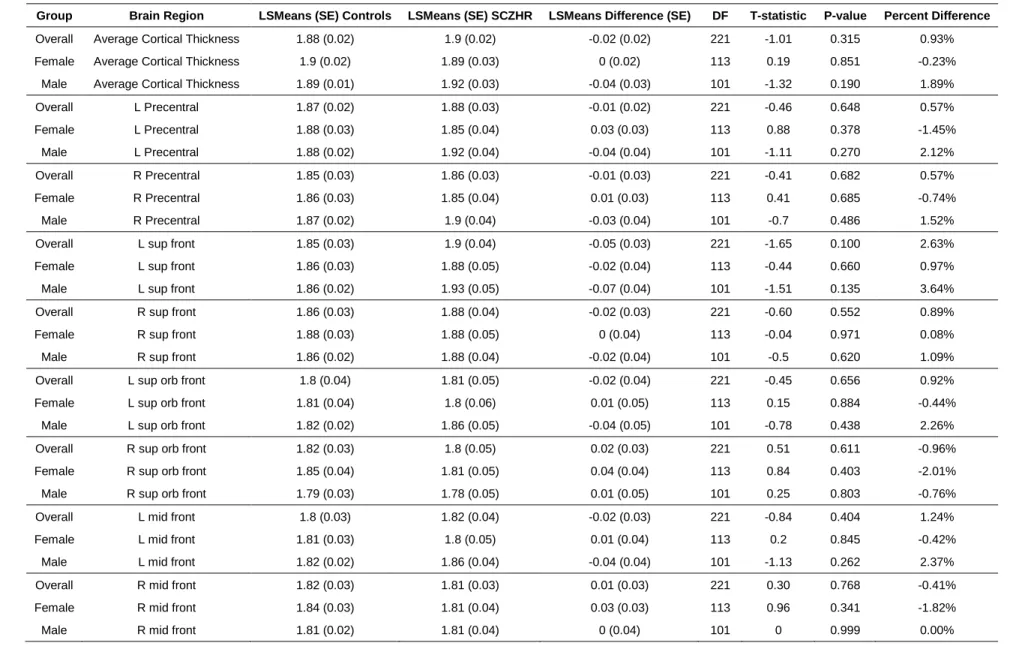
Table S2.7 SCZHR vs Control Infants Corrected P-values Cortical Thickness (mm) .... 85
Table S2.8 SCZHR vs Control Corrected P-values Surface Area (mm²)) ... 94
Table 3.1. Demographic variables continuous and categorical variables for all subjects.
... 116
Table 3.2. Brain tissue relationships to EA-CSF at ages 1 and 2 years. ... 117
Table 3.3 Demographic variables relationship to EA-CSF ages 1 and 2 years. ... 118
Table 3.4. EA-CSF relationship to Mullen Scales at ages 1 and 2 years. ... 119
Table 3.5. EA-CSF Relationship to High-Risk Status at ages 1 and 2 years. ... 119
Table S3.1 Brain Tissue Volumes (mm³) - Relationship to EA-CSF in Typically
Developing Subjects... 124
xii
Table S3.3 Cortical Thickness (mm)- Relationship to EA-CSF in Typically Developing
Subjects ... 130
Table S3.4 Total Surface Area (mm²)- Relationship to EA-CSF in Typically Developing
Subjects ... 146
Table S3.5 Mullen Scales of Early Learning- Relationship to EA-CSF in Typically
Developing Subjects... 162
Table S3.6 Corrected P-values for EA-CSF Relationship to Cortical Thickness and (mm)
Surface Area (mm²) ... 163
Table 4.1. Demographic Variables Continuous and Categorical Variables for all
subjects. ... 188
Table 4.2. Brain Tissue Relationships to EA-CSF at ages 1 and 2 years... 189
Table 4.3. Demographic variables Relationship to EA-CSF ages 1 and 2 years ... 190
Table 4.4. EA-CSF relationship to Mullen Scales at ages 1 and 2 years ... 191
Table 4.5. Cross-twin correlations between MZ and DZ twin pairs ... 191
Table 4.6. Heritability of Brain Tissue Measures. ... 191
Table 4.7. Genetic Correlation of EA-CSF to Brain Tissue Measures. ... 191
Table S4.1 Brain Tissue Volumes (mm³) - Relationship to EA-CSF in Typically
Developing Subjects... 197
Table S4.2 EA-CSF Relationship to Demographic Variables in Typically Developing
Subjects ... 199
Table S4.3 Cortical Thickness (mm)- Relationship to EA-CSF in Typically Developing
Subjects ... 203
Table S4.4 Surface Area (mm²)- Relationship to EA-CSF in Typically Developing
Subjects ... 216
Table S4.5 Mullen Scales of Early Learning- Relationship to EA-CSF in Typically
Developing Subjects... 230
xiii
LIST OF FIGURES
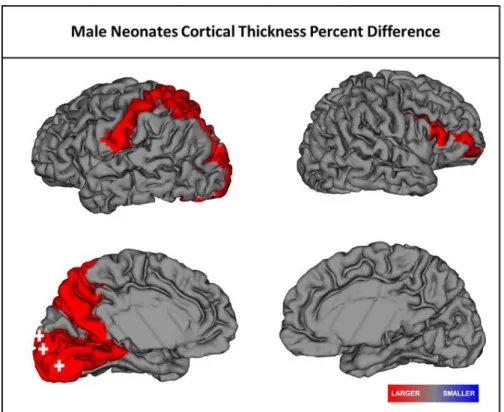
Figure 2.1 Significant regional differences in cortical thickness in male SCZHR neonates
when compared to Controls. Red represents larger CT relative to controls. Plus sign:
significant after FDR correction. ... 28
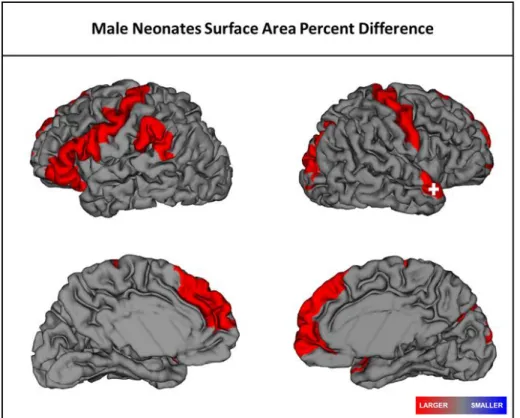
Figure 2.2 Significant regional differences in surface area in male SCZHR neonates
when compared to Controls. Red represents larger CT relative to controls. Plus sign:
significant after FDR correction. ... 29
Figure 3.1. Boxplots of EA-CSF at ages 1 and 2 years. ... 120
Figure 3.2. Scatter plot of EA-CSF in the longitudinal sample from 1 to 2 years. ... 121
Figure 3.3. Scatter plots of EA-CSF relationships to gray matter, white matter and
cerebrospinal fluid from 1 to 2 years. ... 122
Figure 3.4. Regional relationships of EA-CSF to CT and SA at 1 and 2 years. Red
represents a positive association and blue represents a negative association with
EA-CSF. ... 123
Figure 4.1. Boxplots of EA-CSF at ages 1 and 2 years. ... 193
Figure 4.2. Scatter plot of EA-CSF in the longitudinal sample from 1 to 2 years. ... 194
Figure 4.3. Scatter plots of EA-CSF relationships to gray matter, white matter and
cerebrospinal fluid from 1 to 2 years. ... 195
Figure 4.4. Regional relationships of EA-CSF to CT and SA at 1 and 2 years. Red
xiv
LIST OF ABBREVIATIONS
a²- additive genetic component
ASD- autism spectrum disorder
c² - common environmental component
CNS- central nervous system
CSF- cerebrospinal fluid
CT- cortical thickness
DISC1- Disrupted in schizophrenia 1 protein
e² - unique environmental component
EA-CSF- extra-axial cerebrospinal fluid
ELC- Early Learning Composite
FDR- False Discovery Rate
GM- gray matter
GRIN2A- Glutamate Ionotropic Receptor NMDA Type Subunit 2A
HC- healthy controls
HR- high risk
IPC- intermediate progenitor cell
MRI- Magnetic Resonance Imaging
NMDAR- N-Methyl-D-Aspartate Receptor
p- p-value
RGC- radial glia cell
ROI- region of interest
SA- surface area
xv
SCZHR- genetically at risk for schizophrenia
SD- standard deviation
SE- standard error
t- t-statistic
T1w- T1-weighted
T2w- T2-weighted
TBV- total brain volume
TD- typically developing
1
CHAPTER 1 – INTRODUCTION
Basics of early brain development
The fundamental foundations of brain structure are established during the rapid
growth of early brain development
1–3. Brain development can be described in three
stages that occur from gestation until older age. The first stage occurs during the first
half of pregnancy when cell proliferation and migration occur, causing cortical thickness
(CT) and surface area (SA) growth
4. The second stage begins half-way through
gestation and can continue up to two years afterward
5. It is dominated by the formation
of new neuronal connections, causing tangential expansion of the outer cortex and
cortical stress which leads to gyrification. Myelination also reaches its peak resulting in
increased white matter development. The final stage of brain development takes place
for the remainder of the lifespan and includes mostly synaptic pruning and even some
synaptogenesis. The cortex continues to remain plastic, allowing for gyrification to occur
to adjust for the cortical stress caused by the few neuronal connections made during
this stage.
Typical development of the brain is immensely dependent upon and regulated by
the diverse generation of neuronal progenitor cell types
3. In the first two years of life,
2
6
. RGCs divide asymmetrically, leading to one intermediate progenitor cell (IPC) and an
RGC that remains in the ventricular zone
5. RGCs expand the cortex by migrating
tangentially, and IPCs fill the cortical layers radially. The radial unit hypothesis theory
suggests that the number of radial units primarily causes the expansion of SA, while
thickness is due to neuronal output from the radial units
6.
Cortical structural growth is due to the increase of synapses, dendrites,
long-range axons and myelination
7. These elements of growth are essential for the proper
establishment of the fundamental organization of neural circuitry used for the integration
and performance of specific brain functions. However, alterations in cognition, gray
matter, white matter, CT and cerebrospinal fluid (CSF) are hallmark structural
differences for at risk individuals and patients of schizophrenia
8–18. Through the use of
MRI data and cognitive assessments, we can establish a possible period of intervention
by identifying cognitive delays and brain structure alterations during rapid brain growth.
CSF development, circulation, and signaling
CSF circulation is vital for the growth of the brain
4,19. CSF flows from the choroid
plexuses into the subarachnoid space, supplying many of the growth factors, peptides,
and proteins needed for brain nutrients
4,19,20. It also plays a critical role in creating
homeostasis through the elimination of toxic waste that accumulates in the brain
21,22.
Mouse model studies reveal that cerebroventricular system development occurs after
the neural tube closes, trapping amniotic fluid as the initial CSF during the first few
weeks of gestation
5,23. The choroid plexus is the continuous generator of CSF in the
mature brain and begins to develop sequentially in each ventricle
4. Cortical neurons in
3
production of CSF
4,24. Choroid plexuses secrete similar and distinct proteins that help
regulate cell proliferation and brain size that are specific to each ventricular zone
4,25–27.
The proteome of CSF in the rodent and human ventricular systems are diverse
4.
Rodent studies reveal the rat brain has 61 distinct proteins found in the lateral ventricles
that are not present in the hindbrain, suggesting these proteins have region-specific
functions
28. Meninges also play a role in cortical development by releasing diffusible
factors to signal proliferation and migration of neural progenitor cells and neurons
5. The
meningeal lymphatic system is essential for the removal of immune cells from the
central nervous system (CNS) allowing waste clearance of inflammatory proteins in
CSF
23. This suggests that CSF also plays a vital and instructive role in the developing
brain by potentially providing signaling for cell proliferation while removing toxic material
from the CNS. Alterations in the CSF circulation systems could cause changes in brain
development are often found in neurodevelopmental disorders
23,29–31. It is crucial to
understand how malformations of the cerebroventricular system can occur to help
improve treatment, enable diagnostics and prevent neurodevelopmental disorders.
Schizophrenia, a neurodevelopmental disorder
Schizophrenia is a severe mental disorder that has a lifetime risk of ~1% in the
general population and is associated with adverse effects on health, society and
economics
32,33. Heritability of schizophrenia ranges from 60% to 80% in twin studies
and ranges from 15% to 40% in offspring studies of children with one or more parent
with the disorder
34. Clinically, this disorder is characterized by core features of positive
4
impairments can occur many years before the first episode of psychosis or during the
prodromal stage, suggesting that disruptions or alterations arise during brain
development.
Prenatal neurodevelopment is implicated as a critical period of heightened risk
for schizophrenia due to influential environmental and genetic factors
37. Transcriptional
and epigenetic links to schizophrenia suggest that environmental and genetic risks
affect important molecular influences during prenatal development
38,39. Prenatal,
adverse complications like premature birth, preeclampsia, and intrauterine infection are
environmental factors thought to influence risk for schizophrenia
36,40,41. We have also
assessed demographic and obstetric variables associated with brain volumes and found
that gestational age and birth weight are significant predictors of brain volume
measurements and can be influenced by prenatal complications
42. Genes linked to
schizophrenia tend to be expressed more during fetal, rather than postnatal
development
43–45. Whole genome exon sequencing results show de novo single
nucleotide variants in candidate genes like Disrupted in schizophrenia 1 protein (DISC1)
that regulates neurogenesis and brain maturation, and Glutamate Ionotropic Receptor
NMDA Type Subunit 2A (GRIN2A), a gene that encodes N-methyl-D-aspartate
receptors (NMDAR), and some cases of rare case-specific variants of schizophrenia
46.
5
Proposed pathophysiological mechanisms
Theories of pathophysiological mechanisms have been linked to alterations in the
dopaminergic and glutamatergic pathways and brain inflammation
47. Increased
production and release of dopamine in the striatum have been seen as the underlying
mechanism of schizophrenia for many years
48–50. In untreated schizophrenia patients,
increased dopamine synthesis has been predictive of increased psychosis
50,51.
NMDARs, glutamate receptors, are possibly related to cognitive dysfunction seen in
schizophrenia and these alterations can occur during the prenatal period of brain
development
32,52. NMDARs are essential for synaptic plasticity during brain
development when the subunits of the receptor switch to a more mature receptor
composition allowing for optimal timing of neuronal firing
53. The effects of inadequate
NMDAR subunit switching can cause the failure of differentiating between strong and
weak fibers leading to an increase in loss of synaptic connections that are needed for
the developing brain
54,55. This leads to the downstream adverse effect of
hypofunctioning of GABA-ergic interneurons which is linked to altered cognition
54,56. It
can also affect brain development when the fetus is vulnerable to environmental
influences resulting in adverse outcomes like hypoxia, birth stress, infection or drug use
49,57
. This suggests that alterations seen in high risk (HR) and patients with
schizophrenia occur during development, long before the first signs of psychotic
episodes or even cognitive decline.
Inflammation of the brain has been proposed as a possible mechanism for
alterations in the cortical structure of patients with schizophrenia for many years
58.
6
postmortem brains of schizophrenic patients, recent-onset and chronic, and could be a
possible biomarker for infection of the brain
54,59. Levels of microglia, the primary cell of
the immune system in the CNS, increases during brain development and are
instrumental in neuronal maintenance
5,59–61. However, activated microglia produce
neurotoxic substances like free radicals and proinflammatory cytokines that are
damaging to neuronal and glial cells
60. If inflammation persists, adverse effects can
occur on the developing and adult brains resulting in cognitive dysfunction and brain
volume loss
62. Interestingly, prenatal exposure to infection to the developing brain is a
known risk factor for later development of psychiatric disorders and has a causal link to
abnormalities of the dopaminergic system in rodent models
59,63. The risk for
schizophrenia tends to also increase after perinatal infections, which suggests
inflammation is a plausible mechanism for the symptoms of schizophrenia and other
neurodevelopmental disorders
54.
Alterations of cognition and brain structure in schizophrenia patients and HR
Brain alterations and cognitive deficits can be detected in adolescent patients
with schizophrenia and are commonly studied through brain structure differences,
cognitive testing and genetic analyses at the onset of psychosis
9,10,64. Altered cognition
is a staple symptom of schizophrenia and can be seen in HR youth who have been
found to have lower IQs than TD individuals their age
65. The significant predictors of
onset of psychotic disorders in HR children are childhood motor-cognitive features,
behavioral problems, and socio-emotional disturbances
66,67. Interestingly, children
7
Investigations focusing on early intervention and prevention of mental illness
have caused a shift towards characterizing abnormalities in younger HR individuals,
particularly around the age of onset for psychosis. However, brain aberrations have
been found in young children who are at risk for psychiatric illness also
68,69. Magnetic
Resonance Imaging (MRI) is a safe, non-invasive tool often used to identify the
functional framework of the brain while finding neuroanatomical measures that are
promising for biomarkers. MRI studies have shown abnormalities in gray matter
volumes, lateral ventricles, CT and SA in schizophrenia patients and HR
9. We
previously found structural defects in male HR infants in a match-control study
observing brain abnormalities associated with genetic risk for schizophrenia
29. Two of
our collaborators have found alterations in CSF volume during early stages of child
development in children who are at genetic risk for mental illness
70–73. This suggests
that changes in biological processes affecting brain development occur much earlier.
Determining heritable, disease-specific markers of genetic risk can be accomplished by
identifying neuroimaging abnormalities that are associated with familial vulnerability
through the use of MR techniques and cognitive testing.
Rationale and Specific Aims
Brain development is a complex task that requires numerous processes to
8
regional cortical thinning and altered brain volume measurements in HR neonates,
suggesting that infancy is a critical window to detect early altered brain development
that is likely occurring during gestation
29,74. We observed the structural and cognitive
differences, characterized a potential early imaging biomarker for EA-CSF and
determined environmental and genetic contributions to EA-CSF in TD and SCZHR
infants, ages 0 to 2 years.
Aim1/Chapter 2: Determine the relationship between inherited risk for
schizophrenia and global tissue volumes, CT, SA, and cognition in infancy.
Alterations in brain structure and cognition have been observed in chronic and
first episodic patients, the prodrome, and SCZHR, however, no study has found these
differences in at risk infants, ages 0-2. To address this gap, we examined the
relationship between HR status and measures of brain development and cognition. We
hypothesized that brain structure abnormalities and cognitive deficits would be
associated with being at risk for schizophrenia. We observed relationships between HR
status and ventricle and brain enlargement, as well as alterations in gray matter, white
matter, cortical SA, CT, and cognitive development. These results give us insight into
the influence of genetic risk for mental illness on the brain and cognitive development
while highlighting the need for understanding the effects of such as early as possible.
Aim2/Chapter 3: Determine the relationship between being at risk for
schizophrenia and having increased CSF by characterizing the distribution of
EA-CSF in the developing brain.
9
To broaden our understanding, we quantified and observed the distribution of EA-CSF
in TD and SCZHR children ages 1 to 2 years. We hypothesized EA-CSF would be
increased in HR subjects, associated with enlarged ventricles and brain volume as well
as cognitive delays. This work gives a greater understanding of the development of
EA-CSF in a TD population and in those at risk, which can provide a better understanding
of the specificity of EA-CSF as a biomarker of risk.
Aim3/Chapter 4: Determine the genetic and environmental contributions to the
development of EA-CSF.
Genetic influences are key components in developing schizophrenia, and
behavioral genetic analyses have shown that heritability of schizophrenia ranges from
60% to 80%
34. Heredity of brain structure can be studied using twin analysis.
Therefore, we observed the heritability of EA-CSF using OpenMx, a statistical package
for analyzing genetic data from multiple groups. We hypothesized, EA-CSF would be
highly heritable; EA-CSF can be argued to be a heritable trait because of its familial link
to increased head size and observations of concordant increases of EA-CSF in twin pair
and triplet case studies
75. This analysis reveals how genetic and environmental factors
10
CHAPTER 2 – EARLY BRAIN STRUCTURE AND COGNITIVE DEVELOPMENT IN
CHILDREN AT RISK FOR SCHIZOPHRENIA
Introduction
Schizophrenia is a complex and heterogeneous mental illness with origins in the
early stages of neurodevelopment
76. Many of the genes conferring risk for
schizophrenia play a role in early brain development and are highly expressed in the
prenatal period
44,77. Pre- and perinatal environmental factors also significantly increase
risk for schizophrenia, including maternal infection, hypoxia and other obstetric
complications
78–80. Numerous studies indicate that deviations from normal cognitive
and motor developmental trajectories are present very early in childhood
34,81,82.
Despite this evidence, very few studies have examined the development of brain
structure and function in young children at high familial risk for schizophrenia during the
earliest and most rapid phase of development from birth to age 2 years.
A variety of abnormalities in brain structure have been identified in persons with
schizophrenia, including gray matter volume reductions
83,84. While some of these
11
that some structural brain abnormalities may represent an intermediate phenotype of
risk and may be useful as an early biomarker
9,11,88.
Given the evidence implicating atypical brain development in schizophrenia and
the presence of structural brain abnormalities in at-risk individuals, we hypothesized that
alterations of structural brain development are evident at birth, and in very early
childhood in at-risk children
74,89Our previous research has shown that male infants at
high genetic risk for schizophrenia (SCZHR), have larger gray matter and lateral
ventricle volumes compared to TD controls at birth
88. In a separate study, we found
evidence of greater CT in neonate SCZHR males and lower CT in neonate SCZHR
females
19. We also found altered structural connectivity of gray matter networks in
male high risk neonates
90. Here we report results from a study of cognitive and
structural brain development in children at HR for schizophrenia. This new study
includes measures of global tissue volumes, CT (CT) and SA (SA), evaluated at birth, 1
and 2 years and of cognitive development. SCZHR children were compared both with a
large population of controls and a smaller matched sample to account for possible bias
due to large demographic differences between SCZHR and controls. Since there are
sex-specific neurodevelopmental trajectories, we also investigated possible sex-specific
effects
91,92. We hypothesized that SZCHR young children would have deficits in
12
Materials and Methods
Subjects
This study was approved by the biomedical institutional review board of the
University of North Carolina at Chapel Hill (UNC) and is part of the UNC Early Brain
Development Study
1,42,93. Pregnant women with schizophrenia or schizoaffective
disorder and control mothers without a history of major psychiatric illness were recruited
between 2003 and 2014 through inpatient and outpatient psychiatric facilities, emails,
and obstetric clinics in central North Carolina. Enrollment exclusions included major
medical illness or pregnancy complications, active substance use during pregnancy at
the time of enrollment, or fetal abnormality on ultrasound (women with brief substance
use before learning they were pregnant were also enrolled). SCZHR and control infants
were excluded from this analysis if they had any major medical illness or abnormality on
MRI other than a minor intracranial hemorrhage which is common in the neonatal period
94
. Additional exclusions for control subjects included maternal or paternal psychiatric
history. Infants were scanned at approximately 2weeks of age and returned at ages 1
and 2years for MRI and cognitive assessments.
Mothers with psychiatric illness were given the Structured Clinical Interview for
DSM-IV Axis Disorders (SCID)
88. Control mothers were screened with a modified SCID
13
N=2; major depressive disorder N=1; bipolar disorder N=1; substance abuse N=1;
alcohol abuse N=1; psychosis diagnosis N=1).
Final numbers of mother-infant dyads included for this analysis are: 41 SCZHR
and 268 controls (Table 2.1A). A subset of mother-infant dyads were included in a
previous study (N=20 SCZHR and N=21 control) of brain structure in SCZHR neonates
88
. There were 231 neonatal subjects (N=21 SCZHR; N=210 controls), 122 subjects at
1year (N=24 SCZHR; N=98 controls), and 110 subjects at 2years (N=24 SCZHR; N=86
controls) in our main analysis. In a secondary analysis, we compared SCZHR subjects
to a subset of control subjects selected by propensity score matching based on
covariates of interests (see Materials and Methods: Statistical Analysis). Each SCZHR
subject was matched with two controls at each age: 36 SCZHR and 87 controls; with 60
neonatal subjects (N=20 SCZHR; N=40 controls), 45 subjects at 1year (N=15 SCZHR;
N=30 controls), and 60 subjects at 2years (N=20 SCZHR; N=40 controls) (Table 2.1B).
Cognitive Assessments
Cognitive development was assessed with the Mullen Scales of Early Learning,
which is composed of five independent Scales, each with a series of developmental
tasks to capture performance on five cognitive domains – Gross Motor, Visual
Reception, Fine Motor, Receptive Language, and Expressive Language
95. The Mullen
14
account for any sample drift or variability due to changes in test administrators during
the 10-year data collection period
96.
Neuroimaging Protocol
MRI Acquisition
.
Scans were acquired on 3T scanners during natural sleep
(Allegra and TIM Trio, Siemens Medical Solutions, Erlangen, Germany). Infants were
swaddled, fed, and fitted with ear protection before scanning. A structural T1-weighted
(T1w) fast low-angle shot sequence (N=10) was acquired on the Allegra scanner during
the initial phase of the study (FLASH, TR=15ms, TE=7.1ms, Flip Angel=7°, Spatial
Resolution=1x1mm², Slice thickness= 1mm). All other T1-weighted images acquired on
the Allegra (N=400) or TIM Trio (N=52) scanner used a 3-D magnetization prepared
rapid gradient echo sequence (MP-RAGE, TR=1820-1900ms, TE=3.78-4.38ms, flip
angle=7°, spatial resolution=1x1mm², slice thickness= 1mm). Proton density and
T2-weighted images (T2w) were acquired on the Allegra scanner using turbo spin-echo
sequences (TSE1, TR=7000ms, TE=406ms, flip angle=120°, spatial resolution=1.00,
1.00mm², slice thickness=11.00; TSE2, TR=5210-7590ms, TE1=20-21ms,
TE2=119-124ms, flip angle=150°, spatial resolution=1.25, 1.25mm², slice thickness=1.95). Proton
density and T2w images were also acquired on the Tim Trio scanner (TSE,
15
MRI Processing
. A standard protocol was followed for the processing of all
images
1,98,99. The cerebellum and brain stem were removed from all images. N4 based
bias correction was applied to all T1w and T2w images to correct intensity
inhomogeneity
100. T2w images were re-sampled to 1x1x1mm
3if necessary. T1w and
T2w images were used for the neonatal time point, and only T1w images were used for
the 1- and 2-year time points, as this provided the best tissue segmentation results at
the respective ages
101–103. Neonatal tissue segmentations classified brain tissue into
gray matter, nonmyelinated white matter, myelinated white matter and CSF using an
automatic, atlas-moderated expectation maximization segmentation tool
1. Similar to
the neonate tissue segmentation, tissue segmentation at ages 1 and 2 years was
accomplished with an automatic brain tissue segmentation tool that parcellates CSF,
gray and white matter. Lateral ventricles were traced using the semi-automated 3D
segmentation tool ITK SNAP, yielding 3D segmentations and volumetric outputs for all
ages
1. All images were assessed for quality and the presence of motion, utilizing a
four-scale quality rating system that was used to determine the suitability of MR images.
Each image was evaluated by two raters and given an average score. All images used
in this analysis passed motion quality control procedures. We found that there was no
significant correlation between being at risk for schizophrenia and having increased
motion artifacts in images at any of the three-time points when compared to controls
(Table 2.1A and 2.1B).
16
for surface reconstruction of the inner, middle and outer cortical surfaces
103. Surface
reconstruction involved topological corrections of the white matter surface for each
hemisphere. The corrected white matter was tessellated into a triangular surface mesh
that is deformed to obtain the inner, middle and outer surfaces. CT, the minimum
distance from the inner to middle surfaces, and SA, based on the middle cortical surface
located in the middle between the inner and outer surfaces, were obtained for each
region. For each subject, average CT, the mean of all regions, and total SA, the sum of
all regions, were calculated at each time point. Quality control was performed on the
surface reconstructions and included manual edits if necessary. Anatomical
parcellations were obtained using the Automated Anatomical Labeling atlas
104,
generating 78 cortical regions of interest (ROIs).
Statistical Analyses
Linear models were used to analyze the differences in the response variables,
i.e., global brain tissue volumes, CT, SA and Mullen ELC and scores on the individual
Mullen Scales between controls and SCZHR. The least square means, 95% confidence
intervals, percent difference, degrees of freedom, standard error, T-values, and
p-values were calculated for all analyses. The model controls for gestational age at birth,
maternal education, maternal ethnicity, and subject’s sex. As mentioned above, the date
of assessment was used as a covariate in Mullen analyses. Scanner and the T2-scan
acquisition types were also used as covariates in imaging analyses. Regional SA and
CT results were corrected for multiple comparisons using the Benjamini-Hochberg false
discovery rate (FDR) procedure
105. The significance level was set at an alpha of 0.05.
17
secondary analysis investigated possible sexual dimorphisms in the high-risk
developing brain by separating the subjects by sex.
Significant differences were seen between covariates including maternal
education and gestational age at birth and were controlled for in the main analysis
(Table 2.1). In an attempt to further reduce potential bias, we performed a secondary
analysis of Mullen scores, global tissue volumes, average CT and total SA using
propensity score matching. This method was used so that measured baseline
covariates were similar between the SCZHR and control groups resulting in a matched
cohort. Each SCZHR subject was matched to two controls based on gestational age at
birth, maternal education and maternal ethnicity using propensity scores. Some SCZHR
(N=5) were not matched due to large differences between maternal education when
compared to controls. Matching was performed by separating subjects by age within
each sex group. Linear model analyses were done with R, version 3.3.3 using the lm
function for linear models, Least-Squares Means and Estimated Marginal Means
packages
106,107. Propensity matching methods were performed using SAS 9.4.
Results
Cognitive Assessments
In the main analysis, SCZHR children had significantly lower ELC (cognitive
composite) scores at age 1 (t=3.1, df=113, p=0.003), and not quite significantly lower
scores at 2 years (t=1.8, df=101, p=0.07) compared to controls (Table 2.2A). At age 1
year, SCZHR had significantly lower Fine Motor (t=3.4, df=113, p=0.0008) and
Expressive Language (t=2.3, df=113, p=0.02) scores. At 2 years, there were no
18
although those two Scales generally were reduced in SCZHR subjects. Tests of
sex-specific effects show a similar low-scoring pattern was evident in both sexes (Table
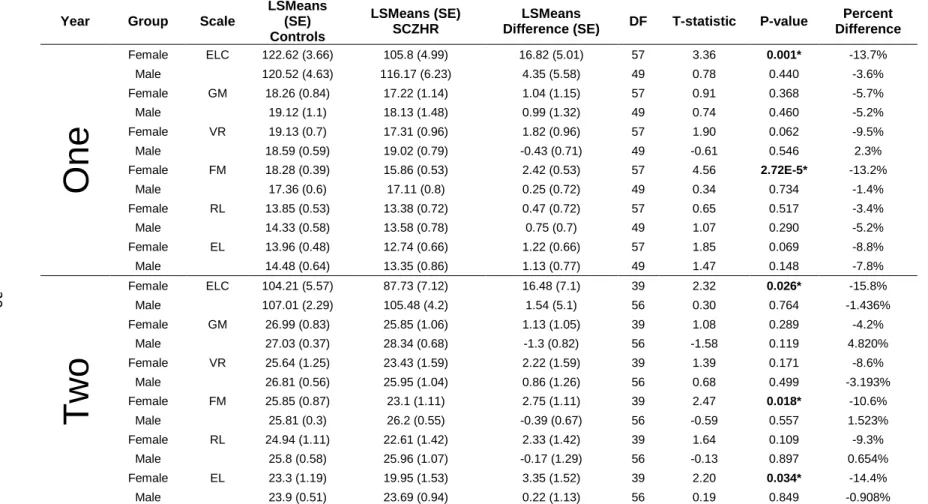
S2.1). SCZHR females had significantly lower ELC scores at age 1 (t=3.4, df=57,
p=0.001) and 2 years, (t=2.3, df=39, p=0.026), while SCZHR males had lower but not
significantly statistically different ELC scores. The matched cohort results were
consistent, with the overall SCZHR children having significantly lower ELC scores at
ages 1 (t=2.6, df=40, p=0.013) and 2 years (t=2.6, df=55, p=0.011) compared to
controls (Table 2.2B). At age 1, SCZHR infants had significantly lower Fine Motor
(t=2.7, df=40, p=0.009) and Expressive Language scores (t=2.1, df=40, p=0.04). At 2
years, SCZHR children had significantly lower Fine Motor scores (t=2.6, df=55,
p=0.042). SCZHR females had significantly lower ELC scores at age 1 (t=2.5, df=25,
p=0.019) and 2 years (t=2.8, df=23, p=0.009), while SCZHR males had non-significantly
lower ELC scores at ages 1 and 2 years (Table S2.2).
Global Brain Tissue Volumes
19
Cortical Thickness
Average CT was not significantly different in the SCZHR compared to controls in
the overall group or by sex in either analysis (Table S2.5). Regional CT differences
were observed, though most were not significant after FDR correction and there were
few consistencies in regional differences across ages. In the main analysis, male
neonates had 8 regions of significantly larger CT including 3 regions that survived FDR
corrections, two of which were also significant in male SCZHR at year one in the left
calcarine fissure (t=-3.3, df=24, p=0.003) and left lingual (t=-2.4, df=24, p=0.024)
(Figure 2.2). At 2 years, female SCZHR had 8 regions of larger CT; in these regions,
males tended to have non-significant smaller CT compared to controls. Males also had
two areas of significantly smaller CT.
Surface Area
20
Discussion
We found that SCZHR children had significant delays in cognitive development at
1 and 2 years of age. Concurrent with these cognitive development delays, SCZHR
children had some evidence of sex- and age-specific alterations in cortical structure.
These results are in line with previous studies that found delayed development in
children of parents with schizophrenia and provide further evidence that in very early
childhood, cortical gray matter development is altered in SCZHR children in a
sex-specific manner.
Studies of older children at risk for psychosis have demonstrated that deficits in
cognitive functioning are already present in late childhood and early adolescence
108–111.
Previous studies of infants at risk indicate that deficits in cognitive functioning, as well
as in motor development, are present very early in life
34,112. Mollon et al. (2018) found
that individuals with a psychotic disorder had a progressive decline in full-scale, verbal,
and nonverbal IQ from early childhood to 20 years
113, though no differences were seen
between controls and the psychotic disorder group at 18 months. This could be due to
differences in the cohort. Our study used an HR sample compared to the
population-based sample of Mollon et al. We found delayed development in the Mullen ELC score
at ages 1 and 2 years, confirming that cognitive delays are present very early in life in
children at familial risk for schizophrenia, and likely reflect the beginning of cognitive
deficits seen in patients. Maternal education is a significant predictor of Mullen
composite scores
96and SCZHR subjects in our sample had mothers with less
21
contributing to poor social and vocational functioning and reduced quality of life in
patients with schizophrenia
18,114. Because these cognitive deficits are present in early
childhood and appear to persist and progress through childhood, early intervention to
improve cognitive developmental trajectories would have the potential to enhance
longer-term outcomes.
We found evidence to indicate that alterations in cortical gray matter are present
in very early life in SCZHR. Gray matter volume and CT are smaller in patients with
schizophrenia across the cortex, especially in prefrontal regions. These volume
reductions are present in the prodromal, first episode and chronic stages, and tend to
progress over the course of the illness
13,16,115,116. Studies of cortical gray matter
reduction in adult unaffected siblings yield inconsistent results
117,118making it difficult to
definitively state that brain structure alterations are an endophenotype related to genetic
risk, at least in adults. However, cortical gray matter reductions have been
demonstrated in the premorbid period in those at familial high risk
119and in the siblings
of childhood-onset schizophrenia patients
120. Much of the underlying structural
architecture of the human brain is established before birth and during the first few years
of life
121. At birth, cortical gyrification patterns are adult-like
122,123. While there is
postnatal growth of CT, the overall trend of regional heterogeneity of CT observed in
adults is present at birth and is further refined in the first 2 years of life
124. In the first
year of life, there is rapid expansion of cortical gray matter of over 100%, and by age 2
years, average CT reflects about 97% of adult values
124. Thus, by age 2 years, much of
22
Furthermore, we found alterations in cortical gray matter appear to be
sex-specific. Over the first 2 years, there are few sex differences in CT or brain growth rates
124
, though males have about 5% larger ICV and global tissues volumes compared to
females at birth
42. We found male SCZHR neonates tended to have larger ICV and
CSF volume and non-significantly greater grey and white matter volumes, as well as
cortical SA. This general enlargement in male neonates appeared to persist at age
1year, though was not apparent at age 2years. Average CT was not significantly
different between the groups at any age, though there were regions of significantly
larger CT in neonatal male SCZHR, two of which were also significant in 1year old
SCZHR males. At age 2years, female SCHR had several regions of larger CT.
Interestingly, males had non-significantly smaller CT in these regions. Male
SCZHR had a trend for larger SA as neonates, consistent with overall larger brain size
seen in this group. SCZHR male neonates had 12 areas of significantly larger SA,
including two regions that were also significant at age 1 year. Overall, there is a
suggestion that male and female SCZHR have different patterns of cortical alterations in
infancy; both in CT and SA that deserve further study.
The results of this study are generally consistent with and extend our previous
studies in neonates in this cohort, which found greater gray matter volumes in male
SCZHR neonates
88,99, and regions of larger CT in neonatal males
125. SCZHR males
had larger brains at birth, although these male brains seemed to normalize by age 2
years. There is widespread sexual dimorphism in the neonatal brain with males having
larger ICV than females
126, and there is also evidence of neuroanatomical sex
23
status may be associated with sex-specific alterations of cortical gray matter. This
implicates prenatal and early childhood brain development as the origin of at least some
aspects of the structural brain abnormalities observed later in life in schizophrenia.
These cortical abnormalities also coincided with delays in early childhood cognitive
development in this cohort. Because of the relatively small sample size, we are not able
to perform meaningful longitudinal analyses, nor can we study structure-cognition
relationships.
Mothers with schizophrenia tend to experience more pregnancy and perinatal
complications and are more likely to take antipsychotics, smoke cigarettes and use illicit
substances, all of which can impact the developing fetal brain
79,80,128–131. These
non-specific factors of having a serious mental illness during pregnancy could contribute to
our findings, and it is difficult to separate their influence from that of genetic risk. To try
to minimize the differences between the two groups, we used a propensity score
matching method. Similar deficits were seen in the main and secondary analyses in
cognitive development at ages 1 and 2 years in spite of the reduced sample size of the
matched control analysis.
Limitations
24
age-related imaging findings. As noted above, non-specific prenatal and perinatal
environmental factors may also add to our findings. Also, various aspects of the
postnatal environment, including parenting, was not assessed in detail.
Conclusions
In the context of its limitations, this study nevertheless demonstrates that
alterations of cognitive development are present in very early childhood in individuals at
genetic risk for schizophrenia and provides evidence that brain structure is also altered
in male neonates at such risk. Very early childhood is the next frontier of study for
understanding schizophrenia and other psychiatric disorders. While much effort is
currently focused on adolescence and the prodromal period of schizophrenia
132,
identifying at-risk individuals early in childhood may offer the potential to intervene at a
much earlier point in brain development, opening the possibility for more effectively
mitigating behavioral and cognitive deficits and other endophenotypes
133associated
25
Table 2.1 Continuous and Categorical Variables for mothers with schizophrenia and control mothers
A. SCZHR and Control demographic variables for the large control group
Continuous Variables presented as number of subjects N, Mean (SD)
Demographic Controls SCZHR P-Value
Maternal Age at Birth (Years) 268, 29.1(5.0) 41, 27.1(5.7) 0.013*
Mother Education at Birth (Years) 268, 15.9(3.1) 41, 10.3(3.1) 3.2E-15*
Total Household Income at Birth 253, $77 498($102 336.9) 29, $18 489(144 78) 1.6E-15*
Gestational Age at Birth (Days) 268, 274.9(11.5) 41, 264.5(18.6) 0.001*
Birth Weight (Grams) 268, 3375.7(730.6) 41, 3303.6(474.4) 0.001
Age at MRI (Days)
Neonates 210, 21.5(9.2) 21, 34.1(14.4) 7.9E-04*
One Year 98, 386.1(24.9) 24, 394.9(34.1) 0.243
Two Year 86, 747.4(26.2) 24, 772.0(37.8) 0.006*
Average Motion Scores
Neonates (T2-W) 210, 2.55(0.72) 21, 2.69(0.72) 0.535
One Year (T1-W) 98, 2.38(0.55) 24, 2.42(0.65) 0.209
Two Year (T1-W) 86, 2.33(0.48) 24, 2.27(0.68) 0.205
Categorical Variables presented as number (N) and percentage (%)
Sex (male/female) (136/132) (50.7%/49.3%) (19/22) (46.3%/53.7%) 0.605
Maternal Ethnicity: Asian/Black/White (7/41/220) (2.6%/15.3%/82.1%) (1/26/14) (2.4%/63.4%/34.1%) 2.6E-11*
Medications No/Yes (209/59) (78.0%/22.0%) (5/36) (12.2%/87.8%) <2.2E-16*
Antipsychotic Medication No/Yes (266/2) (99.3%/0.7%) (9/32) (22.0%/78.0%) <2.2E-16*
Smoking No/Yes (254/14) (94.8%/5.2%) (27/14) (65.9%/35.7%) 1.1E-8*
Alcohol No/Yes (258/10) (96.3%/3.7%) (40/1) (97.6%/2.4%) 1
Drug Use No/Yes (263/5) (98.1%/1.9%) (37/4) (90.2%/9.8%) 0.02*
Scanner: Allegra/Trio
Neonates (181/29) (86.2%/13.8%) (21/0) (100%/0%) 0.14
One Year (88/10) (89.8%/10.2%) (21/3) (87.5%/12.5%) 1
26
B. SCZHR and Control demographic variables for the Propensity Matching Sample Continuous Variables presented as number of subjects N, Mean (SD)
Demographic Controls SCZHR P-Value
Maternal Age at Birth (Years) 87, 28.2(5.1) 36, 27.5(6.1) 0.539
Mother Education at Birth (Years) 87, 14.1(2.7) 36, 10.2(3.3) 4.8E-8*
Total Household Income at Birth 78, $52 786.92($40 381.49) 28, $21 432.07(19 880.44) 7.7E-7*
Gestational Age at Birth (Days) 87, 268.5(14.0) 36, 268.71(15.3) 0.89
Birth Weight (Grams) 87, 3211(601.8) 36, 3121.5(661.2) 0.49
Age at MRI (Days)
Neonates 40, 25.3(12.4) 20, 34.2(16.5) 0.044*
One Year 30, 384.9(21.2) 15, 392.2(35.8) 0.48
Two Year 40, 749.1(31.1) 20, 766.5(38.3) 0.088
Average Motion Scores
Neonates (T2-W) 40, 2.6(0.62) 20,2.73(0.73) 0.217
One Year (T1-W) 30, 2.42(0.62) 15, 2.47(0.55) 0.421
Two Year (T1-W) 40, 2.33(0.45) 20, 2.3(0.73) 0.122
Categorical Variables presented as number (N) and percentage (%)
Sex (male/female) (44/43) (50.6%/49.4%) (17/19) 47.2%/52.8%) 0.739
Maternal Ethnicity: Asian/Black/White (2/20/65) (2.3%/23.0%/74.7%) (1/22/13) (2.8%/61.1%/36.1%) 2.2E-4*
Medications No/Yes (62/25) (71.3%/28.7%) (6/30) (16.7%/83.3%) 9.2E-8*
Antipsychotic Medication No/Yes (87/0) (100%/0%) (10/26) (27.8%/72.2%) <2.2E-16*
Smoking No/Yes (81/6) (93.1%/6.9%) (25/11) (69.4%/30.6%) 0.015*
Alcohol No/Yes (86/1) (99.9%/1.1%) (36/0) (100%/0%) 1
Drug Use No/Yes (86/1) (98.9%/1.1%) (33/3) (91.7%/8.3%) 0.138
Scanner: Allegra/Trio
Neonates (39/1) (97.5%/2.5%) (20/0) (100%/0%) 1
One Year (28/2) (93.3%/6.7%) (14/1) (93.3%/6.7%) 1
27
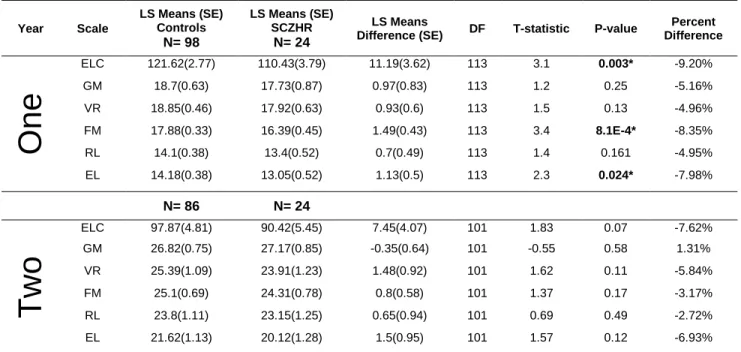
Table 2.2. Comparison of Mullen ELC and Scales in SCZHR Infants and Typically Developing Controls
A. SCZHR vs Control Infants Main Analysis- Mullen Scales
Year Scale
LS Means (SE) Controls
N= 98
LS Means (SE) SCZHR
N= 24
LS Means
Difference (SE) DF T-statistic P-value
Percent Difference
One
ELC 121.62(2.77) 110.43(3.79) 11.19(3.62) 113 3.1 0.003* -9.20% GM 18.7(0.63) 17.73(0.87) 0.97(0.83) 113 1.2 0.25 -5.16%
VR 18.85(0.46) 17.92(0.63) 0.93(0.6) 113 1.5 0.13 -4.96%
FM 17.88(0.33) 16.39(0.45) 1.49(0.43) 113 3.4 8.1E-4* -8.35% RL 14.1(0.38) 13.4(0.52) 0.7(0.49) 113 1.4 0.161 -4.95%
EL 14.18(0.38) 13.05(0.52) 1.13(0.5) 113 2.3 0.024* -7.98%
N= 86 N= 24
Two
ELC 97.87(4.81) 90.42(5.45) 7.45(4.07) 101 1.83 0.07 -7.62%
GM 26.82(0.75) 27.17(0.85) -0.35(0.64) 101 -0.55 0.58 1.31%
VR 25.39(1.09) 23.91(1.23) 1.48(0.92) 101 1.62 0.11 -5.84%
FM 25.1(0.69) 24.31(0.78) 0.8(0.58) 101 1.37 0.17 -3.17%
RL 23.8(1.11) 23.15(1.25) 0.65(0.94) 101 0.69 0.49 -2.72%
EL 21.62(1.13) 20.12(1.28) 1.5(0.95) 101 1.57 0.12 -6.93%
B. SCZHR vs Control Infants Secondary Analysis Propensity Matching- Mullen Scales
Year Scale
LS Means (SE) Control
N= 30
LS Means (SE) SCZHR
N= 15
LS Means
Difference (SE) DF T-statistic P-value
Percent Difference
One
ELC 116.75(2.86) 113.2(17.6) 102.41(4.21) 40 2.6 0.013* -12.28% GM 18(0.63) 18.7(4.3) 16.74(0.93) 40 1.03 0.307 -6.97%
VR 17.75(0.5) 18.1(3.2) 16.16(0.73) 40 1.68 0.101 -8.97%
FM 17.75(0.31) 16.7(2.1) 16.15(0.45) 40 2.73 0.009* -9.05% RL 13.54(0.32) 13.6(2.7) 13.29(0.47) 40 0.4 0.694 -1.80%
EL 14.33(0.35) 13.4(2.4) 12.9(0.52) 40 2.12 0.04* -9.99%
N=40 N=20
Two
ELC 108.54(2.22) 97.25(3.29) 11.29(4.3) 55 2.63 0.01* -10.04% GM 26.6(0.42) 26.61(0.63) -0.01(0.82) 56 -0.02 0.99 0.05%
VR 26.77(0.58) 24.96(0.87) 1.8(1.13) 56 1.59 0.12 -6.73%
FM 26.15(0.32) 24.85(0.48) 1.3(0.62) 56 2.08 0.04* -4.96% RL 25.45(0.65) 24.7(0.99) 0.75(1.28) 56 0.59 0.56 -2.96%
EL 24.02(0.6) 22.32(0.9) 1.7(1.17) 56 1.44 0.15 -7.06% A- Large Population, B- Propensity Matching Sample * represents p-value ≤ 0.05, ELC- Early Learning Composite, GM- gross motor, VR- visual reception, FM- fine motor, RL- receptive language, EL- expressive language; SE- standard error; DF- degrees of freedom
28
29
Figure 2.2 Significant regional differences in surface area in male SCZHR neonates when compared to Controls. Red represents larger CT relative to controls. Plus sign: significant after FDR correction.
30
Table S2.1 SCZHR vs Control Infants Main Analysis at One and Two Years-Mullen Scales of Early Learning
Year Group Scale
LSMeans (SE) Controls LSMeans (SE) SCZHR LSMeans
Difference (SE) DF T-statistic P-value
Percent Difference
One
Female ELC 122.62 (3.66) 105.8 (4.99) 16.82 (5.01) 57 3.36 0.001* -13.7% Male 120.52 (4.63) 116.17 (6.23) 4.35 (5.58) 49 0.78 0.440 -3.6%
Female GM 18.26 (0.84) 17.22 (1.14) 1.04 (1.15) 57 0.91 0.368 -5.7%
Male 19.12 (1.1) 18.13 (1.48) 0.99 (1.32) 49 0.74 0.460 -5.2%
Female VR 19.13 (0.7) 17.31 (0.96) 1.82 (0.96) 57 1.90 0.062 -9.5%
Male 18.59 (0.59) 19.02 (0.79) -0.43 (0.71) 49 -0.61 0.546 2.3%
Female FM 18.28 (0.39) 15.86 (0.53) 2.42 (0.53) 57 4.56 2.72E-5* -13.2%
Male 17.36 (0.6) 17.11 (0.8) 0.25 (0.72) 49 0.34 0.734 -1.4%
Female RL 13.85 (0.53) 13.38 (0.72) 0.47 (0.72) 57 0.65 0.517 -3.4%
Male 14.33 (0.58) 13.58 (0.78) 0.75 (0.7) 49 1.07 0.290 -5.2%
Female EL 13.96 (0.48) 12.74 (0.66) 1.22 (0.66) 57 1.85 0.069 -8.8%
Male 14.48 (0.64) 13.35 (0.86) 1.13 (0.77) 49 1.47 0.148 -7.8%
Tw
o
Female ELC 104.21 (5.57) 87.73 (7.12) 16.48 (7.1) 39 2.32 0.026* -15.8%
Male 107.01 (2.29) 105.48 (4.2) 1.54 (5.1) 56 0.30 0.764 -1.436%
Female GM 26.99 (0.83) 25.85 (1.06) 1.13 (1.05) 39 1.08 0.289 -4.2%
Male 27.03 (0.37) 28.34 (0.68) -1.3 (0.82) 56 -1.58 0.119 4.820%
Female VR 25.64 (1.25) 23.43 (1.59) 2.22 (1.59) 39 1.39 0.171 -8.6%
Male 26.81 (0.56) 25.95 (1.04) 0.86 (1.26) 56 0.68 0.499 -3.193%
Female FM 25.85 (0.87) 23.1 (1.11) 2.75 (1.11) 39 2.47 0.018* -10.6%
Male 25.81 (0.3) 26.2 (0.55) -0.39 (0.67) 56 -0.59 0.557 1.523%
Female RL 24.94 (1.11) 22.61 (1.42) 2.33 (1.42) 39 1.64 0.109 -9.3%
Male 25.8 (0.58) 25.96 (1.07) -0.17 (1.29) 56 -0.13 0.897 0.654%
Female EL 23.3 (1.19) 19.95 (1.53) 3.35 (1.52) 39 2.20 0.034* -14.4%
Male 23.9 (0.51) 23.69 (0.94) 0.22 (1.13) 56 0.19 0.849 -0.908%
31
Table S2.2 SCZHR vs Control Infants Secondary Analysis Propensity Matching Sample at One and Two Years-Mullen Scales of Early Learning
Year Group Scale LSMeans (SE)
Controls
LSMeans (SE) SCZHR
LSMeans Difference
(SE)
DF T-statistic P-value Percent
Difference
One
Female ELC 117.98 (3.46) 101.53 (5.03) 16.45 (6.56) 25 2.51 0.019* -13.9% Male 114.72 (5.31) 103.57 (8.08) 11.15 (10.56) 11 1.060 0.313 -9.7%
Female GM 18.28 (0.82) 16.86 (1.19) 1.42 (1.55) 25 0.91 0.370 -7.7%
Male 17.44 (1.12) 16.52 (1.7) 0.92 (2.22) 11 0.410 0.686 -5.3%
Female VR 17.89 (0.69) 15.91 (1.01) 1.98 (1.32) 25 1.51 0.144 -11.1%
Male 17.42 (0.67) 16.77 (1.01) 0.65 (1.32) 11 0.490 0.634 -3.7%
Female FM 18.16 (0.34) 15.39 (0.49) 2.78 (0.64) 25 4.34 2.1E-5* -15.3% Male 16.96 (0.51) 17.69 (0.78) -0.73 (1.02) 11 -0.720 0.488 4.3%
Female RL 13.67 (0.4) 13.12 (0.58) 0.56 (0.76) 25 0.73 0.470 -4.1%
Male 13.21 (0.61) 13.77 (0.93) -0.56 (1.22) 11 -0.460 0.656 4.2%
Female EL 14.43 (0.36) 12.58 (0.52) 1.85 (0.68) 25 2.71 0.012* -12.8% Male 14.05 (0.81) 13.71 (1.24) 0.34 (1.61) 11 0.210 0.839 -2.4%
Tw
o
Female ELC 112.49 (3.65) 90.68 (5.76) 21.81 (7.71) 23 2.830 0.009* -19.4% Male 106.88 (2.2) 99.32 (3.15) 7.56 (4.04) 29 1.870 0.072 -7.073%
Female GM 26.66 (0.68) 25.69 (1.07) 0.97 (1.43) 23 0.680 0.502 -3.6%
Male 26.63 (0.55) 27.2 (0.81) -0.57 (1.04) 29 -0.550 0.587 2.137%
Female VR 26.56 (0.85) 23.78 (1.34) 2.78 (1.79) 23 1.550 0.134 -10.5%
Male 27.17 (0.77) 25.48 (1.13) 1.68 (1.44) 29 1.170 0.252 -6.201%
Female FM 26.62 (0.54) 23.32 (0.86) 3.3 (1.15) 23 2.880 0.008* -12.4% Male 26.02 (0.35) 25.59 (0.51) 0.43 (0.65) 29 0.660 0.514 -1.661%
Female RL 26.66 (0.79) 23.69 (1.24) 2.97 (1.66) 23 1.790 0.087 -11.1%
Male 24.87 (0.96) 24.72 (1.42) 0.14 (1.8) 29 0.080 0.937 -0.577%
Female EL 25.43 (0.88) 20.91 (1.39) 4.53 (1.86) 23 2.440 0.023* -17.8% Male 23.19 (0.78) 22.81 (1.15) 0.37 (1.47) 29 0.260 0.800 -1.613%
32
Table S2.3 SCZHR vs Control Infants Main Analysis at Birth, Year One and Year Two- Brain Tissue Volumes (mm³)
Year Group Brain Region LSMeans (SE)
Controls LSMeans (SE) SCZHR
LSMeans Difference
(SE) DF
T-statistic P-value
Percent Difference
Ne
o
natal
Overall ICV 469593.64 (13865.56) 484128.44 (18332.36) -14534.81 (13804.44) 221 -1.05 0.294 3.10%
Female 475303.46 (14758.58) 459680.45 (21195.75) 15623.01 (17927.38) 113 0.87 0.385 -3.29%
Male 482767.68 (9878.15) 524752.4 (21428.48) -41984.72 (21360.06) 101 -1.97 0.052 8.697%
Overall GM 237011.64 (6897.9) 243798.77 (9120.07) -6787.13 (6867.5) 221 -0.99 0.324 2.86%
Female 240028.61 (6949.49) 233478.39 (9980.6) 6550.22 (8441.6) 113 0.78 0.439 -2.73%
Male 243078.91 (5147.1) 260968.45 (11165.51) -17889.54 (11129.86) 101 -1.61 0.111 7.360%
Overall WM 172138.94 (5086.34) 177648.39 (6724.91) -5509.45 (5063.92) 221 -1.09 0.278 3.20%
Female 173610.7 (5659.02) 169664.83 (8127.28) 3945.87 (6874.06) 113 0.57 0.567 -2.27%
Male 178534.17 (3544.39) 192255.64 (7688.78) -13721.47 (7664.23) 101 -1.79 0.076 7.686%
Overall CSF 60443.06 (3236.33) 62681.29 (4278.91) -2238.22 (3222.06) 221 -0.69 0.488 3.70%
Female 61664.15 (3560.73) 56537.23 (5113.79) 5126.92 (4325.24) 113 1.19 0.238 -8.31%
Male 61154.6 (2227) 71528.31 (4830.99) -10373.71 (4815.57) 101 -2.15 0.034* 16.963% Overall Total Vent 4196 (447.11) 4737.51 (591.15) -541.51 (445.14) 221 -1.22 0.225 12.91%
Female 4448.21 (470.23) 4310.34 (675.33) 137.88 (571.2) 113 0.24 0.81 -3.10%
Male 4388.61 (328.17) 5643.36 (711.9) -1254.75 (709.63) 101 -1.77 0.080 28.591%
Overall Avg CT (mm) 1.88 (0.02) 1.9 (0.02) -0.02 (0.02) 221 -1.01 0.315 0.93%
Female 1.9 (0.02) 1.89 (0.03) 0 (0.02) 113 0.19 0.851 -0.23%
Male 1.89 (0.01) 1.92 (0.03) -0.04 (0.03) 101 -1.32 0.190 1.886%
Overall Total SA (mm²) 79318.38 (2258.42) 81424.33 (2985.97) -2105.95 (2248.46) 221 -0.9400 0.350 2.66%
Female 80285.18 (2423.26) 78037.61 (3480.19) 2247.57 (2943.55) 113 0.76 0.4470 -2.80%
Male 82150.18 (1600.14) 88150.37 (3435.11) -6019.14 (3460.07) 101 -1.74 0.085 7.33%
One
Overall ICV 899731.98 (23859.49) 935794.87 (29075.12) -36062.89 (27136.79) 113 -1.33 0.190 4.01%
Female 887393.12 (25381.88) 904087.82 (30936.37) -16694.7 (30908.12) 58 -0.54 0.591 1.88%
Male 892827.24 (46697.02) 960199.15 (54930) -67371.91 (48320.44) 49 -1.39 0.170 7.55%
Overall GM 618442.91 (14949.28) 640882.27 (18217.15) -22439.36 (17002.68) 113 -1.32 0.190 3.63%
Female 611062.28 (16329.85) 621289.27 (19903.42) -10226.99 (19885.24) 58 -0.51 0.609 1.67%
Male 614272.71 (28976.08) 655429.82 (34084.75) -41157.1 (29983.44) 49 -1.37 0.176 6.70%