Race, Social Class, and Parental Involvement with Children’s Cognitive Development
Jeremy Pienik
A thesis submitted to the faculty of the University of North Carolina at Chapel Hill in partial fulfillment of the requirements for the degree of Master of Arts in the Department of
Sociology
Chapel Hill 2008
Approved by: Michael J. Shanahan
ii ABSTRACT
JEREMY PIENIK: Race, Social Class, and Parental Involvement with Children’s Cognitive Development
(Under the direction of Michael J. Shanahan)
iii
TABLE OF CONTENTS
LIST OF TABLES...v
Chapter I. INTRODUCTION...1
Race, Class, and Parental Involvement with Schools ...3
Race, Class, and Parental Involvement at Home ………..9
Summary .………14
II. METHODS ……….16
Data ……….16
Measures ……….17
Analytical Strategy ………..25
III. RESULTS ………...28
Racial Differences in Indicators of Socioeconomic Status and Parental Involvement ………28
iv
Race and Social Class Interactions in the Prediction of Home and School Involvement……….33 Race and Disaggregated Social Class Differences in Parental Involvement...35
IV. CONCLUSIONS AND DISCUSSION ………..42
v
LIST OF TABLES
Table
1. Bivariate Relationships, Race and Social Class, and Control Variables, Panel Study of Income Dynamics, Childhood Developmental Supplement: 1997 & 2001,
(N=2,428) ...50 2a. Relationships between Social Class/Race and Parental Formal & Informal
Communication with Their Children’s Schools, Panel Study of Income Dynamics, Childhood Development Supplement: 1997 & 2001 (unstandardized coefficients/ standard errors reported)...………...52 2b. Relationships between Social Class/Race and Educational Resources, Skill
Involvement, and Verbal Stimulation , Panel Study of Income Dynamics, Childhood Development Supplement: 1997 & 2001 (unstandardized coefficients/ standard errors reported)………...53 3. Moderating Effects of Race on the Relationship between Social Class and
Parenting Practices, Panel Study of Income Dynamics, Childhood Development Supplement: 1997 & 2001 (multiple group structural equation estimates,
unstandardized coefficients/ standard errors reported) ...55 4a. Relationships between Disaggregated Measures of Social Class/Race and Parental Formal & Informal Communication with Their Children’s Schools, Panel Study of Income Dynamics, Childhood Development Supplement: 1997 & 2001
(unstandardized coefficients/ standard errors reported)………...56 4b. Relationships between Disaggregated Measures of Social Class/Race and
Educational Resources, Skill Involvement, and Verbal Stimulation , Panel Study of Income Dynamics, Childhood Development Supplement: 1997 & 2001
(unstandardized coefficients/ standard errors reported) ………...58 5. Moderating Effects of Race on the Relationship between Disaggregated Measures of Social Class and Parenting Practices, Panel Study of Income Dynamics, Childhood Development Supplement: 1997 & 2001 (multiple group structural equation
CHAPTER I INTRODUCTION
Social class and racial differences in parenting values and practices have long been of interest to social scientists and policy-makers because such differences are thought to
contribute to the reproduction of inequality (Dubois 1908; Frazier; Moynihan 1965; Coleman 1968; Kohn 1976; Lareau 2000). A central assumption of the Wisconsin model of status attainment (Sewell & Shah 1968; Sewell et al 1976), Bourdieu’s (1981) theory of social reproduction, Kohn’s (1959; 1977) ‘class and conformity’ hypothesis, Ogbu’s (2003) culture of opposition theory, and, most recently, Lareau’s (2003) model of the continuity of class advantages, is that differences in parental involvement with their children’s schooling and/or with their children at home contribute to intergenerational continuity in educational and occupational achievements. Further, well-known programs such as Head Start and Early Head Start are premised on the belief that lower-classes and minority children, when
compared to White, middle-class children, are disadvantaged in the home and, consequently, in need of supplemental cognitive stimulation.
2
Black parents failed to take as active a role as White parents in fostering their children’s intellectual growth at home or at school. Lareau and Horvat’s (1999) ethnographic study lends support to Ogbu’s findings of lower involvement among Black parents, as compared to Whites, regardless of class. They found that even within the middle class, schools were often mistrusted by Black parents and viewed as less approachable. This was especially true in schools that had a history of resistance to desegregation and among parents who maintained memories of segregation (Lareau & Horvat 1999).
Not all scholars, however, agree that race exerts an effect on parenting independent of social class. Lareau’s research distinguished between parental involvement in schooling and in their children’s educational development at home, concurring with Ogbu’s research with respect to the former, but finding no independent effect of race on the latter. Moreover, in examining both “parent-initiated” contact with schools and participation in “parent teacher-organizations at the school” among White and minority parents, Kerbo & Berrhardt (1993) found that Blacks are actually more involved with their children’s schools than Whites with similar socioeconomic backgrounds and familial characteristics.
3
research, this paper contributes to these debates with quantitative findings. I begin, however, with theoretical considerations, examining research on racial and class differences in parental involvement in schools and in their children’s cognitive development at home.
Race, Class, and Parental Involvement with Schools
A number of researchers have found connections between socioeconomic status and various forms of parental involvement with their children’s school (Baker & Stevenson 1986; Stevenson &Baker 1987; Steinberg et al. 1992 Useem 1992; Kerbo & Berrhardt 1993;
Hoover-Dempsey 1997; McNeal 1999; Crosnoe 2001). For example, in a study using data from the National Educational Longitudinal Survey (NELS), Sui-Chu & Wilms (1996) established that connections exist between social class and involvement. Specifically, socioeconomic status, operationalized using “a composite of five variables denoting family income and mother’s and father’s education and occupation,” predicted both school
participation, which includes proactive activities that parents initiate (e.g., PTO meetings, attending school events, volunteering at the school etc.) and school communication, a comparatively reactive form of involvement that encompasses such things as meeting with teachers and other school officials, often in response to problems that the child is having.
4
within the lower classes, many have equated the culture of poverty—typically characterized by such traits as fatalism, toughness, street smarts, and a quest for excitement—with Blacks. Reacting to such ideas, scholars such as Lightfoot (1978) and Connell and his colleagues (1982) shifted attention from parents and towards educators who, they claimed, favor middle-class parents. These researchers suggested that, in general, schools court relationships with middle-class parents while ignoring minorities and families from the lower classes.
Accordingly, lower-class and minority parents disengage from their children’s education. Lareau (2000), however, found little support for the devaluation of education by, or overt class discrimination of, lower-class parents: “Values alone cannot account for all the variation observed between the upper-middle-class and working-class, nor can the
differences in family-school relationships be attributed to the educational institutions alone” (p. 170). Instead, Lareau suggests a number of other pragmatic and cultural differences between working-class/poor parents and middle-class parents thatexplain their differential involvement. Pragmatic differences encompass mundane, yet important, class variations in childcare, transportation, and simply being able to schedule time from work to attend school meetings. Lareau (2000; 2003) observed that working-class and poor parents were less likely to own cars and often experienced difficulty finding quality childcare that they could afford. And while middle-class parents were surely busy, the greater occupational flexibility and power they had allowed them to meet the expectations of educators to a far greater degree than those parents who lacked such advantages (Lareau 2000).
5
informal school communication. Informal school communication refers to parental interaction and contact with school officials that is not within the purview of “official
communications” about the student’s progress. Such encounters with schools generally occur on a strictly voluntary basis and typically reflect a proactive style of parenting. Formal school communication, on the other hand, can be defined as parental interaction with school
officials in structured, official meetings. Examples of formal school communication include conferences with teachers, counselors, and principals. Such meetings are often school-initiated (due to intellectual and behavioral problems that students may be having) and, therefore, more likely to reflect “reactive” parenting.
Lareau (2000) consistently observed that social class strongly predicted the expectations that parents held concerning how they should participate in their children’s schooling (i.e., informal school communications). According to her observations, a “concerted cultivation” schema, typical of middle class parenting, emphasizes proactive involvement in a child’s education and growth. Parents adhering to this ideology are active with their children’s school, requesting teachers and attending meetings of local Parent-Teacher Organizations. Thus, middle-class parents are inclined to take a “hands-on,” proactive approach to their children’s education, frequently monitoring their progress and intervening when necessary.
6
working classes conceive of the school and the family as “separate spheres” and are quick to relinquish responsibility for educating their children to professionals, the middle-class generally sees the realms of family and school as “interconnected.”
Furthermore, Lareau observed that different social classes had varying amounts of “cultural capital” at their disposal. Since schools and teachers tend to be heavily influenced by, and representative of, middle-class culture, a status “gulf” often developed between teachers and working-class and poor parents. Schools are, therefore, viewed as more intimidating and less approachable by those families outside the middle-class who do not have a level of social standing comparable to that of educators. For example, Lareau (2000; 2003) reported that while middle-class parents feel comfortable criticizing schools if they disagree with the curriculum or a specific procedure or if they think that the teachers are not performing satisfactorily, working-class and poor parents lack the skills and resources necessary to participate successfully in their children’s schooling. Those parents who had only a high school education or less were confused by the jargon-filled language that teachers used concerning such things as instructional techniques and diagnostic tests.
Based upon the work of Lareau (2000; 2003) and other research (Stevenson & Baker 1987; Useem 1992; Muller 1995, 1998; Sui-Chu & Willms 1996; Crosnoe 2001), I
7
that this association can be partially explained in terms of the parents’ education. In addition, considering Lareau’s emphasis on status differences between teachers and lower class
parents, I expect that income and occupation will also explain some of the association between class and involvement such that parents will be less involved with decreasing income and occupational prestige.
The pioneering research of Kohn (1959; 1977) also suggests the central importance of occupational prestige. Kohn argued that middle-class parents generally hold jobs that offer, indeed require, considerably more autonomy, self-direction, and use of cognitive skills than the typical jobs of working-class and poor parents. In contrast, working-class parents are expected to be obedient and conform to the expectations of managers and supervisors in workplace. Kohn observed that working class parents generalized these experiences to the home, expecting obedience and conformity in their children. By extension, it may be that poor and working class parents defer to the judgments of teachers and principals and are less likely to proactively manage their children’s experiences at school than are middle class parents.
In addition to class effects, Lareau and Horvat (1999) maintain that Black parents are less involved with schools than are White parents. Specifically, they claim that the
8
Ogbu’s (2003) study of the achievement gap in the schools of Shaker Heights, Ohio also points to less parental involvement of middle-class Blacks living in that community when compared to their middle-class White counterparts. Among those Black students and parents he interviewed and observed, a number of explanations for these Black-White differences were repeated, including the long hours that many Black parents had to work in order to afford to live in such a community, feelings of ‘alienation’ from schools, and a mistrust of schools which are perceived by some Blacks as dominated by privileged Whites. Furthermore, Ogbu found that Blacks in the community were influenced by a cultural model of education that placed responsibility for educating and motivating children almost entirely on teachers and not on parents. According to Ogbu (2003), this cultural trait of removing responsibility from themselves and relying exclusively on schools to develop their children’s cognitive skills played an important role in explaining the dearth of Black parental
involvement in Shaker Heights’ schools.
Lareau and Ogbu’s qualitative studies, however, have not been entirely supported by quantitative research. Using data from National Educational Longitudinal Survey, Kerbo & Berhhardt (1993), Muller & Kerbo (1993), and Ho Sui-Chu & Willms (1996) have found that, when class is controlled, Black parents are at least as involved as White parents. Similarly, Crosnoe (2001) found that among about 700 students sampled from six high schools in California and Wisconsin, Black and White parents were indistinguishable along several dimensions of parental involvement including knowledge of child’s school
9
White counterparts. Employing a smaller, local sample Hill (2001) and Hill & Craft (2001) matched 103 economically similar White and Black parents with children in a North Carolina kindergarten. They found that, for most measures of involvement, Black and White parents exhibited very similar levels of participation in their children’s education. Given these
findings, further empirical study of the relationship between race and parental involvement in schools is warranted.
An examination of the independent effect of race on school involvement should also attend to the possibility of an interactive effect involving race and social class. While poor Whites need only be concerned about potential class biases of teachers and principals, poor Blacks are faced with the possibility of discrimination and prejudice based upon class (i.e., most likely, education) and race. Therefore, I expect that the predicted positive relationship between education and school involvement will not be as strong for Black parents when compared to White parents.
Race, Class, and Parental Involvement at Home
10
school can be attributed to the summer “setbacks” that working-class and poor children experience. Such setbacks reflect the fact that working class homes fail to stimulate them as much when school is out of session when compared to middle and upper class homes (see also Cooper et al. 1996, Burkam et al. 2004). Middle class homes tend, at a minimum, to encourage the retention of skills learned during the school year and, in many instances, actually enhance educational progress during summer breaks.
Recent findings from the Early Childhood Longitudinal Study (Rathburn, West, & Hausken 2004), a nationally representative sample of over 20,000 children starting at age four and following them through the third grade, further supports the contention that while children from all races and classes tend to learn about the same amount in any given school year, children from lower-class and Black homes generally begin each school year (starting in Kindergarten) with less knowledge. This is likely attributable to the amount of cognitive stimulation children are exposed to in their homes. For example, Hart & Risley (1992; 1995; 1999) found marked class-based differences in both the quality and quantity of parent-child interactions: children reared in middle-class families were not only exposed to more words in a given period of time, but also a much larger variety of words than their poor and working-class counterparts, a difference thought to reflect the larger vocabulary of their parents. These variations in exposure to language led to significant differences in the children’s scores on tests of language ability.
Lareau (2003) emphasizes multiple facets of parental involvement within the home that may ultimately provide an advantage in terms of school performance and status
11
spend interacting with them in cognitively stimulating ways. According to her observations, all these dimensions of parenting vary significantly across social classes, consistent with her distinction between “concerted cultivation” and “natural growth” models. She observed that concerted cultivation parents attempt to turn the entire world into a classroom in order to increase various talents, skills, and abilities of their children. Pianos, encyclopedias, and the latest computers are characteristically found in the homes of these middle class families, and parents push their children to use them at every opportunity. Furthermore, Lareau (2000; 2003) observed middle-class parents spending significantly more time probing their children about their experiences at school and at the many other activities that they make sure their children are involved with. Despite the sacrifices that such types of intensive child rearing require, Lareau (2000; 2003) finds that middle-class parents in contemporary America feel obligated to provide such opportunities to their children. In turn, children of such parents acquire a number of “invisible advantages,” including larger vocabularies, more confident interactions with adults, feelings of comfort in a variety of institutional settings, and, among other things, the ability to persist in structured and competitive tasks.
In contrast, “natural growth parents” believe in a comparatively “hands off”
12
will be more involved with their children’s cognitive development at home than poor and working class parents.
While the sorts of skills-sets that middle-class professionals possess are likely to impact certain realms of child-rearing, the greater income that they bring home is likely to impact the sorts of material resources they can provide their children. This is a major tenant of the financial capital model of childhood development (Guo & Harris 2000). Such
resources may lead to important advantages for those children raised in homes with parents who are able to command a relatively high salary.
In fact, some scholars have reported that differences in material cultural capital that exist among social classes may be an important factor in explaining the class-based
achievement gap. For instance, access to computers, musical instruments, encyclopedias, books, and other educational resources is significantly more likely in middle-class homes (DiMaggio 1982; Roscigno & Ainsworth-Darnell 1999). Among the most widely used measures in studies of the home environment, Bradley’s Home scale includes questions concerning the amount of access a child has to cognitively stimulating materials, along with indicators of the physical safety and cleanliness of a child’s home and various elements of the parent-child bond (Bradley & Caldwell 1977; Bradley 1980; Bradley 1994). Studies have found both race and class differences in a number of the sub-components of the Home scale (see Bradley 1994 & Bradley et al. 2000 for reviews of the findings).
13
their intellects. Second, occupational standing should be associated with verbal stimulation, as parents employed in managerial and professional roles will stress the sorts of verbal skills that led to their career successes during their interactions with their children. Thus, I expect that income and occupational prestige will be associated with differing levels of parental involvement at home.
As with parental formal and informal communications with the school, very little research addresses the extent to which these differences reflect race independent of class. Lareau’s (2003) ethnographic observations have led her to believe that Black middle-class children grow up in similar environments when compared to their White middle-class
counterparts, and White lower and working-class children are raised with similar childrearing practices as Blacks of similar socioeconomic status. Ogbu (2003), on the other hand,
believes that, due to the fact that Blacks’ home environments are less likely than Whites of the same class to encourage the cognitive development of their children. Ogbu suggests that this relationship reflects the fact that Blacks in America have, historically, been denied access to equal opportunities to achieve success.
14
cultural resources. Ho Sui-Chu and Willms (1996), on the other hand, found that, with appropriate controls, Black’s reported slightly more home discussion than Whites in their sample.
Given these conflicting findings, further evidence is needed to determine whether Blacks and Whites of similar socioeconomic status exhibit comparable levels of involvement in their children’s cognitive development.
Summary
This study proposes to address three research questions that concern race and class differences in parental involvement with their children’s school and with their cognitive development at home:
(1) Is social class an important determinant of parental involvement at school and at home? (1a) With respect to informal involvement at school, past research suggests that the
distinction between working class/poor versus middle households is salient in predicting informal involvement, and conceptual arguments also suggest the importance of continuous measures of education, income, and occupation. (1b) With respect to formal involvement at school, I expect no differences by class, whether viewed holistically or in terms of its individual components. (1c) With respect to involvement with children’s cognitive
development at home, I expect differences between middle and working/poor households, and also by income, education, and occupational prestige.
15
enriching home environments? Quantitative and qualitative studies differ on this question with respect to school involvement, and few studies have examined home involvement. (3) Do race and class (specifically education) interact to produce differential parental involvement with schools and enrichment at home? Poor and relatively uneducated Blacks may face more obstacles than poor Whites in order to participate in their children’s
CHAPTER II METHODS
Data
This paper uses data from the 1997 and 2004 waves of the Child Development Supplement (CDS) of the Panel Study of Income Dynamics (PSID). With a first wave of data collected from 5,000 households in 1968, the PSID has grown to include over 7,000 families and provides a nationally representative sample of men, women, and children. Originating in 1997, the CDS includes data from up to two randomly selected 0-12 year-old children of PSID respondents and the PSID respondents themselves. All PSID respondents who were part of a family unit that included children under the age of 13 were eligible, eventually yielding 2,458 households from the PSID “Core sample” and 247 households from the “New Immigration sample.” Initial oversampling of low-income households insured that a sizeable Black population would be included. In fact, 1140 White families with a total of 1,648 children were included, while data were collected from 997 Black families with 1,467 children. In total, with a participation rate of 88.2%, the 1997 wave of the CDS included data from 2,394 households and 3,586 children, with girls and boys approximately equally represented.
17
respondents who dropped out revealed no significant differences in race, head of household, age, income and education; those from single-headed household were slightly more likely than those living in intact families to discontinue with the survey after the first wave (12.36 1 d.f, < .001). Thus, drop-out is not likely to result in appreciable bias.
The analyses performed in this paper used information gathered from the primary caregiver of children in the sample who, at the time of the second wave of data collection, were at least six years of age. This age requirement was imposed to insure that questions pertaining to parental school involvement could be administered to parents and/or guardians. Additionally, children who dropped out of school or who were beyond the twelfth grade were excluded from the sample. Finally, only data gathered from White and Black children were used in the analyses. The final sample size is 2428, which includes 1,323 White children and 1,105 Black children. Post stratification weights based upon the 1997 Current Population Survey were used in some of the analyses in order to enhance the representativeness of the data (Hofferth et al., 2000).
Measures
18
verbal stimulation, involvement in children’s skill development and providing educational resources) that serve the purpose of giving one’s child a “leg up” on other children; in contrast, “formal school communication” typically reflects parental responses to requests from institutions that implore parents to react to perceived challenges and difficulties.
Indicators of informal school communication consist of responses to the following questions: “In the last 12 months, how many times have you: a) volunteered in any
classroom, school office, or library; b) had an informal conversation with your child’s teacher; c) had an informal conversation with your child’s principal.” Response options are whole numbers revealing the total number of times parents engaged in the above behaviors. Due to the fact that there are only three indicators for this construct, confirmatory factor analysis does not yield a chi-square statistic; however, the indicators load well on the construct when they are used in the full, multivariate models.
Formal school communication consists of actions that are generally initiated by school officials and is indicated by the following questions: “In the last 12 months, how many times have you: a) had a conference with your child’s teacher; b) had a conference with your child’s school principal; c) met with a school counselor at your child’s school.” Once again, possible responses are whole numbers indicating how many times they did each of these activities, and confirmatory factor analysis cannot provide an overall fit for the measurement model; however, the indicators loaded well on the latent construct when they are employed in the multivariate analyses.
19
of multiple constructs, including household educational resources, verbal stimulation, and parental involvement with the cultivation of skills.
Educational resources are materials in the child’s home that are commonly believed to promote cognitive development (DeGraaf 1986, Teachman 1987, & Downey 1995b, Roscigno & Ainsworth-Darnell (2001). Indicators of material educational resources include “how many (1=none, 2=1 or 2, 3= 3 to 9, 4=10-19, 5= 20 or more) books there are in the house”; “about how many books does your child have”; “how many (enter number) working computers are there in the home that your child could use”; and, “how many of the
computers in your home have an Internet connection.” Additionally, the final indicator is an index created by adding together responses to the following questions: “about how many magazines does your family get regularly;” “does your child have a library card or his/her name on a library list” (1=yes, 0=no); “is there a musical instrument that your child can use at home” (1=yes, 0=no); “does your child have a dictionary at home that he/she can use” (1=yes, 0=-no); “does your child have an encyclopedia or other reference material at home that he/she can use” (1=yes, 0=no); “does your family get a daily newspaper” (1=yes, 0=no). Appendix A includes the results of confirmatory factor analyses, which indicated that the items loaded well on the construct.
Chi-20
square test, with an insignificant result indicating that the lambda coefficients can be constrained to be equal between the two groups.
In the case of educational resources, the difference in fit between the freely estimated and constrained models was 53.47 with 5 degrees of freedom (p>.05) indicating that the construct is not invariant between Blacks and Whites. However, partial invariance was established with the following items: number of computers in the home, computers with internet connection, and the composite cultural resources indicator. The two models were re-estimated, constraining the lambdas for these three items only, with a resulting Chi-square of 3.06 with 2 degrees of freedom (p>.05). Thus, it appears that, for the most part, the latent concept of educational resources is reasonably consistent across Blacks and Whites.
21
talked with your child about his/her relationships, like his/her relationships with friends; c) talked with your child about his/her day.”
Confirmatory factor analyses, reported in Appendix A, revealed that the individual items loaded well on the construct. The test for measurement invariance between Blacks and Whites indicated that there was a Chi-square difference of 40.43 with 5 degrees of freedom (p<.05). Partial invariance was established for four indicators: talking about interests, discussing interests, discussing studies, and discussing school. The Chi-square difference test for partial invariance was 4.45 with 3 degrees of freedom (p>.05).
22
within the past 12 months?” (1=never, 2= once or twice, 3=several times, 4=once a month, 5=more than once a month); “How often do you encourage your child to read?” (1= several times a year, 2= several times a month, 3= about once a week, 4= a few times a week, 5= everyday).
Confirmatory factor analyses, reported in Appendix A, revealed that the indicators loaded well on the construct. The Chi-square difference test between the freely estimated and constrained model was 4.79 with 5 degrees of freedom (p>.05), indicating that this construct is invariant across Blacks and Whites.
Social Class and Race. Scholars such as Lareau (2003), Goldthorpe & Marshall (1992), & Wright (1996) hold that distinct social classes exist and, thus, should be conceptualized and measured as groups. Kingston (2000), on the other hand, argues that socioeconomic differences exist on a continuum and thus measures of social class are better looked at as disaggregated, continuous variables. This paper compares and contrasts these alternative conceptualizations, using educational and occupational data from the first wave and income data averaged across the first and second waves of data.
23
skills; finally, poor are those who live in household in which parents receive public assistance and do not participate in the labor force on a regular basis.
Social class is operationalized similarly. Respondents grouped into the middle-class include heads of households who fell into the professional and manager category, along with those in other occupations who have completed a college degree. The working class, on the other hand, consists of head of households who are not working as professionals and
managers, who are in other occupation categories (but do not have a college degree), and who are not on public assistance. Finally, the poor category is composed of those who had to receive public assistance from the government. Like Lareau, this paper does not include a separate category for upper-class individuals. This conflation of middle and upper-class families should not impact the results of the current analyses, as only 1% (n=27) of respondents reported an average income from 1997 and 2001 of over $250,000.
The second set of models employs disaggregated social class measures, consisting of typical indicators of socioeconomic status: education, occupation and income. Educational attainment is measured as the total number of years of education that the head of household has completed at the time of the first (1997) wave of the CDS. One of the strengths of the current study is that it employs data from the PSID which, compared to other nationally representative data sets, has high response rates for income. Income consists of the average of the total yearly household incomes, measured in dollars, from the original 1997 wave of data and from the 2001 follow-up survey. Because income often fluctuates quite significantly from year to year, an average of both waves is used.1 The measure of occupation consists of the following categories: professionals, managers/administrators, sales, clerical, craftsmen,
1
24
operatives, transport equipment operatives, laborers, farmers/ farm managers, farm
laborers/foremen, service workers, private household workers, unemployed. In the analyses, the head of household’s occupational position in 1997 was employed and was treated as a continuous variable, with an assignment of zero to those heads of households who, at the time of the survey, were unemployed and 12 to heads of households who were employed in the highest prestige category, professional.The race of respondents is limited to Blacks and Whites, and is measured with a dummy variable with 0=Black and 1=White. Due to the small number of observations, all other racial and ethnic categories were omitted from the sample. Controls. Some of the analyses control for alternative factors that may also influence the outcomes (all control variables are taken from the 1997 wave of data). For example, a number of researchers have found that the number of siblings predicts amounts of parental support (Downey 1995). Additionally, it is likely that a link exists between the number of children in a home and the amount of educational resources. Thus, the number of siblings in the home is instituted as a control. Family structure has also been tied to levels of parental involvement (Lee 1993; Crosnoe 2001). A measure of family structure is included with zero representing single-parent households and one corresponding to two parent households (both biological and step-parents). Originally, three categories were included in the analyses. Because there were so few step-families in the sample and due to the fact that no differences were found between two-parent biological and two-parent step-families when bivariate analyses predicting parenting behaviors were run, these two categories were collapsed into one.
As younger children generally demand more attention from parents than older
25
the outcome measures of parental involvement. The grade level of the children from
kindergarten through grade twelve will be treated as a continuous variable and controlled for in the models. Child gender will be dummy coded with 0=female and 1=male. Gender is controlled because some researchers have established differential involvement based upon the sex of the child. Muller (1998) reported that girls discussed issues concerning school more often with parents than did boys. Additionally, she found that parents participating in more teacher conferences concerning their sons but attending more of their daughters’ extracurricular events (cf. Stevenson & Baker, 1987). Finally, head of household age was controlled because older parents may exhibit parenting styles that differ from their younger counterparts.
Analytical strategy
The overarching purpose of this paper is to examine links between social class and race on the one hand, and parent’s involvement with their children’s schooling and cognitive development at home. I begin by examining bivariate relationships between race and
26
for middle versus poor/working class; Table 5 for continuous measures of occupation, income, and education).
The models in all tables were estimated using the partially invariant constructs. Additional analyses were run on a subset of the constructs, using only those indicators that proved to be invariant across Blacks and Whites. Results from these analyses proved to be substantively similar to those reported in the tables, suggesting that the use of partially invariant constructs did not significantly alter the findings.
27
CHAPTER III RESULTS
Racial Differences in Indicators of Socioeconomic Status and Parental Involvement
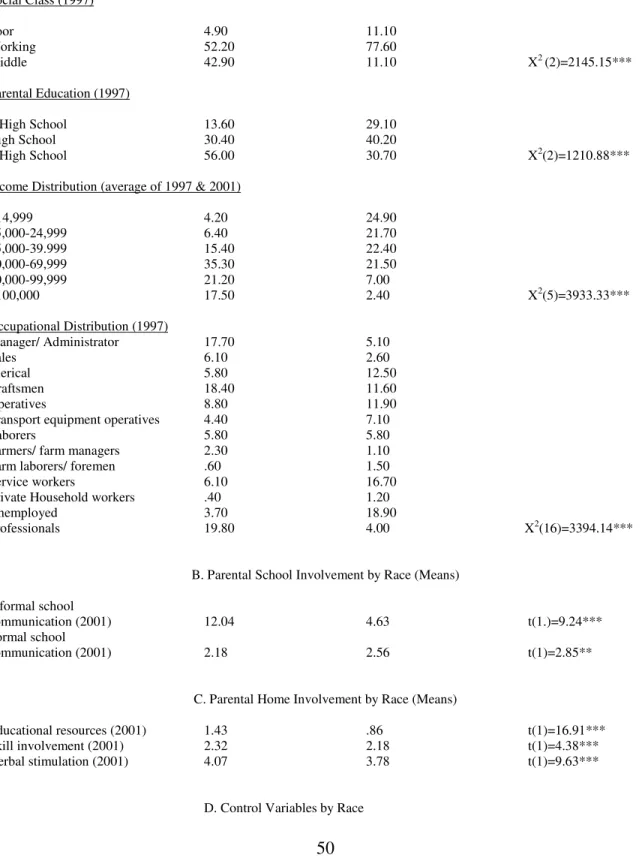
Panel A of Table 1 reports the bivariate relationships between race and social class, education, income, occupation, family structure, head of household’s age, child’s grade level, and number of children in the home. An examination of these associations indicates that racial differences are often marked. With respect to measures of social class and
socioeconomic status, for instance, compared to Whites, over twice the percentage of Blacks in the sample fell into the poor category (11.30% versus 4.90%, respectively) of social class and, similarly over twice as many Blacks as Whites have achieved less than a high school education (29.10% versus 13.60%). Close to six times more Blacks than Whites reported a household income of less than $15,000 (24.90% and 4.20%, respectively). In addition, the percentage of Whites falling into the middle-class category was almost four times greater than the percentage of Blacks (42.90% and 11.10%, respectively), while the percentage of Whites earning over $100,000 a year is over seven times greater (17.50% and 2.40%, respectively). Thus, even amidst recent reports of a growing Black middle class and a closing of the income and education gaps across Blacks and Whites, substantial differences favoring Whites are still the rule (Grodsky and Pager 2001).
29
communication, for which Blacks had a larger mean (Mean= 2.56 for Blacks, 2.18 for
Whites, t=2.85, p< .01), Whites have consistently higher mean values for each construct. As Panels B and C of Table 1 reveal, differences with respect to informal school communication (Mean=12.04 for Whites, 4.63 for Blacks, t=9.24 p≤.001) and educational resources
(Mean=1.43 for Whites, .86 for Blacks, t=16.91 p≤.001) are particularly pronounced, while disparities in skill involvement (Mean=2.32 for Whites, 2.18 for Blacks, t=4.38, p≤.001) and verbal stimulation (Mean=4.07 for Whites, 3.78 for Blacks, t=9.63, p≤.001) are also quite significant.
Turning to the control variables, reported in Panel D of Table 1, disparities in family structure are rather striking: only 14% of the children in the White sample are being raised in a single headed household, while 55% of the Black children fall into this category. Further, the age of the head of household and number of children are moderately different across racial groups, with White parents being slightly older and Blacks having more children.
The bivariate analyses thus show that racial differences exist and in many areas are large. With respect to social class, Whites, on average, have larger incomes, greater education, and more prestigious occupations and are thus much less likely to fall into the poor category of social class and much more likely to claim middle class status. In terms of parental involvement in schools and at home, the outcomes of interest in this paper, Whites report higher mean values on all but formal school communication. Finally, sizable
30
Race and Social Class Differences in Parental Involvement
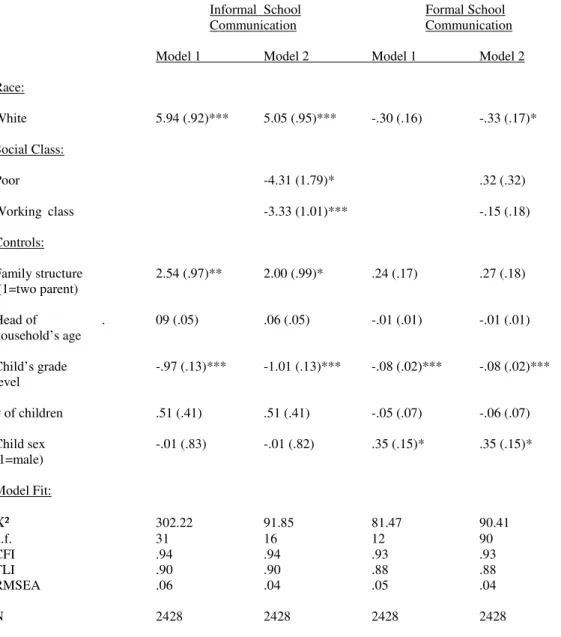
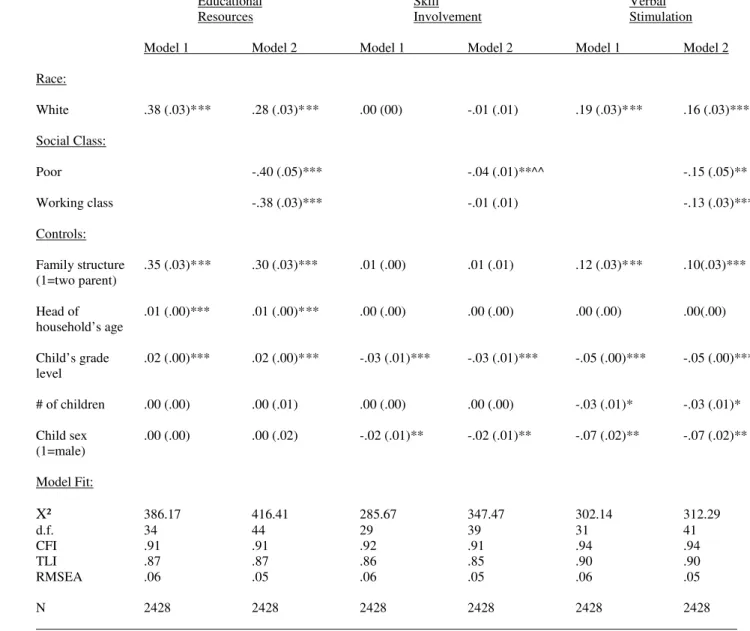
Tables 2a and 2b present results from structural equation models that predict parental involvement in schools and at home. For each of the five aspects of parental involvement, two models were estimated: “Model 1” reports the results for the “race only,” while “Model 2” includes measures of social class along with race. These two sets of models permit the examination of hypotheses 1 and 2, that race and social class have independent effects on school and home involvement.
Looking at the “race only” models (Model 1) in Tables 2a and 2b, the models fit the data well. Given that each of the goodness of fit indices operates on different assumptions, researchers typically report multiple indices of overall fit (Hoyle & Panther, 1995). In these analyses, the chi-square test of model fit value and the corresponding p-value are assessed, along with the comparative fit index (CFI; Bentler, 1990), the Tucker-Lewis Index (TLI) and the root mean square error of approximation (RMSEA; Browne & Cudek, 1993). The CFI ranges from 0 to 1, with 0 indicating the absence of model fit and 1 indicating perfect model fit. Values of .90 or higher are typically interpreted as evidence of good model fit (Bollen, 1989; Hoyle & Panter, 1995). Similarly,the TLI compares the estimated model with a perfectly-fitting “baseline model” and values of .90 or greater are generally considered an adequate approximation of the baseline model. RMSEA values that are less than .05, on the other hand, are usually accepted as indicators of good model fit, while those between .05 and .08 indicate an adequate fit (Browne & Cudek, 1993).
31
1=.94, model 2=.93) and formal school communication (model 1=.93, model 2=.94), educational resources (model 1=.91, model 2=.91) skill involvement (model 1=.92, model 2=.91), and verbal stimulation (model 1=.94, model 2=.94) all provide evidence of a good model fit. A similar pattern is observed for the RMSEA and TLI values, with RMSEAs falling between .04 and .06 and TLI values of between .85 and .90.
Model 1 in Tables 2a and 2b reveals that race is a significant predictor of informal school communication (b=5.94, p≤.001), educational resources (b=.38, p≤ .001), and verbal stimulation (b=.19, p≤.001), with Whites demonstrating higher levels of involvement as indicated by three dimensions. No significant results are observed for formal school
communication and skill involvement. Accordingly, with respect to Hypothesis 2, the bulk of the evidence suggests that race is, in fact, an important independent predictor of parenting behaviors at school and at home.
32
more siblings they have (b=-.03, p≤.05). Head of household’s age, number of children, and child sex, on the other hand, were not consistently significant.
Model 2 of Tables 2a and 2b, adds social class to the models; the measure of social class is broken into poor, working class, and middle class (the reference group) categories. As with “race only” models (Model 1), all of the fit indices (CFIs, TLIs, and RMSEAs) of the race and social class models fall within the acceptable range. Consistent with Lareau’s ethnographic findings, the poor and the working classes are significantly different from the middle-class reference groups with respect to informal school communication (poor: b=-4.31, p<.05; working class: b=-3.33, p ≤.001), educational resources (poor: b=-.40, p≤.001;
working class: b=-.38, p≤.001), and verbal stimulation (poor: b=-.15, p ≤.01; working class: b=-.13, p≤.001). Specifically, all of these parenting practices are more likely in middle class households when compared to their poor and working class counterparts. For the latent construct of parental involvement in the cultivation of their children’s skill, on the other hand, only poor households--not working class ones--were significantly different from the middle-class (b=-.04, p≤.01). Thus, regarding Hypotheses 1a and 1c, significant differences in parental involvement by social class were the rule. Additionally, the only construct for which social class failed to reach significance, formal school communication, was not hypothesized to differ across social classes (Hypothesis 1b). These analyses thus provide strong support for the contention that social class is a determinant of parenting practices and, specifically, that middle-class parents demonstrate greater involvement in the cognitive development of their children than do either poor or working-class parents.
33
tables) were estimated according to which working-class replaced middle-class as the omitted category, allowing for a direct comparison of parenting practices of the poor and working classes. These results revealed that only in the case of skill involvement was there a significant difference between poor and working class households, with poor parents
demonstrating less participation with the cultivation of skills in their children (b=-.03, p≤.05) than working class parents. Thus, Lareau’s contention that the major divide in parenting practices exists not between the poor and the working class, but between these two social classes and the middle-class was largely supported by these analyses.
When results from the “race only” models (Models 1) are compared to the “race and social class” models (Models 2) across the different constructs, it becomes apparent that the magnitude of the effect of race is diminished somewhat when social class is added to the models of informal school communication (from b=5.94 to b=5.05), educational resources (from b=.38 to b=.28), and verbal stimulation (from b=.19 to b=.16). Nevertheless, the coefficients associated with race remain statistically significant and indicate that, controlling social class, Whites maintain significantly higher levels of these parenting behaviors.
Race and Social Class Interactions in the Prediction of Home and School Involvement
34
and parenting to be estimated freely for Blacks and for Whites; models are then re-estimated, constraining the paths from social class to parenting outcomes for Blacks and White to be equivalent. As with the test of measurement invariance, the difference between the Chi-squares of these two models indicates whether the constrained model is a statistically significant poorer fit than the freely estimated model. If the model fits are indeed different, then Blacks and Whites differ with respect to the effect size of social class on parental involvement.
Most of the models fit the data well: the CFI, RMSEA, and TLI scores for informal school communication (CFI=.90, RMSEA= .05, TLI=.84), skill involvement (CFI=.93, RMSEA=.05, TLI=.89), and verbal stimulation (CFI= .95, RMSEA=.05, TLI=.92) fall well within the acceptable range. The fit indices are equivocal with respect to formal school communication (CFI=.80, RMSEA=.08, TLI=.68) and educational resources (CFI=.87, RMSEA=.06, TLI=.83), suggesting caution when interpreting these results.
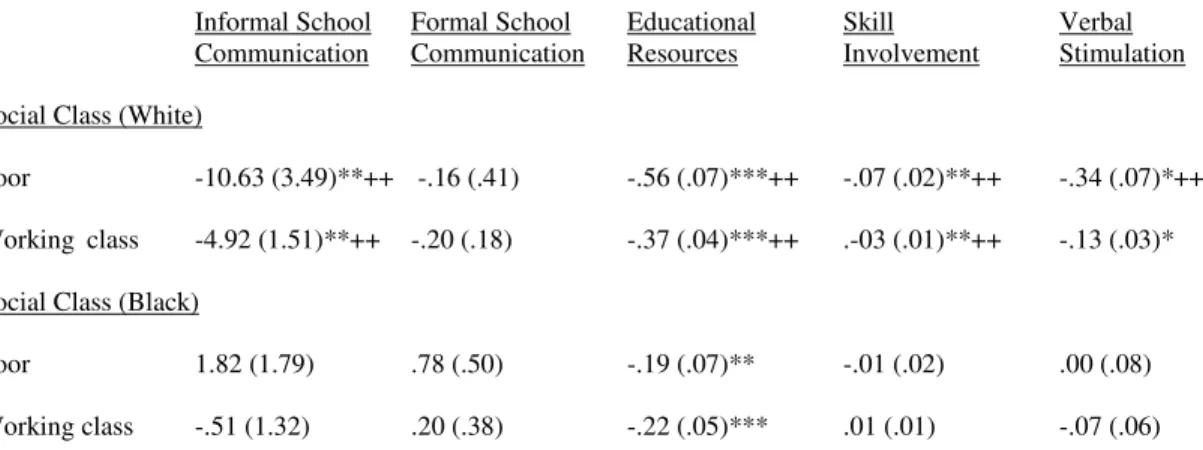
Panel A of Table 3 reports the effects of the poor and working class dummies, with control variables, for Whites and Blacks. The results of these analyses suggest that social class is a more important determinant of parenting practices related to the cognitive
35
counterparts. For Blacks on the other hand, social class was only related to the amount of educational resources they provide their children (poor: b=-.19, p≤.01; working-class: b=-.22, p≤.001).
Do the effects of social class on indicators of involvement differ significantly in magnitude between Blacks and Whites? In order to examine this question, models were re-estimated with the effects of social class constrained to be equal between the two racial groups. A significant decrement in fit would indicate that the strengths of the effects are statistically different in magnitude across the racial groups. For each outcome, the freely estimated model was re-estimated twice: one model constrained the effect of poor to be equal between Blacks and Whites, and one model constrained the effect of working class between these two groups.
Panel B of Table 3 reports the differences in Chi-squares for the freely estimated and constrained models. The results show that the strength of the relationship between social class and parenting behaviors was significantly greater for Whites than for Blacks for every construct with the exception of formal school communication. The magnitude, or strength, of the relationship between social class and parenting was greater for Whites than for Blacks on every construct except for the “reactive behavior” of formal school involvement. Even with respect to educational resources, for which there was a significant relationship between social class and Black involvement, the White relationship was statistically larger, suggesting that the impact of social class was greater.
36
Thus far, the hypotheses have been tested using categorical measures of social class. A disaggregated measure of social class permits an examination of whether certain aspects of social class are independently influential in predicting parental involvement in their
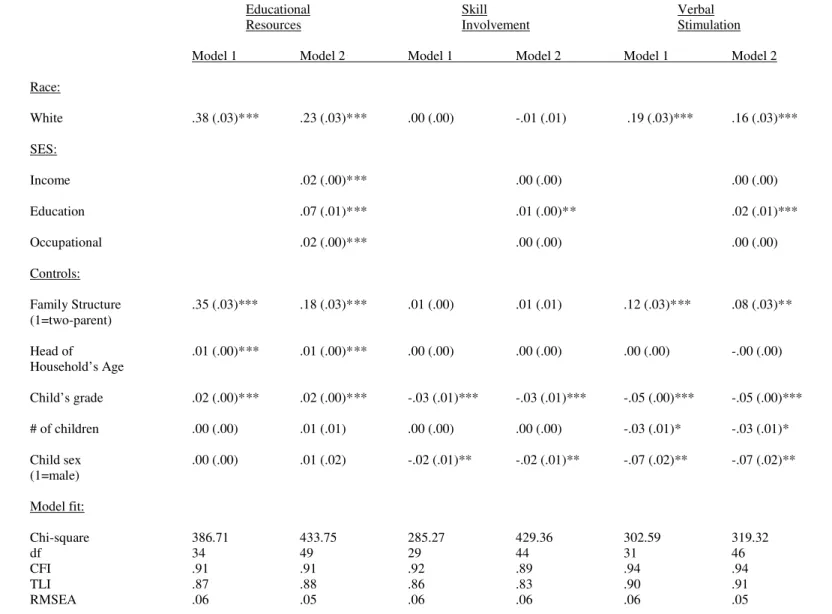
children’s cognitive development. The results reported in Table 4a and Table 4b reveal that overall model fits are almost identical to those reported in Table 2a and Table 2b.
Additionally, the connection between race and parental behaviors remains quite similar to the previous models when these new, disaggregated measures of social class are employed.
Of primary interest are the independent effects of income, education, and occupation. As predicted by Hypothesis 1c, income was most strongly related to educational resources (b=.07, p<.001), but proved unrelated to other parenting practices. Also consistent with Hypothesis 1c, education had the most wide-ranging influence on parental behaviors. For instance, education was related not only to informal school communication (b=.91, p< .001), but also educational resources (b=.07, p<.001), skill involvement (b=.01, p<.001), and verbal stimulation (b=.02, p<.001). Hence, it appears that when it comes to parenting, education exerts a wide-ranging influence. Occupation was related to educational resources (b=.02, p<.001) and not skill involvement and verbal stimulation, as suggested by Hypothesis 1c.
37
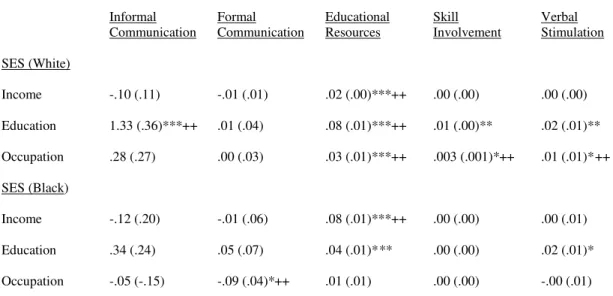
p<.001), educational resources (b=.08, p<.001), skill involvement (b=.01, p<.01), and verbal stimulation (b=.02, p<.01) for White parents, but only educational resources (b=.04, p<.001) and verbal stimulation (b=.02, p<.05) for Blacks. The fact that informal communication was related to education for Whites but not for Blacks is supportive of Hypothesis 3, which theorized that the legacy of race-based discrimination in schools would deter even
comparatively well-educated Blacks from becoming especially involved with their children’s schools .
For Whites, occupation proved to be predictive of educational resources (b=.03, p<.001), along with those parenting practices that will most likely foster the sorts of
attributes important to achieve cognitively complex, autonomous careers for their children: skill involvement (b=.003, p<.05) and verbal stimulation (b=.01, p<.05). Finally, income operated similarly for Blacks and Whites, but only proved important in predicting
educational resources (Whites: b=.02, p<.001, Blacks: b=.08, p<.001), lending some support to the financial capital model of childhood development (Guo & Harris 2000). Overall, the analyses reported in Table 5 reveal that the individual components of social class are more predictive of Whites’ parenting than Blacks’, but patterns are not as neat in the disaggregated models as they were in the earlier, composite models.
38
involvement, and verbal stimulation. It should be noted, however, that while the connection between occupation and skill involvement and verbal stimulation acted as expected and was significantly stronger for whites, the sizes of the effects were quite small (skill
CHAPTER IV
CONCLUSIONS AND DISCUSSION
How are social class and race related to parental involvement in children’s cognitive development at school and at home? Answers to these questions are potentially invaluable in the search to uncover processes through which social classes maintain advantages across generations by reproducing wealth and status in their children. Sociologists with such diverse theoretical starting points as Kohn, Bourdieu, Coleman, and Bernstein have pointed to the importance of families in general, and class cultures in particular, in explaining status reproduction. Recently, scholars such as Lareau and Ogbu have pushed researchers to consider questions of race in order to more fully explain how social inequality is perpetuated across generations.
A better understanding of the intersections of class, race, and parental practices is crucial for public policy as well. Authors such as Hernnstein and Murray (1994) posit genetic reasons for racial differences in cognitive achievement, implying that supports for Black families would be inefficacious. Lareau and other scholars, however, argue that should racial differences exist, they reflect issues of mistrust, alienation, and a lack of efficacy among Blacks. In any event, surprisingly little is known about the threshold question of whether racial differences in parenting exist independent of social class. Teasing out the impact of both social class and race in parental involvement is particularly important now that an increasing number of Blacks have achieved middle class status. Is the relatively low
43
differences in the home environment? Or, must we begin to look outside the home in order to explain the race-based achievement gap?
Analyses revealed that, consistent with Hypotheses 1a and 1b, social class influences proactive parental involvement at school and at home. Middle-class parents displayed more informal school communication, provided greater educational resources, more verbal
stimulation, and were more involved in cognitively stimulating activities with their children than either poor or working-class parents. The only realm in which social class was not related to parental involvement was with regard to formal school communication, a reactive form of engagement that was not predicted to differ. With respect to the disaggregated models (Hypothesis 1c), it appears that education is the only consistent predictor of pro-active child-rearing behaviors when both Blacks and Whites are included together in the models. This strong effect of education is consistent with numerous studies across a wide-dimension of outcomes, including health, support for civil liberties, and attitudes towards homelessness (see Pallas 2000; Kingston et. al. 2003).
The second research question concerned the issue of whether race impacts child-rearing independent of social class. Considerable disagreement exists among scholars on this point, with Lareau holding to the belief that, because of a legacy of discrimination against Blacks in the American school system, race does exert an independent effect on parental involvement at schools, but not at home, where discrimination is less tenable. Thus,
44
involvement. Results favored Ogbu over Lareau. While race had an independent effect on informal school communication, as Lareau predicted, it also exhibited independent effects on educational resources and verbal stimulation. This supports the notion of a global impact of race on involvement that Ogbu claimed, as opposed to the specific impact posited by Lareau
Finally, the third research question concerns the potential moderating effects of race on the relationships between social class and parenting. One primary concern was whether race-related institutional barriers with regard to participation in schools might deter Black parents from becoming as involved as White parents in this realm. Additionally, questions arise as to whether such obstacles make increased social class position less predictive of involvement for Blacks than for Whites. However, if the moderating effects of race on the relationship between social class and parental involvement are also apparent in the home, different explanations may be in order.
Results reveal that, among Whites, parents of higher social class reported greater amounts of informal school communication. The fact that social class did not exert a similar influence on Black parental involvement, however, suggests that Black parents may feel disengaged from their children’s schools. Whether this lack of an impact of social class on involvement is due to sentiments among Blacks of all class positions that schools are uninviting places cannot be directly tested with the data available in the Childhood
45
higher social status do not parent differently than their lower status counterparts. It may be the case that Black middle-class parents are more likely than White middle class parents to be first-generation middle class and, therefore, have yet to fully incorporate middle class values and strategies into their child-rearing practices. Research by Philips et. al. (1998) demonstrated that when data of the schooling, occupational status, and other characteristics of grandparents were added to models predicting the academic achievement of Blacks and Whites, this information helped narrow the test gap by a significant margin even after parental variables were added. This finding suggests that some of the differences between Blacks and Whites are due to multigenerational factors that are difficult to capture in most data sets but that may operate through child-rearing cultures. A final consideration stems from recent research suggesting that the neighborhood environment of Black middle-class families differs significantly from those that class Whites experience, with middle-class Blacks contending with a higher percentage of poor neighbors, higher crime rates, more single-parent families, and fewer college graduates (Sampson & Wilson 1995; Massey & Fischer 2003; Adelman 2004; see Parillo 2005 for a recent overview). Such factors may make harder for Black parents to sustain the kind of cognitively-enriching home experience that middle-class Whites provide.
46
poor and working class divide. In most instances, however, a continuous measurement strategy revealed linear effects. Further, the disaggregated measures revealed that different dimensions of social class operated independently. Income, for instance, only proved to be important with regard to acquiring material cultural capital, while education and occupation proved, among the White population, to exert an influence over a wide range of proactive parenting practices.
From a theoretical standpoint, the implications of the findings presented in this paper are numerous. First, the finding that there were significant differences in parental
47
reasons for these racial differences in involvement, as the impact of social class on family practices appears to be contingent upon race.
The implications of these findings for social policy are extensive, although they are likely to be influenced by one’s political inclinations. On the one hand, based on the findings that class is not a significant predictor of parental involvement for Blacks, conservatives are likely to point out that initiatives recommending transfers of wealth or affirmative action in employment and/or education are unlikely to significantly alter the child-rearing strategies of Blacks parents. Liberals, on the other hand, are likely to emphasize the need for programs teaching and encouraging parents to become more involved in their children’s development for all social groups. Furthermore, liberals are likely to point out that these results emphasize the need for programs such as Head Start, which provide many of the cognitively enriching exercises that this paper found that poor and working class children and minorities are not provided at home. Indeed, such supplemental programs may also need to be extended to middle-class Blacks to ensure that children born into families that are less involved than the middle-class Whites still have a chance for upward mobility.
A number of limitations present challenges to producing valid answers to the
proposed research questions. One problem concerns the fact that data were gathered from a single respondent. Ideally, one would wish to have independent measures which confirmed the reports by the primary caregiver concerning their child-rearing practices. Because
48
Another limitation has to do with the lack of mediating variables in order to test whether the lower involvement levels of the poor and working classes and Blacks were due to beliefs that racial or class prejudices result in blocked opportunities for status attainment or institutional discrimination in the cases of schools. Thus, these groups may be less likely than middle class parents to believe that their efforts in their children’s development will be rewarded in future status outcomes and, therefore, less likely to be involved in their
children’s cognitive development. Future research should test for mediating effects of ideas of beliefs of efficacy and perceived prejudice on the relationship between race, social class and parental involvement. Is it true that parents who believe that opportunities are limited for those outside the dominant racial or economic groups are less likely to invest time and
energy in their children’s cognitive development? Or are parents inspired to work even harder in an attempt to overcome the odds?
Additional research should also consider the implications of these class and race-based differences in parental involvement with respect to the educational and occupational attainment of children from different class and racial backgrounds. Are parenting practices a key piece of the puzzle of explaining class and race-based gaps in education and attainment? Unfortunately, the answer to this question has not been satisfactorily resolved.
49
strictly on poor and/or problematic sub-samples. Another problem stems from the tendency to evaluate Black families on values, such as separation and individuation, which are held in esteem by middle-class Whites, as opposed to values such as cooperation and
interdependency, which take on special importance among Blacks. Similarly, by evaluating lower-class Blacks on values derived from middle-class White populations, researchers implicitly increase the probability of finding support for a “deficit” model of the Black family. And, although such “deficit model” thinking has been challenged by many Black scholars, these models continue to influence and inform public images and opinions of Blacks. Lastly, much analyses decontextualize the Black family by removing the study of family life from the wider socio-economic and historical contexts in which Black families have developed and evolved. Thus, it is not unusual for researchers to ignore the origins of the Black family in West Africa, downplay the legacy of slavery, overlook the impact of Reconstruction, Jim Crow, and the Civil Rights and Black Power Movements, and, finally, to fail to fully appreciate the impact that globalization, economic and welfare state
restructuring, and the onset of the post-industrial economy has had on the development of the urban “underclass.” Such decontextualizing of the Black family has both led to, and
50
Table 1: Bivariate Relationships, Race and Social Class, and Control Variables, Panel Study of Income Dynamics, Childhood Developmental Supplement: 1997 & 2001, (N=2,428)
White (N=1323) Black (N=1105) Test statistic (degrees of freedom)
A. Indicators of Socioeconomic Status & Class by Race (%)
Social Class (1997)
Poor 4.90 11.10
Working 52.20 77.60
Middle 42.90 11.10 X2 (2)=2145.15***
Parental Education (1997)
< High School 13.60 29.10
High School 30.40 40.20
> High School 56.00 30.70 X2(2)=1210.88***
Income Distribution (average of 1997 & 2001)
<14,999 4.20 24.90
15,000-24,999 6.40 21.70
25,000-39.999 15.40 22.40
40,000-69,999 35.30 21.50
70,000-99,999 21.20 7.00
>100,000 17.50 2.40 X2(5)=3933.33***
Occupational Distribution (1997)
Manager/ Administrator 17.70 5.10
Sales 6.10 2.60
Clerical 5.80 12.50
Craftsmen 18.40 11.60
Operatives 8.80 11.90
Transport equipment operatives 4.40 7.10
Laborers 5.80 5.80
Farmers/ farm managers 2.30 1.10
Farm laborers/ foremen .60 1.50
Service workers 6.10 16.70
Private Household workers .40 1.20
Unemployed 3.70 18.90
Professionals 19.80 4.00 X2(16)=3394.14***
B. Parental School Involvement by Race (Means)
Informal school
communication (2001) 12.04 4.63 t(1.)=9.24***
Formal school
communication (2001) 2.18 2.56 t(1)=2.85**
C. Parental Home Involvement by Race (Means)
Educational resources (2001) 1.43 .86 t(1)=16.91***
Skill involvement (2001) 2.32 2.18 t(1)=4.38***
Verbal stimulation (2001) 4.07 3.78 t(1)=9.63***
51 Family Structure (1997) (%)
Two parent 84.60 44.40 X2(1)=3038.83.***
Single headed household 15.40 55.60
Children’s grade level (1997) (%)
K-6 55.30 53.5 X2 (1)=5.32*
7-12 44.70 46.5
Number of Children
(1997) (Mean, S.D.) 2.18 (.86) 2.33 (1.17) t(1)= 9.62***
Head of Household Age
(1997) (Mean, S.D.) 40.09 (8.00) 38.97 (9.43) t(1)= 8.38***
52
Table 2a: Relationships between Social Class/Race and Parental Formal & Informal Communication with Their Children’s Schools, Panel Study of Income Dynamics, Childhood Development Supplement: 1997 & 2001 (unstandardized coefficients/ standard errors reported).
Informal School Formal School
Communication Communication
Model 1 Model 2 Model 1 Model 2
Race:
White 5.94 (.92)*** 5.05 (.95)*** -.30 (.16) -.33 (.17)*
Social Class:
Poor -4.31 (1.79)* .32 (.32)
Working class -3.33 (1.01)*** -.15 (.18)
Controls:
Family structure 2.54 (.97)** 2.00 (.99)* .24 (.17) .27 (.18)
(1=two parent)
Head of . 09 (.05) .06 (.05) -.01 (.01) -.01 (.01)
household’s age
Child’s grade -.97 (.13)*** -1.01 (.13)*** -.08 (.02)*** -.08 (.02)*** level
# of children .51 (.41) .51 (.41) -.05 (.07) -.06 (.07)
Child sex -.01 (.83) -.01 (.82) .35 (.15)* .35 (.15)*
(1=male)
Model Fit:
X² 302.22 91.85 81.47 90.41
d.f. 31 16 12 90
CFI .94 .94 .93 .93
TLI .90 .90 .88 .88
RMSEA .06 .04 .05 .04
N 2428 2428 2428 2428
*p≤.05 (two-tailed tests), ** p≤.01 (two-tailed tests), *** p≤.001 (two-tailed tests)
Table 2b: Relationships between Social Class/Race and Educational Resources, Skill Involvement, and Verbal Stimulation , Panel Study of Income Dynamics, Childhood Development Supplement: 1997 & 2001 (unstandardized coefficients/ standard errors reported).
Educational Skill Verbal
Resources Involvement Stimulation
Model 1 Model 2 Model 1 Model 2 Model 1 Model 2
Race:
White .38 (.03)* ** .28 (.03)* ** .00 (00) -.01 (.01) .19 (.03)* ** .16 (.03)***
Social Class:
Poor -.40 (.05)*** -.04 (.01)**^^ -.15 (.05)**
Working class -.38 (.03)*** -.01 (.01) -.13 (.03)***
Controls:
Family structure .35 (.03)* ** .30 (.03)*** .01 (.00) .01 (.01) .12 (.03)* ** .10(.03)***
(1=two parent)
Head of .01 (.00)*** .01 (.00)* ** .00 (.00) .00 (.00) .00 (.00) .00(.00)
household’s age
Child’s grade .02 (.00)*** .02 (.00)* ** -.03 (.01)*** -.03 (.01)*** -.05 (.00)*** -.05 (.00)***
level
# of children .00 (.00) .00 (.01) .00 (.00) .00 (.00) -.03 (.01)* -.03 (.01)*
Child sex .00 (.00) .00 (.02) -.02 (.01)** -.02 (.01)** -.07 (.02)** -.07 (.02)**
(1=male)
Model Fit:
X² 386.17 416.41 285.67 347.47 302.14 312.29
d.f. 34 44 29 39 31 41
CFI .91 .91 .92 .91 .94 .94
TLI .87 .87 .86 .85 .90 .90
RMSEA .06 .05 .06 .05 .06 .05
N 2428 2428 2428 2428 2428 2428
*p≤.05 (two-tailed tests), ** p≤.01 (two-tailed tests), *** p≤.001 (two-tailed tests)
^^ = poor is significantly different from working class