THE ECOLOGY OF BIRDS IN THE URBAN LANDSCAPE: AVIAN COMMUNITY COMPOSITION, DISPERSAL, AND SURVIVAL ACROSS THE RURAL-TO-URBAN
GRADIENT IN WASHINGTON D.C.
Brian Spence Evans
A dissertation submitted to the faculty at the University of North Carolina at Chapel Hill in partial fulfillment of the requirements for the degree of Doctor of Philosophy in the Curriculum for the
Environment and Ecology.
Chapel Hill 2015
ii
iii ABSTRACT
Brian Spence Evans: The Ecology Of Birds In The Urban Landscape: Avian Community Composition, Dispersal, And Survival Across The Rural-To-Urban Gradient In Washington D.C.
(Under the direction of Allen H. Hurlbert and Peter P. Marra)
Urbanization during the latter half of the twentieth century has altered habitats, restructured wildlife communities, and influenced the range sizes and population dynamics of animal species.
While many bird species persist in urban environments, little is known about the consequence of urbanization on birds – in part because urban landscapes confer conflicting pressures, such as
exposure to novel predators, and benefits, such as anthropogenic food resources. Here, we explore the influence of urbanization on birds in the Washington D.C. metropolitan area using a unique
study design that addresses the community composition, dispersal behavior, and survival of birds
across the rural-to-urban gradient within the context of a regional citizen science project. We found supportive evidence for environmental filtering of bird communities by assessing variation in
functional diversity as well as the proportional and apparent abundance of avian life history guilds within sites across the rural-to-urban gradient. To address the influence of urbanization on avian
dispersal, we explored the degree of permeability of habitats in association with the spatial distribution of four species of birds banded and reencountered in subsequent years. There was
iv
Finally, we used mark-recapture data to assess variation in adult survival across the rural-to-urban gradient to test hypotheses about the processes by which urbanization is expected to influence avian
survival. Adult survival was enhanced in suburban and urban habitats for four of our seven focal species and there was no evidence in support of an influence of urban land cover on survival for the
remaining species. Taken cumulatively, this research addresses three distinct ecological relationships between birds and their environments and provides a significant advancement in our understanding
v
ACKNOWLEDGEMENTS
vi
TABLE OF CONTENTS
LIST OF TABLES ... ix
LIST OF FIGURES ... x
LIST OF ABBREVIATIONS AND SYMBOLS ... xi
CHAPTER 1: ENVIRONMENTAL FILTERING OF AVIAN COMMUNITIES ALONG A RURAL-TO-URBAN GRADIENT IN GREATER WASHINGTON D.C. ... 1
Introduction ... 1
Methods ... 5
Results ... 9
Discussion ... 11
Species Richness ... 12
Dietary Guilds ... 13
Foraging Guilds ... 13
Nesting Guilds ... 14
vii
Conclusion ... 16
TABLES ... 18
FIGURES ... 22
WORKS CITED ... 26
CHAPTER 2: DISPERSAL IN THE URBAN MATRIX: ASSESSING THE INFLUENCE OF LANDSCAPE PERMEABILITY ON THE SETTLEMENT PATTERNS OF BREEDING SONGBIRDS ... 32
Introduction ... 32
Methods ... 36
Results ... 40
Discussion ... 43
TABLES ... 48
FIGURES ... 52
WORKS CITED ... 56
CHAPTER 3: CHARACTERIZING AVIAN SURVIVAL ALONG A RURAL-TO-URBAN LAND USE GRADIENT ... 61
Introduction ... 61
viii
Model development ... 65
Results ... 69
Discussion ... 71
Top-down and bottom-up controls on avian population processes ... 72
Potential influence of urbanization on avian fitness ... 74
Conclusion ... 75
TABLES ... 76
FIGURES ... 80
WORKS CITED ... 83
CONCLUSION AND SYNTHESIS... 88
ix
LIST OF TABLES
Table 1.1: Life history traits, sample sizes, and expected response to urbanization
for four songbird guilds observed in metropolitan Washington D.C. ... 18
Table 1.2: Model selection table for the response of species richness and functional
diversity to urban land cover in metropolitan Washington D.C. ... 19
Table 1.3: Model selection table for variation in estimated abundance by guild
in response to urban land cover in metropolitan Washington D.C. ... 20
Table 1.4: Model selection table for variation in the relative abundances of guild
in response to urban land cover in metropolitan Washington D.C. ... 21
Table 2.1: Life-history traits of the four focal bird species evaluated in this study ... 48
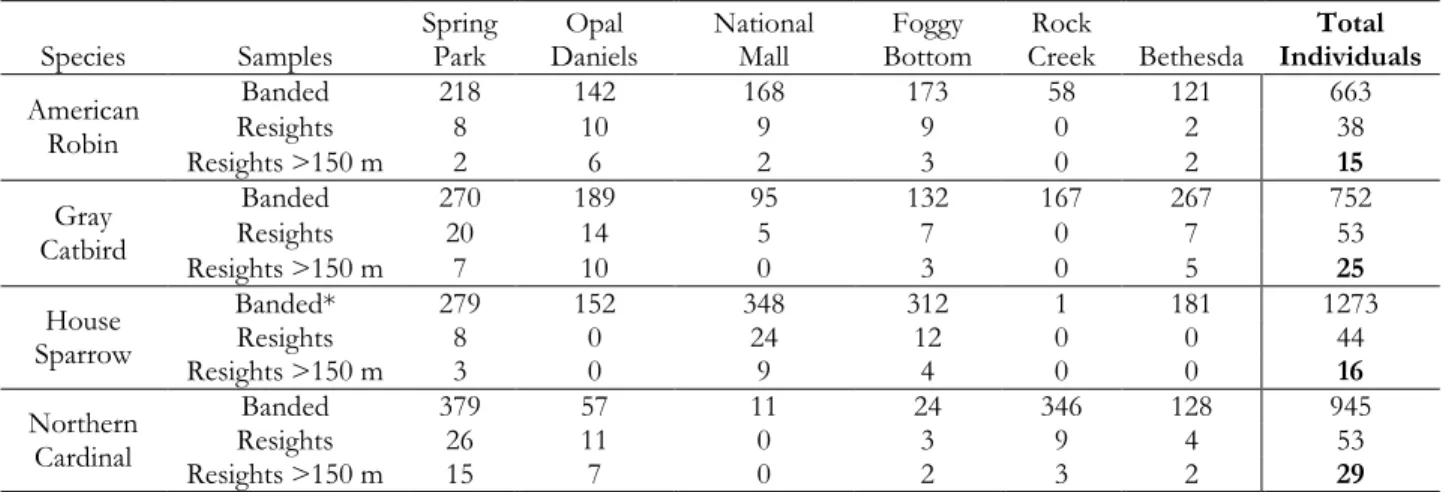
Table 2.2: Sample sizes of captured and reencountered birds across six banding
stations in metropolitan Washington, D.C. ... 49
Table 2.3: Model selection table for logistic models of settlement likelihood as
a function of habitat suitability and permeability ... 50
Table 2.4: Influence of sex and age on suitability and permeability estimates ... 51
Table 3.1: Description of a priori and urbanization survival models, covariates,
and group variables ... 76
Table 3.2: Sample counts of captured and re-encountered birds by Neighborhood
Nestwatch in metropolitan Washington D.C. ... 77
Table 3.3: Model selection table for models describing the apparent survival of
eight species of birds across the rural-to-urban gradient ... 78
Table 3.4: Model-average beta parameter estimates describing variation in
x
LIST OF FIGURES
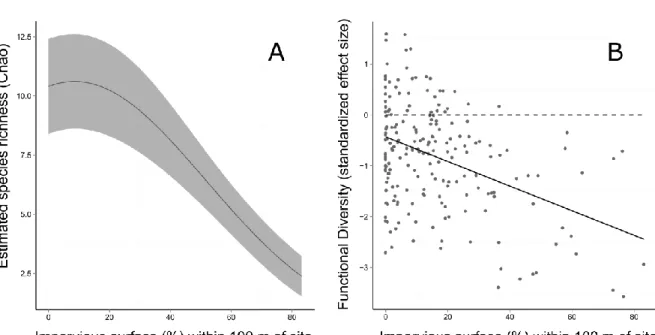
Figure 1.1: Variation in avian species richness and functional diversity in
response to urban land cover ... 22
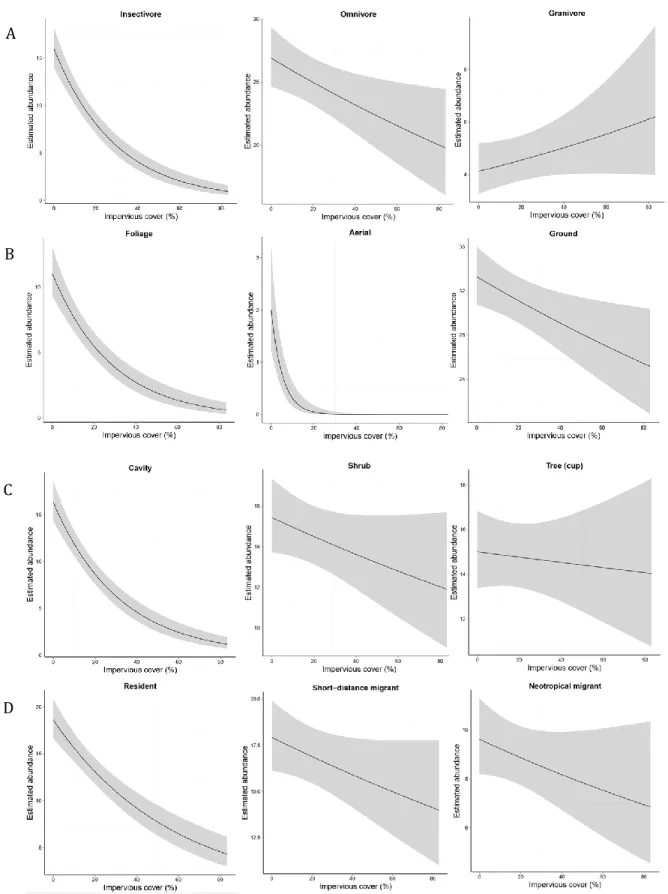
Figure 1.2: Variation in the estimated abundances of avian life history guilds
in response to urban land cover ... 23
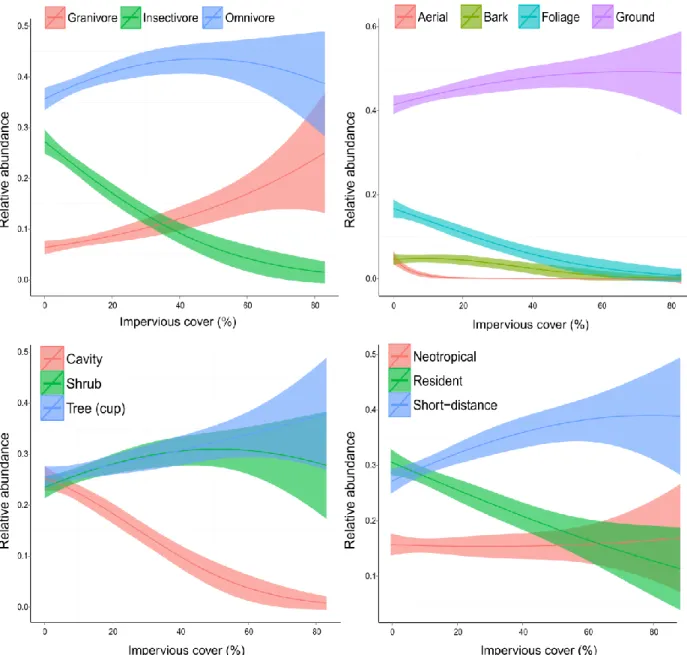
Figure 1.3: Relative abundances of avian life history guilds across the
rural-to-urban gradient ... 24
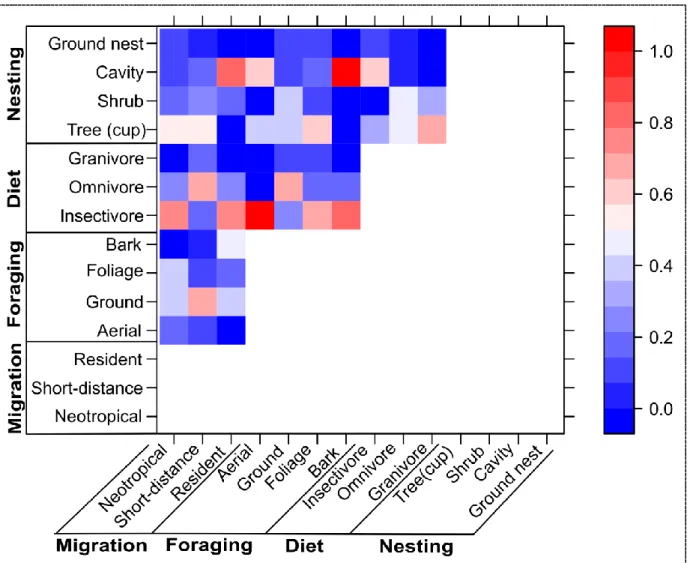
Figure 1.4: Proportion of shared guild membership among traits for birds
observed in Greater Washington D.C. ... 25
Figure 2.1: Sample design for resight locations surrounding each banding station ... 52
Figure 2.2: Example habitat suitability and permeability surfaces for each of
the four focal species surrounding the Spring Park banding station ... 53
Figure 2.3: Histograms representing the density of predicted habitat suitabilities
for each species across our study region ... 54
Figure 2.4: Standardized effect sizes describing the influence of habitat suitability
and permeability on the spatial distribution of resighted birds ... 55
Figure 3.1: Map our study region in metropolitan Washington, D.C. and
Neighborhood Nestwatch sampling locations ... 80
Figure 3.2: Apparent annual survival and detectability estimates across sites for
each of our focal species ... 81
Figure 3.3: Apparent annual survival of focal species across the rural-to-urban
xi
LIST OF ABBREVIATIONS AND SYMBOLS
AICC Akaike’s Information Criteria, adjusted for a small sample size
BCI Body condition index
CAN Canopy cover
CI Confidence interval
FD Functional diversity
IMP Impervious surface
NN Neighborhood Nestwatch
SES Standardized effect size
β Beta parameter estimate
1
CHAPTER 1: ENVIRONMENTAL FILTERING OF AVIAN COMMUNITIES ALONG A RURAL-TO-URBAN GRADIENT IN GREATER WASHINGTON D.C.
Introduction
The impact of urbanization on biological communities has become a subject of key
conservation concern in the 21st century. While urban environments make up just 5.6 percent of the land cover (US Census Bureau 2012), the shift from rural to urban land use is considered to be the second leading cause of species endangerment and extinction in the United States (Czech and Krausman 1997). Under current rates of urban expansion, developed land in the United States is projected to increase by 63% from 2001 to 2051. This increase is expected to drive a loss of more than 10% of habitat for one-third of the bird species currently at risk of extinction (Lawler et al. 2014) and thus urbanization is expected to become the most important driver of species extinction over this century (Marzluff 2001). Considering the rapid expansion of urban environments,
mitigating the projected loss in biodiversity is partially dependent on understanding how urbanization structures biological communities and the subsequent development of wildlife management strategies that incorporate urban ecosystems (Miller and Hobbs 2001).
2
environments, communities that occupy urban environments are often distinct from those that inhabit areas of lower human impact and tend to be dominated by higher densities of a few species able to persist in these habitats (e.g., Chace and Walsh 2006; McKinney 2006; Kark et al. 2007; Conole and Kirkpatrick 2011).
Patterns in avian community structure along the rural-to-urban gradient are thought to be determined largely by an interaction between land use and life history traits of associated species that determine whether a given species will be a “winner” (urban-adapted or urban-exploiter species) or “loser” in human-dominated landscapes (urban-avoiding species; McKinney and Lockwood 1999; Blair 2001). Species with specialist niche requirements are expected to be especially sensitive to human-induced habitat modification and may therefore experience high rates of local extinction across the urban habitat matrix (Devictor et al. 2007). For example, obligate insectivores (Lancaster and Rees 1979) and cavity nesting species (Blewett and Marzluff 2005) may be considerably
impacted by even minor modifications of the urban landscape, while species with omnivorous or generalist nesting habits are expected to be positive affected by, or even thrive, in urban
environments (reviewed in McKinney and Lockwood 1999). It is thus hypothesized that urban bird communities will exhibit "biotic homogenization" by which urban communities across
3
and functional diversity – the variation in life history traits associated with local communities – are expected to decline with increasing urbanization (e.g., Ortega-Alvarez and MacGregor-Fors 2009; Sol et al. 2014). While such declines are consistent with environmental filtering, species richness might vary along spatial gradients for other reasons (e.g., resource availability). Because any trend in richness could generate a parallel trend in functional diversity through a simple sampling effect, environmental filtering can only be inferred when using a metric of functional diversity that takes species richness into account (Petchey et al. 2007; Flynn et al. 2009).
A decline in species richness, and often an increase in abundance, across the rural-to-urban gradient has been a widely observed phenomenon across biogeographic regions (e.g., Jokimaki and Suhonen 1993; Clergeau et al. 1998; McKinney 2006), however, whether urbanization acts as an environmental filter on avian communities remains largely unclear. Although numerous studies have addressed avian community composition at varying intensities of urbanization (e.g., Lancaster and Rees 1979; Blair 1996; Crooks et al. 2004), comparably few studies have addressed the response of guilds to urbanization across the continuous rural-to-urban gradient (but see Crooks et al. 2004; Blair and Johnson 2008; Garaffa et al. 2009). Moreover, the associations between life history guilds and habitat characteristics may vary widely among biogeographic regions (Hansen and Urban 2002), thus guild-specific measures of environmental filtering in response to urbanization have often produced conflicting results (Evans et al. 2011). Attributing the response of individual guilds to environmental conditions are also confounded by joint membership of species across guilds, thus the response of a guild to urbanization necessitates accounting for the correlation structure between guilds across multiple niche axes (Croci et al. 2008).
4
vary by region and are confounded by collinearity, neither measure provide clear evidence for the filtering effect of urbanization. Functional diversity provides a metric of environmental filtering (e.g., among plant communities, see Coyle et al. 2014) that is insensitive to the response of individual guilds to urbanization and that can therefore can be broadly applied across regions despite
conflicting responses among life history guilds. While previous research has suggested that urban bird communities are filtered as a function of avian life history traits (notably Croci et al. 2008), no previous study has yet tested for environmental filtering by assessing the influence of urban land cover on the functional diversity of bird communities.
5
addressing the abundance, relative abundance, and collinearity between guilds provides a robust and novel analysis of both the extent and nature of environmental filtering in urban habitats.
Methods
Avian count data were collected as a part of the Neighborhood Nestwatch Program (NN), a citizen science project run by the Smithsonian Migratory Bird Center. NN has established a network of sampling sites within the Greater Washington D.C. metropolitan area with sampling
predominantly located at the homes of project participants. Project participants are accepted into the study based on a wide range of criteria, including level of interest, expected degree of engagement, and position along the rural-to-urban gradient, as assessed by the proportion of impervious surface relative to the impervious surface within our study region and that of existing sites. Habitats represented by study sites range from rural open and forested areas, to suburban and urban
environments. In order to more accurately characterize the rural-to-urban gradient within our study region, supplemental survey data were collected from an additional 30 randomly sampled sites (total sites = 203) from forested and core urban (> 50% impervious surface) habitats, habitat classes which were under-represented within the NN study (see Evans et al. 2015, Appendix A). Random sampling points were jittered to the nearest accessible location.
6
point count was sampled randomly from a given site for analysis. For each species observed, we evaluated guild representation across dietary, foraging, migratory, and nesting guilds (Table 1.1), obtained from the avian trait database compiled by Wilman et al. (2014) and supplemented when necessary with avian life history information from the Birds of North America (Rodewald et al. 2015).
We used the proportion of impervious surface to characterize the degree of urbanization of each site. While we acknowledge the proportion of impervious surface is just one component that can be used to approximate urban intensity, this proxy variable has been found to be predictive of avian demographic response to urbanization (see Ryder et al. 2010, Evans et al. 2015) and adequately reflects the variation in habitat distribution and quality across the rural-to-urban gradient (reviewed in McKinney 2002). Across our samples, impervious surface was highly predictive of core urban and suburban land cover types with sites at the rural end of the urbanization gradient predominantly comprised of agricultural or forested habitats (see Evans et. al 2015, Appendix A). We used the raster package in R (Hijmans 2014) to calculate the proportion of impervious surface (30 m resolution, Xian et al. 2011) within a 100 m neighborhood of each sampling location. Though the scale at which birds respond to the urban environment undoubtedly varies by species, this scale was chosen
because we expect that this radius is roughly representative of the territory used by most of the observed individuals in this study. Additionally, we examined community composition, functional diversity, and species richness (see below) at multiple radii, from 30 to 1000 m, and this scale of analysis was shown to have the greatest predictive capacity.
To estimate abundance, we adjusted count data for detectability using the R Package
7
open habitats are more readily observed, we calculated the proportional canopy cover within 50 m of the point count location and used this value as a continuous covariate for detection (Fry et al. 2011). Likewise, because bird activity and habitat associations vary considerably at different stages of the breeding cycle, we included the linear and quadratic terms of Julian day of the point count as a covariate for detectability (McClure and Hill 2012). Because the probability of detection is also dependent on the skill level of the observer, the technician who conducted the count was included as a detection covariate (Sauer et al. 1994). We calculated abundance for each guild and across guilds and used Akaike's Information Criteria, AICc, adjusted by the overdispersion parameter c-hat, to compare models that included only detection covariates and models that contained linear and quadratic terms for impervious surface (Burnham and Anderson 1998).
To test our prediction that species richness will decline with increasing urban land cover, we estimated site-level species richness using Chao's richness estimator (1984) and evaluated richness patterns across the rural-to-urban gradient in a generalized linear model framework in the R. Chao’s richness estimator accounts for imperfect detection within what is assumed to be a closed
8
We tested whether there is evidence for environmental filtering within our study region using the community classification tree method of Petchey and Gaston (2002). We constructed a trait matrix using life history traits expected to be predictive of avian response to urbanization (Table 1.1). Categorical traits (i.e., life history guilds) were reclassified as binary variables and weighted by the number of variables required to describe the trait (Laliberte and Legendre 2010). Species by trait distance matrices were calculated in the R package FD (Laliberte et al. 2014) using Gower distances between species, a distance calculation that allows for the combined use of continuous and
categorical variables (i.e., guild membership coded as asymmetric binary variables; Podani and Schmera 2006). We constructed a community classification tree for our regional species pool using hierarchical clustering in the vegan R package (Unweighted Pair Group Method with Arithmetic Mean; Oksanen et al. 2014; Legendre and Legendre 2008) and calculated the functional diversity (FD) for each community as the sum of branch lengths across species observed at a given site (Petchey and Gaston 2002). Because FD is positively correlated with species richness (Mouchet et al. 2010), we compared observed FD with a null distribution in which tip labels were randomly assigned (n = 104). This method maintains species richness while randomizing the species assigned to a given
tip (Petchey et al. 2007). We then calculated the standardized effect size (SES) for each site as the difference in summed branch lengths between observed and sampled communities divided by the standard deviation of sampled communities. Negative and positive SES values represent
9
generalized linear models of SES as a function of linear and quadratic terms of impervious surface and a null model of no effect.
We explored the influence of urbanization on avian guild associations to determine which traits best explain avian community composition across the rural-to-urban gradient. We calculated the relative abundances of guilds for a given life history trait (e.g., nesting guilds) at communities across the rural-to-urban gradient and used binomial regression (logit-link) to model variation in the relative abundances of each guild in response to urban land cover. AICc was used to compare models of linear and quadratic responses to impervious surface to a model of no effect of urban land cover. Because inference is limited by joint membership between guilds and among guilds and niche breadth axes, we explored the correlation structure across both sets of variables.
Results
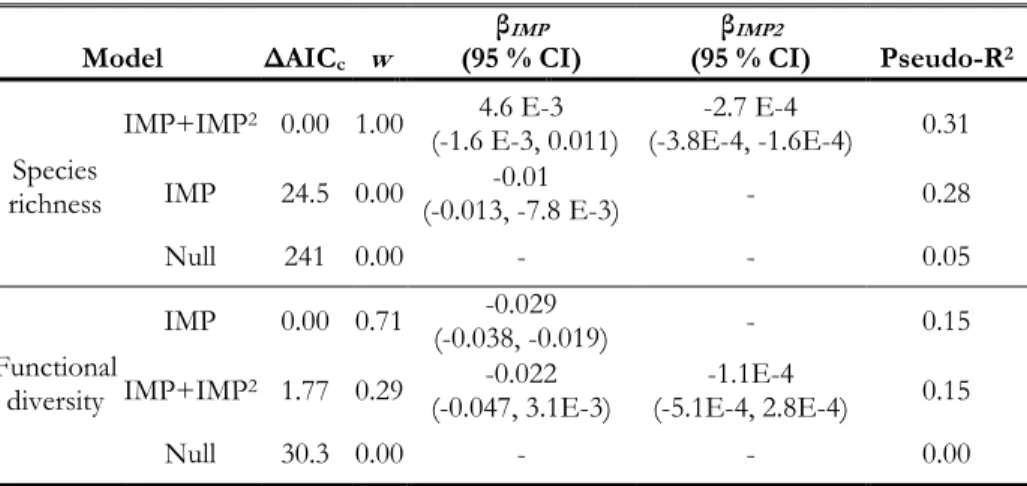
A total of 44 native bird species and 1,474 individual birds were observed across all sites and years (see Supplemental Table S1.1). Site-level Chao species richness estimates ranged from 5 to 61 species and averaged 18.8 species per site (±0.051). The data support the hypothesis that species richness decreases with increasing urban land cover. Richness estimates peaked at sites with low impervious surface and were their lowest at the most urban sites (Figure 1.1B, Table 1.2). There was considerable model support for a monotonic decline in functional diversity with increasing
impervious surface cover (Table 1.2, Figure 1.1C). This pattern supports our prediction that the influence of environmental filtering on avian community composition increases with increased urbanization even after accounting for species richness.
10
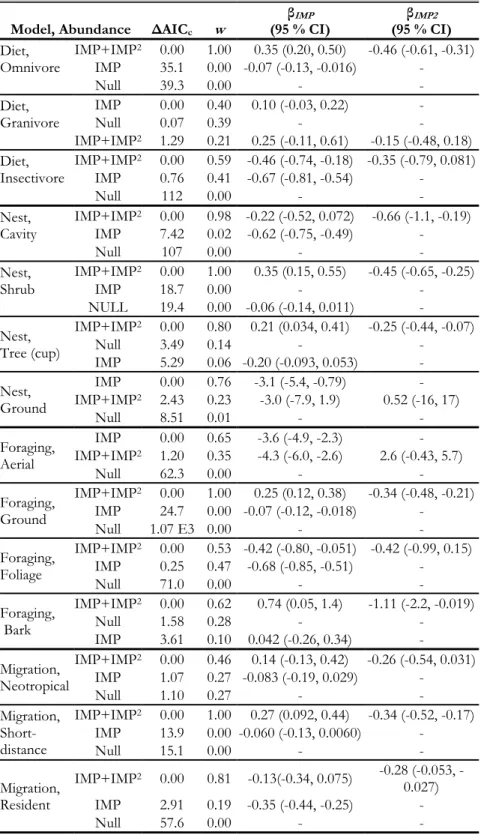
1.2). Insectivorous, foliage and aerial foragers, cavity nesting species, and residents each exhibited steep declines in estimated abundance with increasing urban land cover. Despite our expectations that omnivores and ground foraging species are positively associated with urbanization, the
estimated abundances of these species declined with increasing impervious surface. Likewise, while we expected granivores to be positively affiliated with urban environments, the null model that excluded impervious surface received equivalent model support to the model which showed an increase in the estimated abundance with increasing impervious surface for this guild. The estimated abundances of shrub and tree-nesting species, as well as short-distance and Neotropical migrants, exhibited moderate declines across the rural-to-urban gradient but there was no evidence for variation in the estimated abundance of bark foraging species with increasing impervious surface.
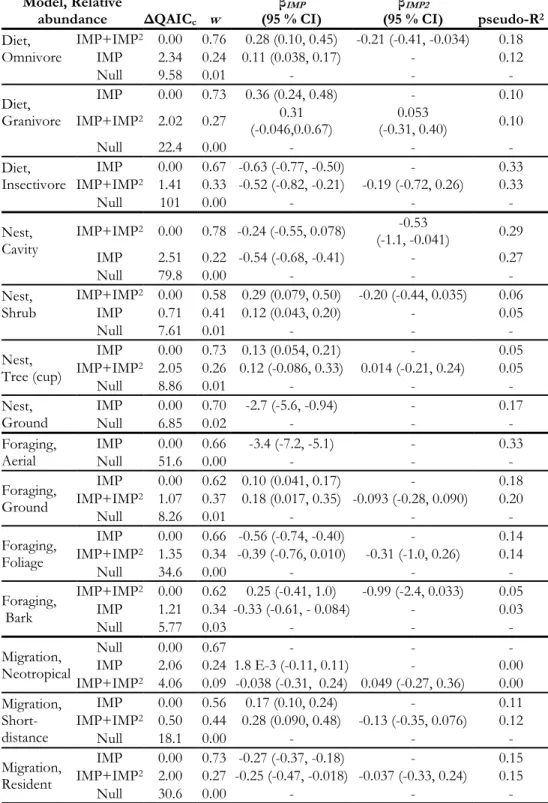
There were marked differences in the proportional composition of life history guilds across the rural-to-urban gradient (Table 1.4, Figure 1.3). Omnivores, which made up the largest
proportion of diet guilds throughout our study region, increased in relative abundance with
increasing impervious cover at the rural end of the urbanization gradient but exhibited levelled off as urban intensity increased. While granivores made up less than 10 percent of the avian community at rural sites, the relative abundance of this guild increased sharply with increasing urban land cover and the relative proportion of this guild was similar to that of omnivores at the most urban sites. Conversely, despite making up nearly 30 percent of the avian community at rural sites, insectivores declined to less than 5 percent of the community at the urban end of the impervious surface
11
foraging guilds. Resident and short-distance migrant species made up equivalent portions of bird communities as the rural end of the urbanization gradient, but exhibited an inverse relationship with impervious surface. Contrary to our expectations, resident species declined in relative abundance with increasing urbanization while short-distance migrants increased. Likewise, while we predicted that Neotropical migrants would be negatively influence by urbanization, there was no evidence of a relationship between the relative abundance and impervious surface, as the null model received the greatest model support for these species.
Discussion
12
Species Richness
We observed a decline in species richness with increasing urban land cover, a relationship that has been observed across numerous biogeographic regions (reviewed in Marzluff 2005). Several studies have documented a peak in species richness at intermediate portions of the rural-to-urban gradient (e.g., Blair 2001, Blair and Johnston 2008). This pattern is expected to be indicative of increased richness along ecotones, as avian assemblages are comprised of both urban sensitive and insensitive species at this portion of the gradient (Crooks et al. 2004). While the model of a quadratic relationship between richness and relative abundance was best supported by the data, we found no evidence that species richness was enhanced in suburban environments (Figure 1.1). This may in part be influenced by the removal of non-native species from our analysis. Urban environments have been found to support high densities of non-native species that are able to exploit urban and suburban habitats, such as the House Sparrow (Passer domesticus), due to life history characteristics (e.g., omnivorous dietary niche) that are expected to allow them to colonize this portion of the gradient (Lancaster and Rees 1979; Sol et al. 2012). Despite our removal of non-native species, however, there was no observable decline in species richness within exurban (5 - 20 percent impervious surface) or suburban portions of the urban gradient (30 to 50 percent impervious
13
Dietary guilds
Our results provide considerable evidence for species sorting based on avian dietary guilds in Greater Washington, D.C. suggesting that food resources may be an important determinant of the persistence of species in urban environments. We observed a decline in the relative abundance of insectivorous birds and an increase in the relative abundances of omnivorous and granivorous dietary guilds across the rural-to-urban gradient. In their review of the effects of urbanization on avian communities, Chace and Walsh (2006), found that urban environments select for omnivorous and granivorous dietary guilds. As the estimated abundance of each of the dietary guilds was
negatively associated with impervious surface, however, the observed variation in relative
abundances was largely driven by a steep decline in the estimated abundance of insectivorous birds. Indeed, a negative response of insectivores to urbanization has been a geographically widespread phenomenon. For example, Lim and Sodhi (2004) found a decline in insectivores in metropolitan Singapore and Sengupta et al. (2014) observed a similar loss of insectivores in urban environments in India despite high proportions of this guild within exurban landscape (but see Raupp et al. 2010). The substantial decline in the estimated abundance of insectivores suggests that, while urban environments may support higher relative abundances of omnivore and granivores, the dominance of these dietary guilds in previous studies is likely a result of the loss of insectivorous birds at urbanized sites rather than a benefit conferred to these guilds by urban land cover.
Foraging Guilds
14
foragers has been supported across a number of studies (e.g., Emlen 1974; Lancaster and Rees 1979; Johnston 2001), though we found no evidence that the abundance of ground foraging species varied across the rural-to-urban gradient. Likewise, while there was some evidence for a negative
association between the relative abundance of bark foraging species and urbanization, there was no evidence for variation in the absolute abundance of this guild with impervious surface.
Nesting Guilds
We observed a decline in the relative abundance of ground and cavity nesting birds and increase in the relative abundance of tree and shrub nesting guilds with increasing urban land cover. Additionally, there was considerable support for a decline in the absolute abundances of cavity nesting and ground nesting birds, though no evidence for a relationship between tree or shrub nesting birds and impervious surface. This suggests that shrub and tree nesting species may be insensitive to habitat composition in urban environments while cavity and ground nesting species may be filtered by urban land cover. Indeed, Blewett and Marzluff (2005) found that snags and standing dead trees in which cavity nesting species typically build nests, were absent from the
15
Migratory Status
The relative abundance of resident species of birds declined markedly with increasing urban land cover while that of short-distance migrants increased and Neotropical migrants showed no response to urbanization. The response of migratory guilds to impervious surface was contrary to our prediction that migrant bird species would decline with increasing urban land cover. Numerous studies have reported a negative association between the presence of Neotropical migrant birds and urbanization (e.g., Stratford and Robinson 2005) and several studies (e.g., McKinney and Lockwood 1999; Kark et al. 2007; Rodewald and Bakermans 2011) have suggested that resident life histories are one of the key features that defines urban-adapted species (but see Evans et al. 2011). For example, Rodewald and Bakermans (2006) found that resident species increased in abundance with increasing urban land cover surrounding riparian forests while the abundance of Neotropical migrant birds were negatively associated. Our ability to detect the influence of urban land cover may have been masked by high abundances of Gray Catbird (Dumetella carolinensis), an omnivorous species that made up more than 50 percent of the abundance of Neotropical migrants and show no observable response to urban land cover. Likewise, while short-distance migrants were shown to increase in relative abundance with increasing urbanization, almost all of the individuals that comprise this migratory guild were American Robin, American Crow (Corvus brachyrhynchos), Fish Crow (Corvus ossifragus), and Common Grackle (Quiscalus quiscula) species that also showed no response to, or even
an affinity for, urban land cover.
Across guilds, a clear limitation to our analysis was the extent of co-membership represented by life history guilds across traits (Figure 1.4). Our ability to detect the response of migratory species to urban land cover may have been hindered by co-membership across guilds. Indeed, while
16
and relative abundance, nearly half of the observed resident species were insectivorous and more than half were cavity nesters – both of these guild were shown to decline across the rural-to-urban gradient. Likewise, all five of the aerial foragers and seven of the eleven foliage foragers are
insectivorous. While this does not negate the potential impact of foraging strategy on avian community structure, it is impossible to distinguish the response of the foraging strategy for these guilds separately from the apparent influence of dietary niche as evaluated. While methodologies exist to determine the influence of individual traits on community structure, the paucity of individuals observed at a given site, undoubtedly due to low detection probabilities for a given sample, limited our ability to employ these methods (see Legendre et al. 1997, Shipley et al. 2006, Brown et al. 2014, Warton et al. 2015).
Conclusion
Several key results in our study suggest that urban environments filter avian communities as a function of their traits. We observed a decline in species richness and decline in functional diversity across the gradient. Likewise, emergent patterns in avian community structure suggest that some life history traits, especially insectivory, were found to be strongly associated with the sensitivity of species to urbanization processes. As such, our results show that development intensity, as measured by impervious surface, is strongly related to avian guild structure and thus observed declines in species richness across the rural-to-urban gradient likely results from environmental filtering by life history traits.
17
2009). While impervious surface provides a gradient of development intensity (Marzluff 2001), urbanization occurs at multiple spatiotemporal scales through which human socioeconomic and environmental systems are linked (Grimm et al. 2008). Landscape context, for example, has been found to considerably influence avian community assembly — thus analysis of bird communities at one scale may miss key features driving avian response at others (Melles et al. 2003). Moreover, the quality of available bird habitat may vary considerably along the urbanization gradient. For example, Degraaf and Wentworth (1986) found that suburban habitats with mature shrubs and native trees supported higher densities of insectivorous birds, with the type of shrubs and trees present, rather than the proportional cover or even size of tree, the best determinant of insectivorous species abundance. Similarly, White et al. (2005) found significantly higher abundances of insectivores in streetscapes composed of native tree species than exotic streetscapes. As our study shows strong associations but considerable variation in avian community assembly across the impervious surface gradient, further analysis of how landscape context, features of local habitat structure and
18
TABLES
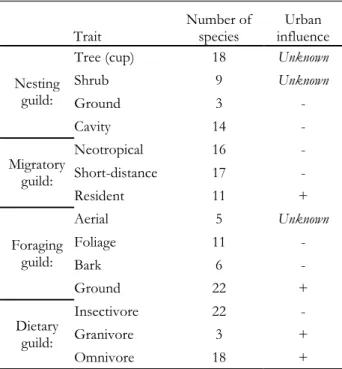
Table 1.1. Life history traits evaluated in this study, the number of species observed for life history guilds, and the expected response to urbanization.
Trait Number of species influence Urban
Nesting guild:
Tree (cup) 18 Unknown
Shrub 9 Unknown
Ground 3 -
Cavity 14 -
Migratory guild:
Neotropical 16 -
Short-distance 17 -
Resident 11 +
Foraging guild:
Aerial 5 Unknown
Foliage 11 -
Bark 6 -
Ground 22 +
Dietary guild:
Insectivore 22 -
Granivore 3 +
19
Table 1.2. Model selection table for models of species richness and functional diversity by impervious surface with estimates for beta coefficients and proportion of explained deviance.
Model ΔAICc w
βIMP
(95 % CI) (95 % CI) βIMP2 Pseudo-R2
Species richness
IMP+IMP2 0.00 1.00 4.6 E-3
(-1.6 E-3, 0.011) (-3.8E-4, -1.6E-4) -2.7 E-4 0.31 IMP 24.5 0.00 (-0.013, -7.8 E-3) -0.01 - 0.28
Null 241 0.00 - - 0.05
Functional diversity
IMP 0.00 0.71 (-0.038, -0.019) -0.029 - 0.15
IMP+IMP2 1.77 0.29 -0.022
(-0.047, 3.1E-3) (-5.1E-4, 2.8E-4) -1.1E-4 0.15
20
Table 1.3. Model selection table for models of abundance of life history guilds by impervious surface with estimates for beta coefficients.
Model, Abundance ΔAICc w
βIMP
(95 % CI) (95 % CI) βIMP2
Diet, Omnivore
IMP+IMP2 0.00 1.00 0.35 (0.20, 0.50) -0.46 (-0.61, -0.31)
IMP 35.1 0.00 -0.07 (-0.13, -0.016) -
Null 39.3 0.00 - -
Diet, Granivore
IMP 0.00 0.40 0.10 (-0.03, 0.22) -
Null 0.07 0.39 - -
IMP+IMP2 1.29 0.21 0.25 (-0.11, 0.61) -0.15 (-0.48, 0.18)
Diet, Insectivore
IMP+IMP2 0.00 0.59 -0.46 (-0.74, -0.18) -0.35 (-0.79, 0.081)
IMP 0.76 0.41 -0.67 (-0.81, -0.54) -
Null 112 0.00 - -
Nest, Cavity
IMP+IMP2 0.00 0.98 -0.22 (-0.52, 0.072) -0.66 (-1.1, -0.19)
IMP 7.42 0.02 -0.62 (-0.75, -0.49) -
Null 107 0.00 - -
Nest, Shrub
IMP+IMP2 0.00 1.00 0.35 (0.15, 0.55) -0.45 (-0.65, -0.25)
IMP 18.7 0.00 - -
NULL 19.4 0.00 -0.06 (-0.14, 0.011) -
Nest, Tree (cup)
IMP+IMP2 0.00 0.80 0.21 (0.034, 0.41) -0.25 (-0.44, -0.07)
Null 3.49 0.14 - -
IMP 5.29 0.06 -0.20 (-0.093, 0.053) -
Nest, Ground
IMP 0.00 0.76 -3.1 (-5.4, -0.79) - IMP+IMP2 2.43 0.23 -3.0 (-7.9, 1.9) 0.52 (-16, 17)
Null 8.51 0.01 - -
Foraging, Aerial
IMP 0.00 0.65 -3.6 (-4.9, -2.3) - IMP+IMP2 1.20 0.35 -4.3 (-6.0, -2.6) 2.6 (-0.43, 5.7)
Null 62.3 0.00 - -
Foraging, Ground
IMP+IMP2 0.00 1.00 0.25 (0.12, 0.38) -0.34 (-0.48, -0.21)
IMP 24.7 0.00 -0.07 (-0.12, -0.018) -
Null 1.07 E3 0.00 - -
Foraging, Foliage
IMP+IMP2 0.00 0.53 -0.42 (-0.80, -0.051) -0.42 (-0.99, 0.15)
IMP 0.25 0.47 -0.68 (-0.85, -0.51) -
Null 71.0 0.00 - -
Foraging, Bark
IMP+IMP2 0.00 0.62 0.74 (0.05, 1.4) -1.11 (-2.2, -0.019)
Null 1.58 0.28 - -
IMP 3.61 0.10 0.042 (-0.26, 0.34) -
Migration, Neotropical
IMP+IMP2 0.00 0.46 0.14 (-0.13, 0.42) -0.26 (-0.54, 0.031)
IMP 1.07 0.27 -0.083 (-0.19, 0.029) -
Null 1.10 0.27 - -
Migration, Short-distance
IMP+IMP2 0.00 1.00 0.27 (0.092, 0.44) -0.34 (-0.52, -0.17)
IMP 13.9 0.00 -0.060 (-0.13, 0.0060) -
Null 15.1 0.00 - -
Migration, Resident
IMP+IMP2 0.00 0.81 -0.13(-0.34, 0.075) 0.28 (0.053,
-0.027) IMP 2.91 0.19 -0.35 (-0.44, -0.25) -
21
Table 1.4. Model selection table for models of relative abundance of life history guilds by impervious surface with estimates for beta coefficients and proportion of explained deviance.
Model, Relative
abundance ΔQAICc w
βIMP
(95 % CI) (95 % CI) βIMP2 pseudo-R2
Diet, Omnivore
IMP+IMP2 0.00 0.76 0.28 (0.10, 0.45) -0.21 (-0.41, -0.034) 0.18
IMP 2.34 0.24 0.11 (0.038, 0.17) - 0.12
Null 9.58 0.01 - - -
Diet, Granivore
IMP 0.00 0.73 0.36 (0.24, 0.48) - 0.10 IMP+IMP2 2.02 0.27 0.31
(-0.046,0.0.67) (-0.31, 0.40) 0.053 0.10
Null 22.4 0.00 - - -
Diet, Insectivore
IMP 0.00 0.67 -0.63 (-0.77, -0.50) - 0.33 IMP+IMP2 1.41 0.33 -0.52 (-0.82, -0.21) -0.19 (-0.72, 0.26) 0.33
Null 101 0.00 - - -
Nest, Cavity
IMP+IMP2 0.00 0.78 -0.24 (-0.55, 0.078) -0.53
(-1.1, -0.041) 0.29 IMP 2.51 0.22 -0.54 (-0.68, -0.41) - 0.27
Null 79.8 0.00 - - -
Nest, Shrub
IMP+IMP2 0.00 0.58 0.29 (0.079, 0.50) -0.20 (-0.44, 0.035) 0.06
IMP 0.71 0.41 0.12 (0.043, 0.20) - 0.05
Null 7.61 0.01 - - -
Nest, Tree (cup)
IMP 0.00 0.73 0.13 (0.054, 0.21) - 0.05 IMP+IMP2 2.05 0.26 0.12 (-0.086, 0.33) 0.014 (-0.21, 0.24) 0.05
Null 8.86 0.01 - - -
Nest, Ground
IMP 0.00 0.70 -2.7 (-5.6, -0.94) - 0.17
Null 6.85 0.02 - - -
Foraging,
Aerial IMPNull 0.00 0.66 51.6 0.00 -3.4 (-7.2, -5.1) - - - 0.33 -
Foraging, Ground
IMP 0.00 0.62 0.10 (0.041, 0.17) - 0.18 IMP+IMP2 1.07 0.37 0.18 (0.017, 0.35) -0.093 (-0.28, 0.090) 0.20
Null 8.26 0.01 - - -
Foraging, Foliage
IMP 0.00 0.66 -0.56 (-0.74, -0.40) - 0.14 IMP+IMP2 1.35 0.34 -0.39 (-0.76, 0.010) -0.31 (-1.0, 0.26) 0.14
Null 34.6 0.00 - - -
Foraging, Bark
IMP+IMP2 0.00 0.62 0.25 (-0.41, 1.0) -0.99 (-2.4, 0.033) 0.05
IMP 1.21 0.34 -0.33 (-0.61, - 0.084) - 0.03
Null 5.77 0.03 - - -
Migration, Neotropical
Null 0.00 0.67 - - -
IMP 2.06 0.24 1.8 E-3 (-0.11, 0.11) - 0.00 IMP+IMP2 4.06 0.09 -0.038 (-0.31, 0.24) 0.049 (-0.27, 0.36) 0.00
Migration, Short-distance
IMP 0.00 0.56 0.17 (0.10, 0.24) - 0.11 IMP+IMP2 0.50 0.44 0.28 (0.090, 0.48) -0.13 (-0.35, 0.076) 0.12
Null 18.1 0.00 - - -
Migration, Resident
IMP 0.00 0.73 -0.27 (-0.37, -0.18) - 0.15 IMP+IMP2 2.00 0.27 -0.25 (-0.47, -0.018) -0.037 (-0.33, 0.24) 0.15
22
FIGURES
23
Figure 1.2. Estimated abundance of diet, foraging, nesting, and migratory guilds (rows A through D, respectively) as a function of the proportion of impervious surface within 100 m of each point count. The model estimates for the bark foraging guild are not shown.
A
B
C
24
25
26
WORKS CITED
Beissinger, S.R., and D.R. Osborne. 1982. Effects of urbanization on avian community organization. Condor 84:75–83.
Blair, R. B. 1996. Land use and avian species diversity along an urban gradient. Ecological Applications 6:506–519.
Blair RB. 2001. Birds and butterflies along urban gradients in two ecoregions of the U.S. Pages. 33-56. in Lockwood JL, McKinney ML, eds. Biotic Homogenization. Norwell (MA): Kluwer. Blair, R.B. and E.M. Johnson. 2008. Suburban habitats and their role for birds in the urban–rural
habitat network: points of local invasion and extinction? Landscape Ecology 23: 1157-1169. Blewett, C.M. and J.M. Marzluff. 2005. Effects of urban sprawl on snags and the abundance and
productivity of cavity-nesting birds. The Condor 107: 678-693.
Brown, A.M., D.I. Warton, N.R. Andrew, M. Binns, G. Cassis, and H. Gibb. 2014. The fourth-corner solution – using predictive models to understand how species traits interact with the environment. Methods in Ecology and Evolution 5: 344–352.
Burnham, K.P. and D.R. Anderson. 1998. Model selction and inference: a practical information-theoretic approach. Springer-Verlag, New York, USA.
Chace, J.F. and J.J. Walsh. 2006. Urban effects of native avifauna: a review. Landscape and Urban Planning 74: 46-69.
Chao, A. 1984. Nonparametric estimation of the number of classes in a population. Scandinavian Journal of Statististics 11: 265-270.
Clergeau, P., J.P.L. Savard, G. Mennechez, and G. Falardeau. 1998. Bird abundance and diversity along an urban–rural gradient: a comparative study between two cities on different continents. Condor 100:413–425.
Clergeua, P., J. Jokimaki, and J.P.L. Savard. 2001. Are urban bird communities influenced by the bird diversity of adjacent landscapes? Journal of Applied Ecology 38: 1122-1134.
Conole, L.E. and J.B. Kirkpatrick. 2011. Functional and spatial differentiation of urban bird assemblages at the landscape scale. Landscape and Urban Planning 100: 11-23.
Coyle, J.R., F.W. Halliday, B.E. Lobez, K.A. Palmquist, P.A. Wilfahrt, and A.H. Hurlbert. 2014. Using trait and phylogenetic diversity to evaluate the generality of the stress-dominance hypothesis in eastern North American tree communities. Ecography 37: 814-826. Croci, S., A. Butet, and P. Clergeau. 2008. Does urbanization filter birds on the basis of their
biological traits? The Condor 110: 223-240.
27
Czech, B., and P. R. Krausman. 1997. Distribution and causation of species endangerment in the United States. Science 277:1116–1117.
DeGraaf, R. M. and J. M. Wentworth 1986. Avian guild structure and habitat associations in suburban bird communities. Urban Ecol. 9:399–412.
Devictor, V., R. Julliard, D. Couvet, A. Lee, and F. Jiguet. 2007. Functional homogenization effect of urbanization on bird communities. Conservation Biology 21: 741-751.
Emlen, J.T., 1974. An urban bird community in Tucson, Arizona: derivation, structure, regulation. Condor, 76: 184-197.
Evans, B.S., T.B. Ryder, Reitsma, R., Hurlbert, A.H., and P.P. Marra. 2014. Characterizing avian survival along a rural-to-urban land use gradient. Ecology 96: 1631–1640.
Evans, K.L., S.E. Newson, and K.J. Gaston. 2008. Habitat influences on urban avian assemblages. Ibis 151: 19-39.
Evans, K.L., D.E. Chamberlain, B.J. Hatchwell, R.D. Gregory, and K.J. Gaston. 2011. What makes an urban bird? Global Change Biology 17: 32-44.
Fernández-Juricic, E. 2004. Spatial and temporal analysis of the distribution of forest specialists in an urban-fragmented landscape (Madrid, Spain): implications for local and regional bird
conservation. Landscape and Urban Planning 69: 17-32.
Fiske, I. and R. Chandler. 2011. unmarked: An R Package for fitting hierarchical models of wildlife occurrence and abundance. Journal of Statistical Software 43: 1-23.
Flynn D.F.B, M. Gogol-Prokurat, T. Nogeire, N. Molinari, B. Trautman Richers, B.B. Lin,
N. Simpson, M.M. Mayfield, and F. DeClerck. 2009. Loss of functional diversity under land use intensification across multiple taxa. Ecology Letters 12:22–33.
Garaffa, P.I., J. Fillory, and M. Isabel Bellocq. 2009. Bird community responses along urban-rural gradients: Does the size of the urbanized area matter? Landscape and Urban Planning 90: 33-41.
Gavareski, C. A. 1976. Relation of park size and vegetation to urban bird populations in Seattle, Washington. Condor: 375-382.
Goslee, S.C. and D.L. Urban. 2007. The ecodist package for dissimilarity-based analysis of ecological data. Journal of Statistical Software 22:1-19.
Gotelli, N.J. and D.J. McCabe. 2002. Species co-occurrence: a meta-analysis of J. M. Diamond’s assembly rules model. Ecology 83: 2091–2096.
Grimm, N.B., S.H. Faeth, N.E. Golubiewski, C.L. Redman, J. Wu, X. Bai, X., and J.M. Briggs. 2008. Global change and the ecology of cities. Science 319: 756-760.
28
Hijmans R.J. 2015. raster: Geographic Data Analysis and Modeling. R package version 2.3-40. http://CRAN.R-project.org/package=raster
Hurlbert, A.H. and E.P. White. 2005. Disparity between range map- and survey-based analyses of species richness: patterns, processes and implications. Ecology Letters 8:319-327.
Johnston, R.F. 2001. Synanthropic birds of North America. Pages. 49-67. in Marzluff JM, Bowman R., Donnelly R., eds. Avian Ecology in an Urbanizing World. Norwell (MA): Kluwer. Jokimaki J. and J. Suhonen. 1993. Effects of urbanization on the breeding bird species richness in
Finland: a biogeographical comparison. Ornis Fennica 70: 71-77.
Jokimaki, J. and E. Huhta. 2000. Artificial nest predation and abundance of birds along an urban gradient. The Condor 102: 838-847.
Jokimaki, J., J. Suhonen, M.L. Jokimaki-Kaisanlahti, and P. Carbo-Ramirez. 2014. Effects of urbanization on breeding birds in European towns: impacts of species traits. Urban Ecosystems.
Kark, S., A. Iwaniuk, A. Schalimtzek, and E. Banker. 2007. Living in the city: can anyone become an ‘urban exploiter’? Journal of Biogeography 34:638–651.
Kuussaari M., Bommarco R., Heikkinen R.K., Helm A., Krauss J., Lindborg R., Ockinger E., Partel M., Pino J., Roda F., Stefanescu C., Teder T., Zobel M., and I. Steffan-Dewenter. 2009. Extinction debt: a challenge for biodiversity conservation. Trends in Ecology & Evolution 24:564–571.
Lancaster R.K. and W.E. Rees. 1979. Bird communities and the structure of urban habitats. Canadian Journal of Zoology. 57: 2358-2368.
Lawler, J.J., D. J. Lewis, E. Nelson, A.J. Plantinga, S. Polasky, J.C. Withey, D.P. Helmers, S.
Martinuzzi, D. Pennington, and V.C. Radeloff. 2014. Projected land-use change impacts on ecosystem services in the United States PNAS 111: 7492-7497.
Legendre, P., R. Galzin, and M.L. Harmelin-Vivien. 1997. Relating behavior to habitat: solutions to the fourth-corner problem. Ecology 78: 547–562.
Lim, H.C. and N.S. Sodhi. 2004. Responses of avian guilds to urbanisation in a tropical city. Landscape and Urban Planning 66: 199-215.
Luck, G.W. and L.T. Smallbone. 2011. The impact of urbanization on taxonomic and functional similarity among bird communities. Journal of Biogeography 38: 849-906.
Mason, N.W.H., F. Bello, D. Mouillot, S. Pavoine, and S. Dray. 2013. A guide for using functional diversity indices to reveal changes in assembly processes along ecological gradients. Journal of Vegetation Science 24: 794-806.
29
J.M. Marzluff and R. Sallabanks, editors. Avian conservation: research and management. Island Press, Washington, D.C., USA.
Marzluff, J. M. 2001. Worldwide urbanization and its effects on birds. Pages 19-47 in J. M. Marzluff, R. Bowman, and R. Donnelly, editors. Avian ecology in an urbanizing world. Kluwer
Academic, Norwell, Massachusetts, USA.
Marzluff, J.M. 2005. Island biogeography for an urbanizing world: how extinction and colonization may determine biological diversity in human-dominated landscapes. Urban Ecosystems 8: 157-177.
McClure , C.J. and G.E. Hill. 2012. Dynamic versus static occupancy: how stable are habitat associations through a breeding season? Ecosphere 3: 1-13.
McKinney, M.L. and J.L. Lockwood. 1999. Biotic homogenization: a few winners replacing many losers in the next mass extinction. Trends in ecology & evolution 14: 450-453.
McKinney, M.L. 2002. Urbanization, Biodiversity, and Conservation The impacts of urbanization on native species are poorly studied, but educating a highly urbanized human population about these impacts can greatly improve species conservation in all ecosystems. BioScience 52: 883-890.
McKinney, M.L. 2006. Urbanization as a major cause of biotic homogenization. Biological conservation 127: 247-260.
Melles, S., S. Glenn, and K. Martin. 2003. Urban bird diversity and landscape complexity: Species-environmment associations along a multiscale habitat gradient. Conservation Ecology 7: 5. Miller, J.R. and R.J. Hobbs. 2001. Conservation where people live and work. Conservation Biology
16: 330-337.
Mouchet, M. A., S. Villeger, N.W.H. Mason, and D. Mouillot.2010. Functional diversity measures: an overview of their redundancy and their ability to discriminate community assembly rules. Functional Ecology 24: 867-876.
Ortega-Álvarez, R. and I. MacGregor-Fors. 2009. Living in the big city: effects of urban land-use on bird community structure, diversity, and composition. Landscape and Urban Planning 90: 189-195.
Petchey, O.L. and K.J. Gaston. 2002. Functional diversity (FD), species richness and community composition.Ecology Letters 5: 402-411.
Petchey, O.L., K.L. Evans, I.S. Fishburn, and K.J. Gaston. 2007. Low functional diversity and no redundancy in British avian assemblages. Journal of Animal Ecology 76: 977-985.
30
Raupp, M.J., P.M. Shrewsberry, and D.A. Herms. Ecology of Herbivorous Arthropods in Urban Landscapes. 2010. Annual Review of Entomology 55: 19-38.
Rodewald, A.D. and M.H. Bakermans. 2006. What is the appropriate paradigm for riparian forest conservation? Biological Conservation 128: 193-200.
Rodewald, A.D. and D.P. Shustack. 2008. Urban flight: understanding individual and population-level responses of Nearctic-Neotropical migratory birds to urbanization. Journal of Animal Ecoloogy 77: 83-91.
Rodewald, P. (Editor). 2015. The Birds of North America Online:
http://bna.birds.cornell.edu/BNA/. Cornell Laboratory of Ornithology, Ithaca, NY. Ryder, T. B., Reitsma, R., Evans, B., and P.P. Marra. 2010. Quantifying avian nest survival along an
urbanization gradient using citizen-and scientist-generated data. Ecological Applications 20: 419-426.
Sauer, J. R., Peterjohn, B. G., and W.A. Link. 1994. Observer differences in the North American Breeding Bird Survey. The Auk, 111: 50-62.
Sengupta, S., M. Mondal, and P. Basu. 2014. Bird species assemblages across a rural urban gradient around Kolkata, India. Urban Ecosystems 17: 585-596.
Shipley, B., D. Vile, and E. Garnier. 2006. From plant traits to plant communities: a statistical mechanistic approach to biodiversity. Science 314: 812–814.
Smouse, P.E., J.C. Long, and R.R. Sokal. 1986. Multiple regression and correlation extensions of the Mantel test of matrix correspondence. Systematic Zoology 35: 627-632.
Sol, D., I. Bartomeus, and A.S. Griffin. 2012. The paradox of invasion in birds: competitive superiority or ecological opportunism? Oecology 169: 553-564.
Sol, D., C. Gonzalez-Lagos, D. Moriera, J. Maspons, and O. Lapiedra. 2014. Urbanisation tolerance and the loss of avian diversity. Ecology Letters 17: 942-950.
Stratford, J.A. and W.D. Robinson. 2005. Distribution of neotropical migratory bird species across an urbanizing landscape. Urban Ecosystems 8: 59-77.
U.S. Census Bureau. 2012. Statistical abstracts of the United States. GPO, Washington, D.C., USA. Walther, B.A. and J.L. Martin. 2001. Species richness estimation of bird communities: How to
control for sampling effort? Ibis 143: 413-419.
Warton, D.I., B. Shipley, and T. Hastie. 2015. CATS regression – a model-based approach to studying trait-based community assembly. Methods in Ecology and Evolution 6: 389-398. White, J.G. M.J. Antos, J.A. Fitzsimons, G.C. Palmer. 2005. Non-uniform bird assemblages in urban
31
Wilman, H., J. Belmaker, J. Simpson, C. de la Rosa, M. Rivadeneira, and W. Jetz. 2014. EltonTraits 1.0: Species-level foraging attributes of the world’s birds and mammals. Ecological Archives E095-178.
32
CHAPTER 2: DISPERSAL IN THE URBAN MATRIX: ASSESSING THE INFLUENCE OF LANDSCAPE PERMIABILITY ON THE SETTLEMENT PATTERNS OF
BREEDING SONGBIRDS
Introduction
Habitat fragmentation is considered to be one of the primary mechanisms through which the expansion of urban environments has led to a global decline in biodiversity since the middle of the twentieth century (McKinney 2002). As habitats are modified, the area associated with available high quality habitat is often reduced for many species as is the permeability of the landscape thus impeding movement and dispersal of individuals– a process that functionally isolates individuals and populations from portions of the landscape (Andren 1994, Moilanen and Nieminen 2002). The movement of individuals between birthplace and first breeding location (natal dispersal) or between successive breeding locations (breeding dispersal), is seen as critical for the persistence of
metapopulations by linking local populations and permitting gene flow across a landscape (Levins 1969, Beier and Noss 1998, Hanski 1999, Clobert 2001, Moilanen and Nieminen 2002). As human-built habitats likely influence patterns of dispersal in many urbanized regions, determining how organisms disperse through such environments provides an important tool for understanding the influence of human-dominated landscapes on wildlife populations (Crooks and Sanjayan 2006).
33
the condition of individuals and thus the establishment of breeding territories in subsequent years (i.e., carry-over effects, e.g., Studds et al. 2012, Rushing et al. 2015). Even among resident species, costs associated with one stage of dispersal influence subsequent stages as the condition of an individual prior to emigration, the path taken to new breeding locations, and the success of an individual following settlement are interdependent (Stamps et al. 2005, Clobert et al. 2009). For successful dispersal, the benefits of establishing new territories must outweigh the costs associated with increased predation risk, stress, and energy depletion for dispersing individuals (Greenwood and Harvey 1982). While both emigration and settlement are thought to be a function of conspecific density, patch size, predation pressure, and habitat quality, movement is dependent on an organism’s perception of the landscape and the ability of an individual to move through the inter-patch matrix (landscape permeability, Baguette and Van Dyck 2007). As such, both the physical arrangement of habitat patches across the landscape and the quality of the inter-patch matrix are expected to be key determinants of whether individuals can successfully disperse between patches (Opdam et al. 1985, Urban and Keitt 2001, Bélisle 2005).
The influence of habitat fragmentation on the movement of organisms has often been considered largely a function of the physical distance between resource patches and the arrangement of those patches within a given landscape (Haila 2002, Ewers and Didham 2006). The extent to which movement may be facilitated or impeded by the resources and conditions associated with the landscape matrix in which habitat patches are embedded has increasingly been recognized as
34
had high permeability for the American Mink (Mustela vison) and low permeability for the
Prothonotary Warbler (Protonotaria citrea) due to their differential dispersal abilities. Even within a species, movement behavior in response to landscape configuration has been found to vary by age, sex, and position of individuals within a given habitat patch (reviewed in Debinski and Holt 2000).
An organism’s response to the landscape during dispersal is also expected to be dependent on its life history traits as well as landscape specific costs and benefits associated with movement, settlement, and the deferred costs following dispersal events (Stamps et al. 2005, Bonte et al. 2012, Burgess et al. 2012). Dispersal events that incorporate exploratory behaviors are expected to
minimize dispersal costs as exploration increases the efficiency by which individuals settle in suitable habitat, thus reducing the risk of unsuccessful dispersal – though the increased time spent during dispersal may increase the probability of mortality during dispersal events (Conradt et al. 2003, Baguette et al. 2012). During such dispersal events, it is expected that the distance travelled, the path taken between patches, and settlement decisions will be strongly affected by the distribution and quality of habitat encountered by dispersing individuals (Van Dyck and Baguette 2005). Because of this, patches of suitable habitat that are spatially isolated or located within a matrix of low habitat quality are expected to have a lower probability of settlement. Conversely, if the distance between patches exceeds the perceptual range for a given species or patches are embedded within a low quality matrix, directed dispersal events are expected to predominate and intervening land cover will have little effect on dispersal distance or route (Wolff et al. 1997, Mennechez et al. 2003). Such directed dispersal events may be more energetically costly for dispersing individuals and increase the risk of unsuccessful dispersal despite reducing the risk of mortality during dispersal (Zollner and Lima 1999, Conradt et al. 2003, Bonte et al. 2012).
35
fragmented landscapes. For example, previous research has demonstrated behavioral avoidance of forest bird species in crossing open habitats (i.e., gap-crossing decisions) between forested patches using simulated territorial intrusion (Awade and Metzger 2008), predation threat (Belisle and
Desrochers 2002), and radio-telemetry (Bayne and Hobson 2001). Patterns of seed dispersal by birds have provided proximate evidence that birds utilize corridors of habitat when moving across
fragmented landscapes (e.g., Haddad et al. 2003, Carlo et al. 2013). Over larger spatial extents, translocation experiments have provided some evidence for the influence of matrix habitat and the distribution of patches on avian movement (e.g., Kennedy and Marra 2010). At still larger scales, graph models have provided a link between a bird dispersal behavior and the distribution of habitats across landscapes (Bunn et al. 2000, Urban and Keitt 2001, Minor and Urban 2008), however, the applicability of graph models is dependent on the patchiness of the landscape and may be difficult to apply in landscapes with large contiguous patches (Minor E.S., personal communication). Despite
evidence that land cover mediates movement, however, there are comparatively few studies that empirically link movement and land cover to dispersal events in urban environments (but see Delgado et al. 2010).
Here, we consider the dispersal of four common songbird species to the rural-to-urban gradient of the Eastern United States across landscapes of varying development intensity. Our study species, which include the American Robin (Turdus migratorius), the Gray Catbird (Dumetella
carolinensis), House Sparrow (Passer domesticus), and Northern Cardinal (Cardinalis cardinalis), represent
36
influences dispersal and settlement patterns by assessing the distribution of previously marked individuals within a 1.5 km radius of six banding stations in the Washington D.C. metropolitan area. We predicted that sites with higher permeability to the banding station will have a higher likelihood of settlement. Because events outside of the breeding landscape have been found to strongly influence the settlement patterns of migrant species (e.g., Rushing et al. 2015), we expected that permeability will be a stronger determinant of the settlement patterns for residents. To test this prediction for each species and landscape, we constructed models of habitat suitability and structural permeability and compared the models of dispersal in which the probability of settlement is
weighted towards sites with a higher degree of permeability with those in which likelihood of settlement is associated with the suitability of the settlement site or distributed randomly. We
assessed within-species variation in dispersal by evaluating whether there are observed differences in dispersal distance, landscape permeability, and suitability of settlement sites between age classes and sexes. We further examined the influence of land cover on movement by conducting a translocation experiment across landscapes of differing land use intensity with one of our focal species, the resident Northern Cardinal.
Methods
37
locations were selected at random from each directional and distance bin with the number of samples per bin stratified by distance such that an equal proportional area was sampled within each bin. As our study region is predominantly composed of privately-owned land, the sample locations were adjusted to the nearest accessible area and a minimum distance of 100 m was maintained between samples. A minimum of twenty minutes was spent searching for color-banded birds within an area of 50 m from the center of the sample using playback of conspecific song and mobbing calls. Re-sighted birds were identified by color bands and their location was recorded using a handheld GPS. Birds resighted during the same year in which they were banded were not included in this analysis.
To evaluate the influence of habitat permeability on settlement patterns, we estimated habitat suitability using point count data and land cover metrics expected to be representative of habitat preference. Point counts were conducted during the breeding season between 2009 and 2012 by technicians as a part of the Neighborhood Nestwatch program at 222 sites across the rural-to-urban gradient within the Washington D.C. metropolitan area (for full description of point count methodology, see Evans 2015, Chapter 1). All spatial analyses were carried out in R using packages raster (Hijmans 2015) and sp (Pebesma and Bivand 2005, Bivand et al. 2013). Proportional canopy
cover and impervious surface (30 m resolution, Xian et al. 2011) were used as proxy variables of habitat suitability. While we acknowledge that these variables do not represent the totality of habitat variation along the rural-to-urban gradient, these land cover metrics have been shown to be
38
values. This metric is considered a continuous analogue of categorical habitat heterogeneity (McGarigal et al. 2009) as high standard deviation in canopy cover values relates to habitats associated with forest edges (see McGarigal et al. 2009).
We used logistic regression to model the habitat suitability for each species as a function of the presence-absence of the species at a given site in response to our land cover metrics. While we acknowledge the importance of incorporating detectability for modelling occupancy, due to sample size constraints and the high prevalence and detectability of our focal species, we were not able to include detectability within our suitability models. Due to uneven sampling across sites, site-level observations were weighted by the number of samples per site. As species may show a differential response to canopy cover at different levels of development and degrees of heterogeneity,
interaction terms were included between these variables and proportional canopy cover. Because species may not have a linear effect to land cover variables, for example if species experience peak occupancy at intermediate levels of proportional canopy cover, we included quadratic terms for each variable. Habitat suitability was estimated and projected as a raster for the individual focal species and landscapes surrounding banding stations, with values ranging from zero, for unsuitable habitat, to one for suitable habitat. (see Figure 2.2).
39
increased and the prevalence of resighted birds decreased as a function of the Euclidean distance from the banding station, we defined the expected habitat permeability for a given location as the ratio of the cost distance and Euclidean distance between the banding station and each sample (See Figure 2.2).
To test our prediction that habitat permeability influences settlement patterns, we compared models of dispersal in which samples were occupied by banded birds as a function of the habitat suitability of the settlement location and the permeability between the banding station and sampling location for each banding station. Sampling locations around each banding station were subset such that samples within 150 m of the center of the banding station were not considered to have
dispersed. This distance, while conservative, may be representative of within-territory movement of birds maintaining the same territories in subsequent years – thus patterns of observations of
previously banded birds in this distance range likely result from biological processes other than dispersal. Additionally, one site (Spring Park, Takoma Park, M.D.), included a net location 180 m from the banding centroid – as there was no record of which birds were banded at this location, samples within 150 m of either location were removed from the analysis. Additionally, as maximum dispersal distances varied by site and species, and banded birds were not observed across all distance classes, we subset samples to only those within the maximum observed distance for a given site and species to avoid biasing our results by including unoccupied samples outside of the observed
dispersal distances. Standardized effect sizes for permeability and suitability were calculated for each banding station as the difference between observed sample values and a random sample of values (n = 100) for each banding stations sampling region divided by the standard deviation of sample values (see Figure 2.4). Because there was variation between banding stations in suitability and permeability, we calculated z-scores for our suitability and permeability metrics for each banding station
40
within the banding stations sampling region. We assessed a candidate set of logistic regression models that included habitat suitability, permeability, additive and interaction terms with both predictors, as well as a null model with only the intercept term. Akaike’s Information Criteria, adjusted for small sample size, were used to determine the model best supported by the data. The relative weight of evidence for between two given model was calculated as ratio of Akaike weights between models (Burnham and Anderson 1998).We used Mann-Whitney tests to explore the
variation in permeability, suitability, and the distance of individuals from the banding station of each sex and age class.
We further explored the influence of land cover on dispersal by conducting a translocation experiment across three landscapes representing rural, suburban, and urban land uses. We conducted the experiment on eight male Northern Cardinals during the breeding seasons of 2011 and 2012. Northern Cardinals were chosen because they were the most frequently re-encountered birds among our focal species. On each bird, we attached a 0.39 g VHF radio transmitter (Advanced Telemetry Systems, Isanti, MN) using a backpack harness of elastic thread. Birds were translocated 1.5 km from the capture location across one of eight pre-determined landscapes, and tracked twice per day following release. The location of the bird was determined using triangulation and, when possible, visible identification of the individual. To assess the influence of intervening land cover on
movement, we then evaluated the days-to-return for each individual. Due to sample size constraints, however, we were not able to conduct a formal statistical analysis of the results of this experiment.
Results
41
identified to banding location (Table 2.2). Nearly half of the observations were at a distance of less than 150 m (n = 85) and were therefore not included within further analyses.
Habitat suitability models (Figure 2.2) developed from point count data yielded varying results, with marked differences in the proportion of explained variance and average predicted suitability values across our focal species. Models of House Sparrow and Northern Cardinal had considerable explanatory power, explaining 26.9 and 37.7 percent of the variance in observed occupancy, respectively. Our study region had considerably higher predicted suitability for the Northern Cardinal, with an average suitability across the study region of 0.54 (Supplemental Figure 1), than the House Sparrow, with an average suitability of 0.34. The model for the American Robin explained 16.2 percent of the variation in observed occupancy with an average suitability of 0.53 across the study region. The model of the Gray Catbird yielded the lowest explanatory power, explaining only 11.9 percent of the variance. Moreover, the study region had an overall mean suitability of 0.76 for the catbird, suggesting that our study region was, overall, very suitable for this species relative to the other focal species given the explanatory variables used in this analysis (Figure 2.3).
Species showed a differential response to landscape permeability and habitat suitability, with supportive evidence for our prediction that patterns of settlement would reflect the permeability between banding and resight locations for two of our four focal species (Table 2.3, Figure 2.4). There was considerable model support that Northern Cardinal settlement was higher in sites with high habitat permeability (β = 1.07, CI: 0.34 to 2.17, pseudo-R2 = 0.15). The model that included the