A SIMPLE METHODOLOGY TO SEGMENT X-RAY TOMOGRAPHIC
IMAGES OF A MULTIPHASIC BUILDING STONE
E
MMANUELL
ET
RONG,O
LIVIERR
OZENBAUM,J
EAN-L
OUISR
OUET ANDA
RYB
RUANDInstitut des Sciences de la Terre d’Orl´eans, UMR 6113 – CNRS/Universit´e d’Orl´eans, 1a, rue de la F´erollerie, 45071 Orl´eans Cedex 2
e-mail: [email protected]
(Accepted October 30, 2008)
ABSTRACT
Assessment of the weathering of a particular limestone, the tuffeau, used in historical monuments requires an accurate description of its microstructure. An efficient tools to obtain such a description is X-ray microtomography. However the segmentation of the images of this multiphasic material is not trivial. As the identification of pertinent markers of the structural components to extract is difficult, a two steps filtering approach is chosen. Alternate sequential filters are shown to efficiently remove the noise but, as they destroy the structural components smaller than the structuring element used, they cannot be carried out far enough. Hence as a second step in the filtering process, a mosaic operator, relying on a pragmatic yet efficient marker determination, is implemented to simplify further the images.
Keywords: alternate sequential filter, building stone, mathematical morphology, segmentation, watershed, X-ray tomography .
INTRODUCTION
Exposed to their climatic environment, the building stones of heritage monuments are often altered and eventually destroyed. This phenomenon called weathering is visible throughout the world and many studies in this field, led with architects and restorers, aim at finding processes to slow down, control and ultimately avoid this decay (Torraca, 1976; Amoroso and Fassina, 1983; Tiano et al., 2006). A way to achieve such a goal is to understand the weathering mechanisms of building stones, i.e., to relate the microscopic mechanisms occurring at the pore scale (dissolution of minerals, transport, precipitation, etc.) to their consequences at the macro-scale (desquamation, powdering, etc.; Amoroso and Fassina, 1983; Camuffo, 1995; T ¨or¨ok, 2002). Studies comparing weathered stones with unweathered stones have been performed. The chemical and mineralogical composition, as well as the porosity were analyzed (Galan et al., 1999; Maravelaki-Kalaitzaki et al., 2002; Rozenbaum et al., 2007). The main processes of weathering have been qualitatively inferred from the observed differences. Still, one may rely on computerized models to understand quantitatively the weathering mechanisms and their consequences. This requires a quantitative realistic description of the three dimensional structure of the porous medium (Adler, 1992; Dullien, 1992; Anguy et al., 2001). Towards that end, one may rely on X-ray tomography 3D images which are related to the absorption coefficients of the
various phases constituting the material (Kak and Slaney, 2001). In this contribution, the images have been acquired on the ID-19 beamline at the European Synchrotron Radiation Facility. The synchrotron radiation source has several advantages compared to desktop devices, e.g., smaller pixel size, X-ray beam quality (monochromaticity, stability, high flux) which lead to high quality and high resolution images (Baruchel et al., 2006). However the segmentation of a raw tomographic image is seldom a trivial process. Segmentation is the process of partitioning the billions of gray-level voxels of the 3D image into distinct objects, or phases. In the context of building stones, it is be to separate the void phase from the various solid phases (two for the stone studied in this work). Most of the segmentation complexity is related to the presence of noise (voxels with the same gray value can actually belong to two different phases) and blur (the borders between the phases are not well defined). The larg size of the 3D images is not suited to a manual analysis (e.g., by marking the objects of interest), and the segmentation must be as automated as possible. The main techniques reported in the literature are:
– Thresholding gray levels histogram, with (Kaestner
et al., 2006) or without (Appoloni et al., 2007) a
Most often, it is a reconstruction of the connected components of interest (Ketcham, 2005; Lambert
et al., 2005; du Roscoat et al., 2005; Erdogan et al.,
2006; Kaestner et al., 2006).
– Active contours on the image considered as a level set (Chung and Ho, 2000; Maksimovi´c et al., 2000; Qatarneh et al., 2001; Ramlau and Ring, 2007). These techniques are mostly used in medical applications and usually require some a priori knowledge of the location of the interfaces.
– Watershed-based techniques (Beucher and Lantuejoul, 1979; Beucher et al., 1990; Beucher, 1992; Benouali et al., 2005; Vachier and Meyer, 2005; Carminati et al., 2006; Malcolm et al., 2007; Videla et al., 2007). These techniques allow the extraction of individually marked objects.
– Combined techniques, e.g., Sheppard et al. (2004).
The subject of this contribution is to provide a segmentation methodology of images of a limestone described hereafter. The approach falls into the first category, i.e., filtering, then by thresholding. One of the filters used in this work is the mosaic operator based on a watershed (Beucher, 1990; Beucher et al., 1990). In the next section, we present the main features of the stone of interest, the tuffeau, the sample preparation and the obtained 3D images. Then we detail the image analysis procedure (based on mathematical morphology tools) used to segment these raw images.
X-RAY MICRO-TOMOGRAPHY OF
TUFFEAU SAMPLE
50 µm
(a)
(b)
(c)
Fig. 1. SEM image of a tuffeau sample. (a) sparitic
calcite (large grains), (b) micritic calcite (small grains of a fewµm), (c) opal spheres of 10 to 20µm diameter.
200 µm (a)
(c) (d)
(e) (f)
(b)
Fig. 2. One slice extracted from a 3D tomographic
image of a tuffeau sample. The image is 2048×2048 pixels, pixel size is 0.28 µm (the radius of the sample is≈700µm). (a) resin, (b) silica (opal sphere), (c) air bubble in the resin (impregnation artefact), (d) silica (quartz crystal), (e) calcite and (f) phyllosilicate. The rectangle shows the location of the zoom image in Fig. 3a.
Most heritage monuments (chˆateaux, churches, cathedrals or houses) forming the cultural heritage of the Loire valley, which is registered to the World Heritage list of the UNESCO, are built with tuffeau, a highly porous limestone (porosity≈45%) originating from this valley. Previous studies (Dessandier, 1995; Brunet-Imbault, 1999; Rozenbaum et al., 2007) have shown that the minerals forming the tuffeau are essentially sparitic (large grains) and micritic (small grains) calcite (≈50%), silica (≈45%) in the form of opal cristobalite-tridymite spheres and quartz crystals, and secondary minerals such as clay and mica (a few %). The scanning electron microscopic (SEM) image in Fig. 1 illustrates the variability of the size and shape of these phases. X-ray tomography (Kak and Slaney, 2001) is a key technology to image the structure of the most varied porous materials including rocks (Lindquist and Venkatarangan, 1999; Cnudde and Jacobs, 2003; Cnudde et al., 2004; Sheppard et al., 2004; Appoloni et al., 2007; Betson et al., 2004; 2005; Videla et al., 2007), cements and ceramics (Erdogan
et al., 2006; Maire et al., 2007), soils (Gryze et al.,
2006; Carminati et al., 2006) and others (Jones et al., 2004; Prodanovi´c et al., 2005; du Roscoat et al., 2005; Mendoza et al., 2007). The weathering of building stones has been previously investigated through of X-ray tomography (Cnudde and Jacobs, 2003; Cnudde
mineral and are accordingly simpler than tuffeau. The average size of the smallest components of tuffeau range from a fewµm for micritic calcite grains to about 10 to 20 µm for opal spheres. This requires the use of a high resolution tomograph such as the European Synchrotron Radiation Facility (ESRF, Grenoble, France). However smallest structural features such as the roughness of the opal spheres and the phyllosilicates will not be imaged, since their size is below the finest resolution of present day X-ray tomographic facilities. The microtomographic images presented in this study have been collected at the ID-19 beamline of the ESRF (Salvo et al., 2003; Baruchel
et al., 2006) at the smallest voxel size allowed by
the synchrotron. The energy used was 14.7 keV. 1500 successive rotations of the sample, corresponding to 1500 angular positions between 0◦ and 180◦, were acquired by the FReLoN camera (2048×
2048 pixels). To avoid supplementary artefacts, the samples must lie within the field of view of the detector. Therefore, the samples must be less than 700 µm in diameter. Local tomography (or region of interest tomography) could release this constraint, yet it is not yet operational at the ESRF. Cylindrical cores of diameter 700µm were mounted on a vertical rotator on a goniometric cradle. The preparation of tuffeau samples of such a small size requires special care. The samples were first impregnated with resin in order to cut a 700 µm thick slab. Impregnation is necessary to keep the coherence of the sample. The slab was cut into pieces of square section which were trimmed to obtain the final cylinders. Image acquisition time was approximately 45 min. The 2048 horizontal slices (0.28 µm thick) were reconstructed from the projections with a dedicated filtered back-projection algorithm. Each output gray level (256 values) tomographic image comprises 2048×2048×
2048 voxels. (one uncompressed image is therefore 8 GB in size). The gray level value of a voxel is related to the X-ray absorption of the sample at the voxel position (Baruchel et al., 2000). Thus, pores impregnated with resin appear in dark gray, silica compounds in medium gray and calcite compounds in light gray (Fig. 2). The different phases are distinguishable to the naked-eye: calcite is present in the form of large irregular grains (sparitic calcite) or small grains that look like crumble (micritic calcite); silica has the form of large quartz crystals or small spheres of opal. Nevertheless direct thresholding of the raw image is not possible. Indeed the raw gray level histogram (Fig. 4; red curve) does not show any well defined peaks. This is due to the presence of noise as illustrated Fig. 3a, which clearly shows the impossibility to associate distinct gray levels to the various phases.
IMAGE FILTERING
Segmentation can be based on the automatic marking of each structural component to be extracted, followed by the identification of the zone of influence of each marker via a watershed operator (Beucher and Lantuejoul, 1979; Vincent and Soille, 1991). This approach requires either the definition of markers based on a shape and/or size criterion (Beucher
et al., 1990) or markers based on a rough a priori
knowledge of the gray level of the background and the foreground, possibly cleaned-up or merged by swamping (Beucher, 1992). From our point of view, the multiphase nature of the samples, the variety of shape and size of the structural components of each phase, and the presence of noise, do not allow to propose any robust criterion for the identification of the relevant markers. Segmentation is therefore based herein on the gray level of each phase, and the method proposed consist in denoising the images prior to thresholding. Classical denoising tools like linear (e.g., mean) or non-linear (e.g., median) filters are usually efficient but may introduce blur, which in turn has to be dealt with via edge-enhancing techniques,
e.g., Saraswati Janaki and Ebenezer (2006). The noisy
images under consideration have a good “sharpness” (as illustrated in Fig. 3a) that one would like to preserve. Mathematical morphology (Matheron, 1975; Serra, 1982; 1988) offers efficient denoising tools called alternate sequential filters (ASF) which do not smooth images. Such filters consist of alternating openings and closings with structuring elements of increasing size. The price to pay is the loss of the structural components smaller than the biggest (last) structuring element used. Hopefully the small pixel size compared to the relevant structures to be extracted allows using this type of filter, up to a certain size. In the subsequent sections, we argue that the only application of an ASF filter is insufficient in the current study. A subsequent mosaic operator is therefore introduced. This filter flattens the zones of influence of carefully chosen markers and transforms the image into a mosaic of flat zones which can be straightforwardly thresholded.
FILTERING WITH ASF
A 3D image f is considered as a set of N×N×
N voxels, N∈N, on a cubic grid with 26-neighboring.
Each voxel carries an integer value (gray level), in the range[0,255].
f={vi jk}, vi jk∈[0,255], (i,j,k)∈[0,N−1].
Each voxel is located in the image with a unique triplet of numbers (coordinates).
f(x) =vi jk,x={i,j,k}. (2)
On a gray level image, the erosionεand the dilationδ by a structuring element B are defined at every point x by (Serra, 1982)
δB(f)(x) =∨ {f(x−y),y∈B(x)}, (3)
εB(f)(x) =∧ {f(x−y),−y∈B(x)} , (4)
where∨if the supremum (or maximum) operator and
∧ the infimum (minimum) operator and B(x) is the structuring element centered at point x. The opening
γ and closingϕ are defined by the adjunctions (Serra, 1982)
γB=δBεB, (5)
ϕB=εBδB. (6)
A particular family of digital balls Bλ, with radiusλ, have been used for the structuring elements
Bλ(x) ={y,d(x,y)≤λ}, λ∈N, (7)
where d(x,y) is the euclidean distance between the centers of the two voxels at coordinates x and y in voxel-size unit. These balls are a better approximation of the euclidean sphere than those based on the digital distance d26 and they do not penalize the efficiency
of the implementation. Sequential alternate filtering is applied up to a size λ =3, leading to the filtered image h
h=γB3ϕB3γB2ϕB2γB1ϕB1(f). (8)
The application of this filter is illustrated step by step in Fig. 3a-d. Which highlight the ability of ASF to denoise images. The digital ball B3 has a diameter
of 7×0.28 =1.96 µm, which allow preserving the
smallest elements of interest in the images (micritic calcite). Improvement after denoising appears clearly on the histogram of the filtered image in Fig. 4 (green curve); three peaks are easily distinguished, which allows a priori direct threshold of the three phases. The thresholds are the gray values corresponding to the local minima of the histogram. The result of such a threshold is illustrated in Fig. 5. For “simple” zones, the result is acceptable. However, in more complex areas such as those including micritic calcite, the segmentation is not satisfying. In particular, a tangible amount of silica is artificially identified.
0 50 100 150 200 250
500 550 600 650 700 750 800
(a)
0 50 100 150 200 250
500 550 600 650 700 750 800
(b)
0 50 100 150 200 250
500 550 600 650 700 750 800
(c)
0 50 100 150 200 250
500 550 600 650 700 750 800
(d)
0 50 100 150 200 250
500 550 600 650 700 750 800
(e)
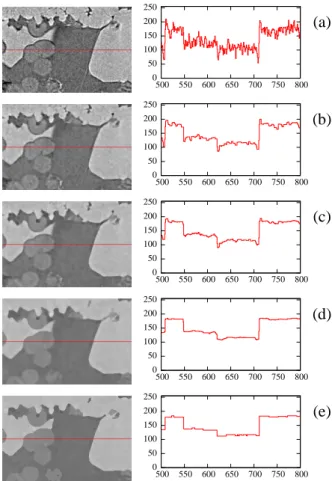
Fig. 3. Illustration of the image processing. In the left
column a 2-D zoom in the sample (white rectangle in Fig. 2) undergoes the image treatment. The images are 300×200 pixels with pixel size 0.28 µm. In the right column, a line of the zoomed image (noted in red in the left column) is plotted (pixel coordinate in abscissa, gray level in ordinate). From top to bottom: (a) the original image; (b) after step 1 of the ASF; (c) after step 2, (d) after step 3, (e) after the mosaic operator. The histograms of the whole 3D image at each steps are visible on Fig. 4.
FILTERING WITH MOSAIC
the filtering by ASF the image is already essentially composed of flat zones (see Fig. 3d), each of the flat zone being a minima of the image gradient. The use of these minima as markers to build a mosaic leads to numerous zones, and does not simplify enough the output image. In fact mosaic derived from such markers are very similar to the ASF filtered images, and do not bring any improvement. In order to extract more efficient markers, we go on the assumption that every separated structural component belonging to a given phase (e.g., a block of sparitic calcite, a small grain of micritic calcite or an isolated opal sphere) carries at least a local extremum (minimum or maximum). Within large component (e.g., a block of sparitic calcite, an opal sphere), it amounts to saying that there is still “enough noise” to create such local extrema, i.e., the zone is not completely flat. The smaller components of a phase (e.g., micritic calcite grains or resin between these grains) are likely to be isolated within another phase and are de facto local maxima (e.g., calcite inside resin) or local minima.
0 5e+06 1e+07 1.5e+07 2e+07 2.5e+07 3e+07
0 50 100 150 200 250
Original ASF Mosaic
Fig. 4. Evolution during image processing of the
histogram of a 1024×1024×1024 voxels image. The initial raw image is visible in Fig. 7. The initial raw histogram is labeled “Original” (see also Fig. 3a). The histogram after application of the ASF is called “ASF” (see also Fig. 3d). “Mosaic” denotes the final histogram after running the watershed (see Fig. 3e).
The morphological gradient g of the (ASF) filtered image is defined as (Serra, 1982)
g=δB1(h)−εB1(h). (9)
The min operator leads to a binary image locating the minima of the function h. It is defined for every voxel by
min(h)(x) =
255 if h(x)belongs to a local minimum
0 otherwise
(10)
with an equivalent definition for max. A local minimum (resp. maximum) is a set of connected voxels (possibly one single voxel) which have no neighbor with a strictly lower (resp. higher) value. The selected marker set is the union of the minima and maxima of the filtered image h, intersected with the minima of the gradient.
m= (max(h)∨min(h))∧min(g). (11)
Since the min and max functions return binary images, the supremum and the infimum in Eq. 11 are equivalent to union and intersection, respectively. Fig. 6 illustrates that the proposed criterion (Eq. 11) rejects many of the gradient minima, and marks all relevant structural component, at least once. The zones of influence of the markers are then identified by a watershed
w=watershed(g,m). (12)
Fig. 5. Illustration of the segmentation. Left column:
2-D zoom (300×200 pixels) of a “simple” zone. Right column: zoom (same size) of a more complex zone containing micritic calcite. First row: raw gray-level images. Second row: segmentation after the ASF step (black: resin, blue: silica, yellow: calcite). Third row: segmentation after the mosaic step.
Using the histogram (Fig. 4, blue curve), the threshold values are easily identified as the minimum values between the peaks. On the 2-D zooms (Fig. 5) one can see that the mosaic filtering improves the quality of the segmentation. In particular, the spurious silica has disappeared in “complex” zones. Very thin details (smaller than the size of the ASF) have of course been lost, but the structure at a bigger scale is well preserved. This is a obviously a compromise. The full 3D results of the segmentation are illustrated in Figs. 7-8.
All the computations were conducted in 3D with a fully self-developed C++ code, which is being currently parallelized.
Fig. 6. Illustration of the marker used for the mosaic.
Left: in red minima of the gradient of the ASF filtered image superimposed over the original image. Right: the markers actually used to build the mosaic.
Fig. 7. 3D illustration of the segmentation process:
original image. The image is 1024×1024×1024
voxels. The segmented image is in Fig. 8.
Fig. 8. 3D illustration of the segmentation process:
segmented version of the image in Fig. 7.
CONCLUSION
In this contribution a practical and efficient technique enabling to denoise and to segment X-ray tomographic images of a particular multiphase porous stone has been presented. The technique is twofold: (1) A classical ASF is shown to be efficient but has to be limited in size in order to preserve the smaller structural components of the image. The current small pixel size compared to the dimensions of the structural components to be preserved allows to bring the ASF up to structuring elements of 3 voxels in radius. (2) The mosaic operator is built upon a set of markers determined in a pragmatic way. It leads to a limited number of flat zones, i.e., to a simplified image where no relevant structural component is missing.
ACKNOWLEDGEMENT
The author would like to thank ´Elodie Boller, Peter Cloetens, and Jos´e Baruchel (ID 19, ESRF,Grenoble) for scientific support concerning tomography experiments.
Part of this study was conducted within the R´egion Centre/SOLEIL project funded by the R´egion Centre that granted one of us.
REFERENCES
Adler PM (1992). Porous media: geometry and transport. Boston: Butterworth-Heinemann.
Anguy Y, Ehrlich R, Ahmadi A, Quintard M (2001). On the ability of a class of random models to portray the structural features of real, observed, porous media in relation to fluid flow. Cem Concr Compos 23:313–30. Appoloni CR, Fernandes CP, Rodrigues CRO (2007). X-ray
tomography study of a sandstone reservoir rock. Nucl Inst Meth A 580:629–32.
Baruchel J, Buffiere JY, Cloetens P, Michiel MD, Ferrie E, Ludwig W, et al. (2006). Advances in synchrotron radiation microtomography. Script Mater 55:41–6. Baruchel J, Buffiere JY, Maire E, Merle P, Peix G (2000).
X-Ray tomography in material science. Paris: Herm`es. Benouali AH, Froyen L, Dillard T, Forest S, Nguyen
F (2005). Investigation on the influence of cell shape anisotropy on the mechanical performance of closed cell aluminium foams using micro-computed tomography. J Mater Sci 40:5801–11.
Betson M, Barker J, Barnes P, Atkinson T (2005). Use of synchrotron tomographic techniques in the assessment of diffusion parameters for solute transport in groundwater flow. Transp Porous Med 60:217–23. Betson M, Barker J, Barnes P, Atkinson T, Jupe A (2004).
Porosity imaging in porous media using synchrotron tomographic techniques. Transp Porous Med 57:203– 14.
Beucher S (1990). Segmentation d’images et morphologie math´ematique. Ph.D. thesis, ´Ecole des mines de Paris. Beucher S (1992). The watershed transformation applied to
image segmentation. Scan Microsc Int 6:299–314. Beucher S, Bilodeau M, Yu X (1990). Road segmentation
by watershed algorithms. In: Proceedings of the Pro-art vision group. PROMETHEUS workshop.
Beucher S, Lantuejoul C (1979). Use of watersheds in contour detection. In: Proceedings of the internal workshop on image processing. CETT/IRISA.
Brunet-Imbault B (1999). Etude des patines de pierres´ calcaires mises en oeuvre en R´egion Centre. Ph.D. thesis, University of Orl´eans, France.
Camuffo D (1995). Physical weathering of stones. Sci Total Environ 167:1–14.
Carminati A, Kaestner A, Ippisch O, Koliji A, Lehmann P, Hassanein R, et al. (2006). Water flow between soil aggregates. Transp Porous Med 68:219–36.
Chung R, Ho CK (2000). 3-D reconstruction from tomographic data using 2-D active contours. Comp Biomed Res 33:186–201.
Cnudde V, Cnudde JP, Dupuis C, Jacobs PJS (2004). X-ray micro-CT used for the localization og water repellents and consolidants inside natural building stones. Mater Charact 53:259–71.
Cnudde V, Jacobs PJS (2003). Monitoring of weathering
and conservation of building materials through non-destructive X-ray computed microtomography. Environ Geol 46:477–85.
Dessandier D (1995). Etude du milieu poreux et des´ propri´et´es de transfert des fluides du tuffeau blanc de Touraine. Application `a la durabilit´e des pierres en œuvre. Ph.D. thesis, University of Tours, France. du Roscoat SR, Bloch JF, Thibault X (2005). Synchrotron
radiation microtomography applied to investigation of paper. J Phys D 38:78–84.
Dullien FAL (1992). Porous media, fluid transport and pore structure. New York: Academic Press. 2nd ed.
Erdogan S, Quiroga P, Fowler D, Saleh H, Livingston R, Garboczi E, et al. (2006). Three-dimensional shape analysis of coarse aggregates: New techniques for and preliminary results on several different coarse aggregates and reference rocks. Cem Concr Res 36:1619–27.
Galan E, Carretero M, Mayoral E (1999). A methodology for locating the original quarries used for constructing historical buildings: application to malaga cathedral, spain. Eng Geol 54:287–98.
Gryze SD, Jassogne L, Six J, Bossuyt H, Wevers M, Merckx R (2006). Pore structure changes during decomposition of fresh residue: X-ray tomography analyses. Geoderma 34:82–96.
Jones AC, Milthorpe B, Averdunk H, Limaye A, Senden TJ, et al. AS (2004). Analysis of 3D bone ingrowth into polymer scaffolds via micro-computed tomography imaging. Biomaterials 25:4947–54.
Kaestner A, Schneebeli M, Graf F (2006). Visualizing three-dimensional root networks using computed tomography. Geoderma 136:459–69.
Kak AC, Slaney M (2001). Principles of computerized tomographic imaging. New York: SIAM.
Ketcham RA (2005). Three-dimensional grain fabric measurements using high-resolution X-ray computed tomography. J Struct Geol 27:1217–28.
Lambert J, Cantat I, Delannay R, Renault A, Graner F, et al. JAG (2005). Extraction of relevant physical parameters from 3d images of foams obtained by X-ray tomography. Coll Surf A 263:295–302.
Lindquist WB, Venkatarangan A (1999). Investigating 3D geometry of porous media from high resolution images. J Phys Chem B 25:593–9.
Maksimovi´c R, Stankovi´c S, Milovanovi´c D (2000). Computed tomography image analyzer: 3D reconstruction and segmentation applying active contour models – ‘snakes’. Int Med Info 58–59:29–37. Malcolm A, Leong H, Spowage A, Shacklock A (2007). Image segmentation and analysis for porosity measurement. J Mater Proc Tech 192–193:391–6. Maravelaki-Kalaitzaki P, Bertoncello R, Biscontin G (2002).
Evaluation of the initial weathering rate of Istria stone exposed to rain action, in Venice, with X-ray photoelectron spectroscopy. J Cult Heritage 3:273–82. Matheron G (1975). Random sets and integral geometry.
New York: Wiley.
Mendoza F, Verboven P, Mebatsion HK, Kerckhofs G, Wevers M, Nicolas B (2007). Three-dimensional pore space quantification of apple tissue using X-ray computed microtomography. Planta 226:559–70. Prodanovi´c M, Lindquist W, Seright R (2005). Porous
structure and fluid partitioning in polyethylene cores from 3D X-ray microtomographic imaging. J Colloid Interface Sci 298:282–97.
Qatarneh SM, Crafoord J, Kramer EL, Maguire GQ, Brahme A, et al. MEN (2001). A whole body atlas for segmentation and delineation of organs for radiation therapy planning. Nucl Inst Met A 471:160–4.
Ramlau R, Ring W (2007). A Mumford-Shah level-set approach for the inversion and segmentation of X-ray tomography data. J Comp Phys 221:539–57.
Rozenbaum O, Le Trong E, Rouet JL, Bruand A (2007). 2D-image analysis: A complementary tool for characterizing quarry and weathered building limestones. J Cult Heritage 8:151–9.
Salvo L, Cloetens P, Maire E, Zabler S, Blandin JJ, et al. JYB (2003). X-ray micro-tomography an attractive characterisation technique in materials science. Nucl Inst Meth B 200:273–86.
Saraswati Janaki S, Ebenezer D (2006). A blur reducing adaptative filter for the removal of mixed noise in images. In: Advances in Computer, Information, and Systems Sciences, and Engineering. IETA, Springer Netherlands.
Serra J (1982). Image analysis and mathematical morphology. London: Academic Press.
Serra J (1988). Image analysis and mathematical morphology, vol. 2: Theoretical advances. London: Academic Press.
Sezgin M, Sankur B (2004). Survey over image thresholding techniques and quantitative performance evaluation. J Electron Imaging 13:146–68.
Sheppard AP, Sok RM, Averdunk H (2004). Techniques for image enhancement and segmentation of tomographic images of porous materials. Physica A 339:145–51. Tiano P, Cantisani E, Sutherland I, Paget J (2006).
Biomediated reinforcement of weathered calcareous stones. J Cult Heritage 7:49–55.
T¨or¨ok A (2002). Oolitic limestone in a polluted atmospheric environment in Budapest: weathering phenomena and alterations in physical properties. In: Natural stone, weathering phenomena, conservation strategies and case studies. Geological society of London, 363–79. Torraca G (1976). Treatment of stone monuments: a review
of principles and processes. Conserv Sto 1:297–315. Vachier C, Meyer F (2005). The viscous watershed
transform. J Math Imaging Vis 22:251–67.
Videla A, Lin C, Miller J (2007). 3D characterization of individual multiphase particles in packed particle beds by X-ray microtomography (XMT). Int Miner Proc 84:321–6.