313
PRIMARY OFFER OF CEREALS IN THE OLT COUNTY (2014-2016)
MEDELETE D.M., PÂNZARU R.L.
Faculty of Agronomy, University of Craiova
Key words: average area, total production, average yield, cereals
ABSTRACT
For agricultural producers in Romania, cereals are a very important group of crops if we take into account only the areas related to them, but also the implications regarding the tradition and the impact on the realized revenues.
The area cultivated with cereals in Olt County recorded increases and decreases in the analyzed period (-1.36% in 2015, + 0.18% in 2015), with an
average of 265,248.67 ha. In terms of total production, there are significant decreases of 10.20% in 2015 and 15.88% in 2016, so that the average is below the level of 2014 by 8.03% (868.158.33 t compared to 943.924 t in the first year). The average yield per hectare fell from 3,545 kg / ha in 2014 to 3,227 kg / ha in 2015 (-8.93%), to reach 3,047 kg / ha in 2016 (-14.05%).
INTRODUCTION
The offer for an "X" product is represented by the quantities that producers are willing to produce at a certain "K" cost, considering the profit they will get. In the short term, the supply of agricultural products is valid, depending on climatic or seasonal factors, as well as on the level of stocks for agricultural stock. At the same time, the variation in annual yields for agricultural crops and livestock production makes the supply of agricultural products variable. In the long run, the supply of agricultural products is relatively stable, depending on the volume of annual agricultural produce, the level of stocks accumulated over time, the impact of agricultural policies etc.
Grain cereals are the basic food
for almost the entire population of the globe, which are used in various forms, milled and prepared in the form of bread, semolina, pasta, pudding, etc., or cooked and consumed as such.
Cereal grains are used as raw material for a number of industries such as alcohol, alcohol, amyl, beer, dextrin, glucose, etc., and straw are used as raw material in the pulp and paper industry.
Cereals (wheat, rye, triticale, barley, oats, millet, rice, corn, sorghum) have a number of characteristics that make them very valuable and appreciated by man, which made them all of the time remains in the future, the group of plants of greatest importance for human existence and activity.
METHOD AND MATERIAL
In order to accomplish the work, specific indicators were used to establish the total supply of cereals (cultivated areas, average yields and total yields) based on data extracted and reported at the level of the National Institute of Statistics for the period 2014-2016.
They present the situation of the cultivated areas, the total production and the average production expressed in hectares, tons and kg / ha respectively, for Olt county.
314
purpose, the annual and multiannual average of the monitored phenomena were analyzed.
As a result, dynamic series were built, during which the first component year (2014) became a reporting term.
RESULTS AND DISCUSSIONS
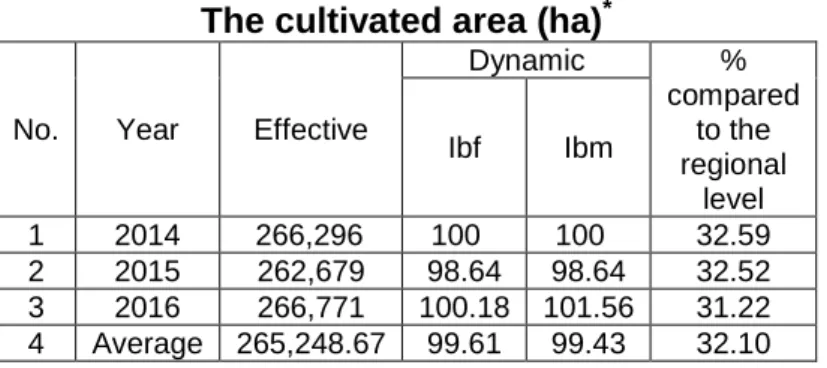
Table 1 includes the data for the area cultivated with cereals for Olt County.
Table 1. The cultivated area (ha)*
No. Year Effective
Dynamic %
compared to the regional
level Ibf Ibm
1 2014 266,296 100 100 32.59
2 2015 262,679 98.64 98.64 32.52 3 2016 266,771 100.18 101.56 31.22 4 Average 265,248.67 99.61 99.43 32.10 *
http://insse.ro
Olt County cultivated between 2014 and 2016 an average cereal area of 265,248.67 ha, with the variation limits of the indicator being 262,679 ha in 2015 and 266,771 ha in 2016, while in 2014, the county of cultivated an area of 266,296 ha.
Compared with the first term of the dynamic series - 2014, the dynamics made (Figure 1) highlight sub-unitary levels of fixed base indices: -1.36% in 2015 and -0.39% for the average of the interval, and a supra-unit value in 2016, 0.18% (98.64, 99.61 and 100.18%). For mobile base indices in dynamic, there is a
single overhead position in 2016, + 1.56% (101.56%), while for the rest of the components the levels are subdued, -1.36% in 2015 (98.64%) and - 0.57% for the average (99.43%).
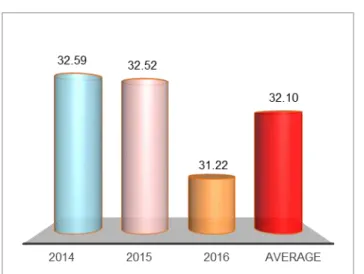
Compared to the situation encountered at regional level, Olt County registered a weight of 32.10%, as the average of the interval, while for the analyzed period, are recorded increasing weightings of 31.22% in 2016, 32.52% in 2015 and 32.59% in 2014 (Fig. 2).
Table 2 includes data on total cereal production for Olt County.
315
Fig. 2. The share of the area cultivated at regional level (%)
Table 2. Total production (t) *
No. Year Effective
Dynamic %
compared to the regional
level Ibf Ibm
1 2014 943,924 100 100 32.46
2 2015 847,636 89.80 89.80 33.58 3 2016 812,915 86.12 95.90 28.43 4 Average 868,158.33 91.97 106.79 31.41 *
http://insse.ro
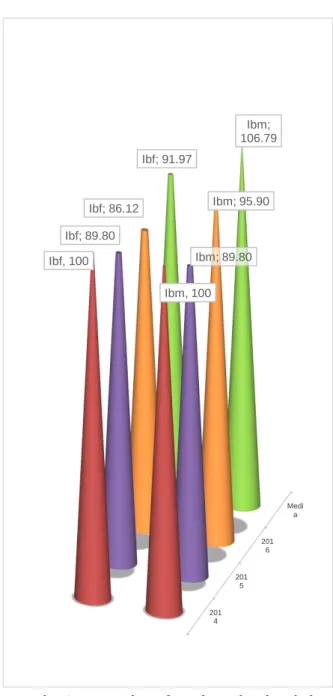
The average of the indicator was 868,158.33 t, which is based on annual quantities of 812,915, 847,636 and 943,924 t specific for the years 2016, 2015 and 2014. Under these conditions, it can be noticed that the dynamics made (fig. 3) show a descending evolution for most of the indices in the composition, with subunit values in the year 2015 of
316 201
4 201
5 201
6 Medi
a
Ibf, 100
Ibm, 100 Ibf; 89.80
Ibm; 89.80
Ibf; 86.12 Ibm; 95.90
Ibf; 91.97
Ibm; 106.79
Fig. 3. Dynamics of total production (%)
317 2014
2015
2016
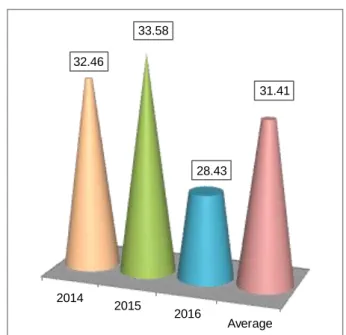
Average 32.46
33.58
28.43
31.41
Fig. 4. Share of total production at regional level (%)
Table 3 contains information on the average cereal production situation specific to Olt County, the dynamics of
the indicator and its positioning in a regional context.
Table 3. Average production (kg/ha)
No. Year Effective
Dynamic %
compared to the regional
level Ibf Ibm
1 2014 3,545 100 100 99.61
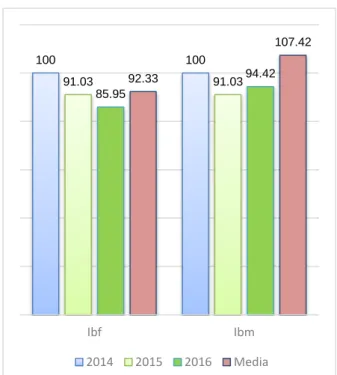
2 2015 3,227 91.03 91.03 103.26 3 2016 3,047 85.95 94.42 91.06
4 Average 3,273 92.33 107.42 97.90
Average yields fluctuated from 3,047 kg / ha in 2016 to 3,545 kg / ha in 2014, while the average was 3,273 kg / ha.
Under these conditions, it can be noticed that the dynamics made (fig.5) show a descending evolution for most of the indices in the composition, with sub-unit values in year 2015 of 91.03%
318
100 100
91.03 91.03
85.95
94.42 92.33
107.42
Ibf Ibm
2014 2015 2016 Media
Fig. 5. Average production dynamics per hectare (%)
The county obtained 97.90% of the regional level of the indicator (91.06% in
2016, 99.61% for the year 2014 and 103.26% for the year 2015) - fig. 6.
Fig. 6. Average production – positioning compared to the regional level (%)
CONCLUSIONS
- the county, held regional shares of 32.59% in 2014, 32.52% in 2015, 31.22% in
2016, the average of the interval being 32.10%;
319
not in line with the area owned, but the differences are not very high (32.10% of the regional surface area and 31.41% for the total production);
- compared to the region recorded, the average
production was 97.90% (as an average of the interval), the most favorable year being 2015, when the county managed to outrun the region by 3.26%.
-
BIBLIOGRAPHY
1. Barbu C., R.L. Pânzaru, 2000, "Agrarian Economy", Hyperion Publishing House, Craiova.
2. Constantin M., et al., 2009, "Marketing of Agro-Food Production", Agro Tehnica Publishing House, Bucharest. 3. Pânzaru R.L., Medelete D.M.,
2005, Agrarian Economy -
Applications, Universitaria Publishing House, Craiova,
4. Ștefan G., D. Bodescu, A. D. Toma, R. L. Pânzaru, 2007, "The economy and the branch of agro-food production", Alfa Publishing House, Iasi.