Accredited by RISTEKDIKTI, Decree No: 32a/E/KPT/2017 doi: 10.14203/jet.v18.67-74
Performance Evaluation of Distribution Node in Case of
LEACH Implementation on Wireless Sensor Network
Bagas Mardiasyah Prakoso, Ahmad Zainudin *, Prima Kristalina,
Rizqi Fauzil Azhar
Department of Electronic Engineering, Politeknik Elektronika Negeri Surabaya Jalan Raya ITS, Kampus PENS, Sukolilo, - 60111
Surabaya, , Indonesia
Abstract
Wireless sensor networks consisting of sensor nodes can be used as an effective tool for collecting data in various situations. Nodes are usually placed randomly in an area to perform sensing and monitor various parameters related to environmental conditions in various locations. One of the major problems in wireless sensor networks is developing energy-efficient routing protocols that have a significant impact on the overall life of sensor networks so it is important to make energy savings in these limited energy sources to extend network life. This paper proposes a hardware design and Low-Energy Adaptive Clustering Hierarchy (LEACH) routing protocol configuration for power saving by utilizing cluster head selection mechanism. The cluster head selection process is performed periodically based on LEACH algorithm enables the node to have the best lifetime responsible for communication between the nodes and the server as well as the effort to save energy consumption of limited energy sources to extend network life. So that makes the process of sending information more effective and optimal. The system has been able to display data information along with the position of nodes in the web server with an average of 42 seconds of computing time in a rotation of the system so that it can be done 85 times in 1 hour. The system is able to provide real-time information with a throughput of more than 1.052 Kbps and packet loss of no more than 6.7%. In addition, energy savings can up to 6.5% of the existing energy in a lithium battery.
Keywords: WSN, LEACH, energy saving
I. INTRODUCTION
Wireless sensor network (WSN) is a complex system which consists of autonomous sensor nodes distributed in an area to perform certain tasks. The nodes communicated wirelessly and arranged in a network to work fine. These sensor nodes have several of the tasks, such as sensing, wireless communication, signal processing, and storage capabilities. WSN is generally expected to operate for several years and to function autonomously without much interference of its external environment [1]. The sensor nodes collaboratively obtain information based on the assigned tasks and the objectives of the application. Principally, the reading condition of the sensor will be informed in real time until the data processor receives such information [2].
Researchers in the study of WSN have actively and further explored the conservation approach of low energy consumption and efficient communication architecture in terms of energy consumption which involves all levels from the physical layer to the application layer [3]. Communication nodes from the base station to each other node are determined by the routing strategy used. A reliable routing protocol is considered to be essential to the success of WSN considering the fact that any obtained data are required for a variety of applications [4].
W. R. Heinzelman et. all in [5], proposed the hardware design using Arduino UNO and ZigBee for WSN implementation that is equipped with three sensors (lighting, temperature and gas). This system adopts the ZigBee communication protocol with hybrid network topology (single and multihop). The multihop topology in this research still using static routing. The static routing protocol has a deficiency when the network topology changes dynamically. Therefore, the data transmission was not working properly.
In [6], Y. Wang proposed design and implementation of a WSN node using Arduino MCU and ZigBee communication protocol. This hardware design was implemented to overcome the versatility requirement of the nodes in WSN. This node system only responsible for monitoring processing and transmitting the sensing data. The node hardware design is not equipped with routing protocol to overcome the power consumption problem.
A. Ismail et. all in [7], a LEACH routing protocol was adopted and implemented in the hardware design that consists of ATMega328-PU microcontroller and nRF24L01+ RF module. The nRF24L01+ RF module has a range of 85m and may effectively only have five members per cluster which formed. Whereas, the ZigBee protocol can achieve more members in the same cluster.
In this paper, we proposed a hardware design and LEACH routing protocol configuration. The hardware design consists of Arduino MEGA MCU, ZigBee RF module, current and voltage sensor and power supply using battery or power bank. The GPS equipped to get
* Corresponding Author.
Email: [email protected]
Received: June 21, 2018 ; Revised: December 12, 2018 Accepted: December 19, 2018 ; Published: December 31, 2018
information about the position of the node. The position information of the node is displayed on the applications, such as Google Maps. LEACH automatically forms the cluster head of the formerly formed several clusters based on the energy of the node. Such mechanism saves energy because the cluster head is the only one transmitting data in the form of node ID and node coordinates compressed to the base station, while the other nodes simply deliver the data to the cluster head of each node so that the energy consumption optimizes. Transmission of data from cluster head to base station uses RF module since information can be delivered in long distance.
The cluster head formation is conducted periodically for node efficiency. The information received from each cluster head can directly be seen in the form of ID nodes around the cluster head. Display of Graphical User Interfaces (GUI) on the web in the form of node coordinates is shown on Google Map. The expected result of this application can be used as a position monitoring of the objects based on wireless sensor network with energy efficiency using LEACH routing protocol.
II. ENERGY EFFICIENCY BASED ON LEACH ALGORITHM
Processing capabilities (one or more microcontrollers, CPU or DSP chips) can consist of several types of memory (program, data and flash memories), have an RF (Radio Frequency) transceiver, have the resources (such as batteries and solar cells), and are able to accommodate various sensors and actuators. Nodes communicate wirelessly and are able to organize independently [2]. In this system, XBee was opted as it has complex RF module features that constitute a solution and is considered to be good for building WSN. XBee is expected to reduce costs and become low-power connectivity for equipment which requires a long lifetime of energy but does not require high rate data transfer. A. Low – Energy Adaptive Clustering Hierarchy
(LEACH)
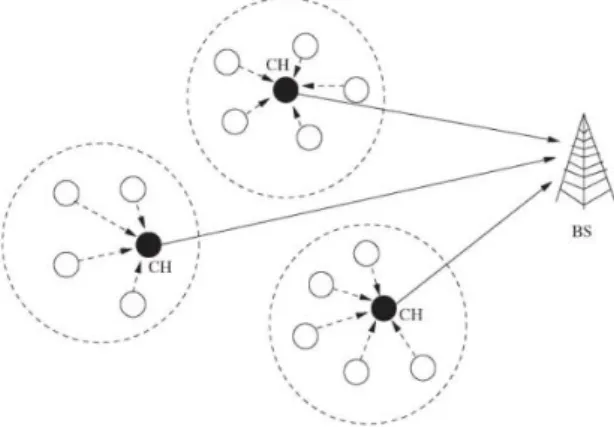
Low-energy adaptive clustering hierarchy (LEACH) is a clustering-based communication protocol proposed by the MIT LEACH project. A hierarchical cluster-based routing protocol, such as LEACH, can be used in the implementation of WSN. LEACH divides network nodes into multiple clusters. Through clustering, nodes organize themselves into a hierarchical structure as shown in Figure 1. In each cluster, a CH is selected and takes charge of its cluster members concerning time division multiple access (TDMA) and delivering the obtained data to the Base Station (BS) [8].
LEACH assumes that every node in the network has a radio frequency transmission power which can reach the nearest BS or CH and directly transmit data to the nearest BS or CH. The nodes select each CH and forward the data to CH, as shown in Figure 2.
Different from traditional multi-hop routing model, cluster-based multi-hop can traverse the network quickly and, at the same time, reduce delay during the process of obtaining data despite the greater distance [9]. Using this approach, each node can also save battery usage. On the
other hand, the additional workload on the nodes which serve as CH can possibly lead to more power consumption. LEACH solves the problem by rotating the CH function to other nodes within its cluster group. LEACH uses code-division multiple access (CDMA) techniques to reduce inter-cluster collisions [8]. The timeline division of each phase on LEACH is shown in Figure 3.
The setup phase is subdivided into 3 phases; Advertisement phase: in which cluster head selection algorithm is executed, Cluster setup: nodes join forces into a cluster, Broadcast schedule: head performs scheduling to broadcast to its cluster member.
𝑇(𝑛)
= {
𝑃
1 − 𝐶𝑃[𝑟 𝑥 𝑚𝑜𝑑(1/𝐶𝑃)] 𝑖𝑓 𝑛 ∈ 𝐺
0 𝑜𝑡ℎ𝑒𝑟𝑤𝑖𝑠𝑒 (1)
In the equation, one algorithm selects the cluster head with a probability, node N selects a random number between 0-1. If m<T (n) for node N, it means that the node is the cluster head, in which P constitutes the percentage of the total number of nodes, r is a temporary round, and G is nodes which have not been a cluster head for 1/P round. By employing this restriction, each node has the opportunity to be a cluster head for 1/P round.
Figure 1. Cluster-based hierarchical sensor network topology
Figure 3. Timeline of LEACH operation
B. Node Design
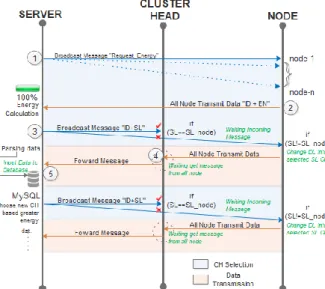
The communication process which refers to WSN is implemented using the LEACH routing protocol in which each node does not directly communicate with the sink/base station, it sends its data through a cluster head (CH), instead. The CH selection depends on the best amount of energy of the node as presented in Figure 4. 1. Node to Server Initialization
When a node is scattered, it takes a point grouping to simplify the analysis, which later is called cluster formation. At this phase, each active node directly delivers data in the form of ID and energy from one server to another within one frame.
2. Cluster Head Selection
A Server which has received information from all nodes on each formed cluster then computes the energy using LEACH algorithm. The algorithm selects the Cluster head of each cluster based on the best energy level by comparing each node within a cluster.
3. Cluster Head to Server Communication
The node selected as CH takes charge in transmitting information in the form of ID, energy and location of the node recorded by the GPS of each node within a cluster. The data are sorted based on the time of data arrival from the node to CH and is divided into data frames so that CH receives the entire data from the nodes. Upon the completion, CH delivers the entire data to the server. The information from the nodes within a cluster is transmitted using RF module to the server.
Figure 4. Flow diagram data transmission mechanism
The server receives data from each CH, the data are stored into the database local storage. When the CH energy decreases from another node, the server takes charge to switch the CH. The CH replacement process aims so that the lifetime of each cluster is sufficiently long. Therefore, the calculation based on the LEACH algorithm is conducted to select the new CH in one cluster. Formerly selected CH becomes a regular node which delivers its personal information to the new CH.
Communication process among node devices uses RF (Radio Frequency) XBee pro S2 module. The voltage supply uses Power bank and sensor INA 219, the GPS Module Receiver uses GPS Bee and the microcontroller uses Arduino Mega 2560, as illustrated in Figure 5. C. Data Frame Format
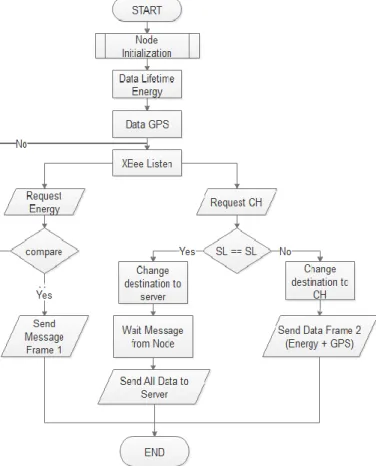
The data frame design is used to map the data format during data transmission, so that each node is able to receive with frame communication mechanism, as in Figure 6. Nodes send information frame of Node ID and energy upon receiving request from the server of "change_dl". The energy obtained constitutes the result of power calculation which is the multiplication between current and voltage, so that the existing energy is known. Based on the LEACH Algorithm, the node with the best energy is selected to be the CH and the server broadcasts the information of the selected CH. When the SL matches, the node becomes the CH and shifts its destination to the server; otherwise, the node shifts its destination to the selected CH. The non-selected nodes as CH send the information frame of energy and GPS data to the CH. CH waits for incoming information on the node. If the information is complete, the CH sorts the information based on the ID number and directly delivers it to the server.
The nodes periodically deliver information so long as there is not any request to switch the CH switch from the Server. The length of bit data information are shown in Table 1.
Figure 6. Flowchart node communication mechanism
TABEL 1
BIT FRAME DATA INFORMATION
Element Data (Char) Data (Bit)
Header 1 8
Splitter 4 32
ID 2 16
Energy 2 16
Latitude 10 80
Longitude 10 80
Total Bit 1 Frame Data 232 Bit = 29 Byte Total Bit 5 Frame Data 29 Byte x 5 = 145 B
D. Client-Server Communication
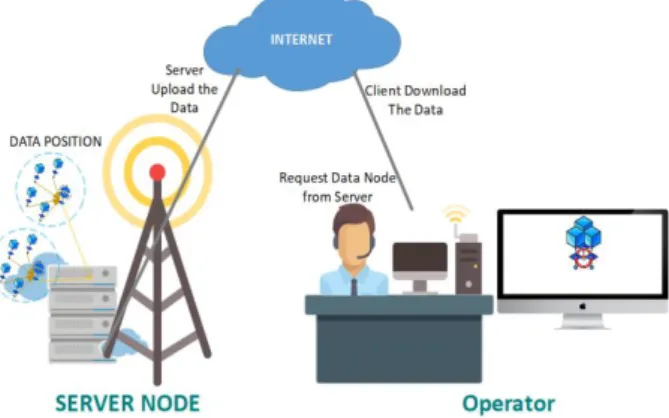
Communication between client and server is required to provide information as an example for the rescue team to monitor the latest location of the accident victim. PC server which has received data frame from Cluster head through an XBee S2 Pro gateway enters the data into the database. Data which are in the form of ID received by the server as the manifest of information data of the passenger, longitude, and latitude. The obtained data in the database are uploaded so that it is accessible to the rescue team through a web-based application. The PC Server serves as the receiver of the frame data of the node through an XBee pro S2 gateway. PC server is designed with C# visual studio programming and comes with MySQL database. Below is the mechanism of PC server, as shown in Figure 7.
III. RESULT AND DISCUSSION
The system quality to be measured is the number of packet loss, the average delay, the number of throughputs
and the average energy value of the system and time of data transmission. Furthermore, testing is conducted on the node to measure the existing power when the node is used to communicate so that the power spent during communication among nodes is known. The tools and materials required for testing, as presented in Table 2.
A. Algorithm Measurement
The entire node monitoring application system begins with the length of the computation. In computational time testing, the system consists of several parts to be tested, from the energy information request to obtaining the entire data node. The test parameters used are as follows:
• Baud rate of sender and receiver: 9600 bps • Sender: Server node
• Receiver: 5 Nodes
• Distance among tested nodes: 10 meters • Environmental conditions: Free space loss
The server delivers broadcast frame information of "Change_DL;" to five active nodes with a 10 meter distance between nodes. At the same time, the server activates the stopwatch function; start () when pressing the start button. The time function is ceased with stopwatch function; stop () when the five data have been received and the server successfully parses the incoming data. The result of measuring the overall time of server system is shown in Table 3.
energy, broadcasting the selected CH in order to obtain latitude and longitude data takes an average time of 42097.2 ms. Such period of time is the reference of the system at the beginning. It is due to the fact that after running one server, initializing the active node is not necessary. After one round, it proceeds to the selection of the best energy and broadcasting information for the computation time is shown in Table 3.
From the overall computation time, the number of system round to be obtained if the power node can last up to 1 hour is presented in the following calculations:
Total round = 3600 s / 42 s
= 85 Cluster head selection/round
Thus, 85 times of cluster head selected is obtained.
Figure 7. Access client-server communication
TABLE 2 MEASUREMENT PROPERTY
No. Property Quantity
1 Node (Arduino Mega, Mega Shield, Xbee Pro 2)
5
2 Powerbank 5
3 FTDI + Xbee Pro S2 Gateway _ USB cable 1
4 Meter Gauge 1
5 Laptop with minimum specification:
Processor Intel Core 2 Duo
Memory Ram 2G DDR3
HDD 320 GB Sata
Arduino Software
Visual Studio 2013 Software
3
6 GPS Bee 5
7 Sensor INA 219 5
8 Multimeter 1
TABLE 3 SYSTEM COMPUTING TIME
Sample Time (ms) Node
1
Node 2 Node 3 Node 4
Node 5
1 41450 46422 44263 47855 40035 2 47991 42009 39941 42209 41450 3 39961 39220 42112 41002 47991 4 40255 39963 44295 39955 39961 5 39963 42004 39977 41299 39937
Average 41924 41923.6 42117.6 42464 41874.8
B. Server System Test
Data which have been obtained by the server are uploaded into the MySQL database. To test the computational time of the process, the web server of this study is hosted in order to access via the internet. When there are incoming data nodes, MySQL database is updated. The updated data includes energy nodes, latitude and longitude. However, the node ID is fixed because it is integrated with the data manifest. The result of time measurement of database upload is shown in Table 4.
From table 4, the average time required to update the new data is approximately 3352.9 ms. Each incoming data in the visual server application c# is directly updated and the web changes the data in its latest. Data change occurs when the web page is refreshed/reloaded, so that every 5000 ms, the web is reloaded to be able to display the updated data.
C. Quality of Service (QoS) Test
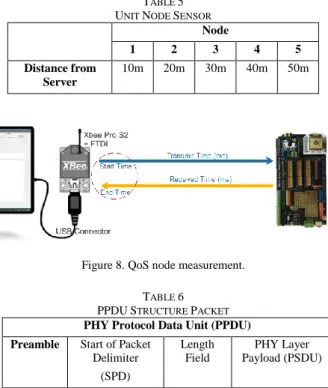
To comprehend the reliability of the network on the implementation of the system, QoS measurement is required which includes throughput, delivery time and Packet Loss Ratio (PLR). The distance of this test is adjusted to the optimal coverage specification of the transmitter as shown in Table 5.
In QoS measurement, the distance greatly affects the delivery and reception times, so that this test has a scenario as in Table 5. Each active node is 10 meters apart with a 10-meter increase on each node. The illustration of the test data is shown in Figure 8.
This test is conducted by variants of data packet divided into Frame data I, Data Frame II and Data Frame Cluster Head which have different size, as shown in Table 1. The size of each data packet to be sent is affected by IEEE 802.15.4 packet structure, as shown in Table 6 [10].
Based on the aforementioned three types of data frames, 6 Bytes of data were added from the formerly formed frame. Thus,
Data Packet I = Preamble + SPD + Length Field + Frame Data I = 4 Bytes + 1 Byte + 1 Byte + 17 Byte = 23 Byte = 184 bits
Data Packet II = Preamble + SPD + Length Field + Frame Data I = 4 Bytes + 1 Byte + 1 Byte + 30 Byte = 36 Byte = 288 bits
Data Packet III = Preamble + SPD + Length Field + Frame Data I =4 Bytes +1 Byte + 1 Byte + 145 Byte = 151 Byte = 1208 bits
TABLE 4 DATA UPLOAD TIME
Sample Time (ms)
1 2695
2 3133
3 2788
4 4332
5 2778
6 3331
7 3003
8 4127
9 3994
10 3348
TABLE 5 UNIT NODE SENSOR
Node
1 2 3 4 5 Distance from
Server
10m 20m 30m 40m 50m
Figure 8. QoS node measurement.
TABLE 6 PPDUSTRUCTURE PACKET
PHY Protocol Data Unit (PPDU) Preamble Start of Packet
Delimiter (SPD)
Length Field
PHY Layer Payload (PSDU)
4 Bytes 1 Byte 1Byte - Bytes
The result of the throughput test and the duration of delivery are shown in Figure 9 and 10. Upon receiving the nodes, the nodes give an acknowledgment of the returned data to the server. The total bits received and the duration of the throughput analysis was calculated. The duration of delivering Frame Data I of 184 bits is faster by 94.9 ms at 10 m and by 129.4 ms at 50 m. Meanwhile, the delivery of Frame Data II of 288 bits took time 172.6 ms at 10 m and 226.7 ms at 50 m. Lastly, sending 1240 bit data took 755.8 ms at 10m and 883.2 ms at 50 m.
The time difference in terms of delivery is the effect of serial communication that is sending the frame data in a series that is one by one. In this case, the larger the frame data is the longer the duration of the delivery. Similarly, the second parameter is the distance from the node; the longer the distance of observation is the longer the duration. When distance becomes the observed variable, the data transmission node works with good throughput. The throughput value also depends on the speed of Mega Arduino response, length of the bit, and distance of measurement.
Figure 9. Frame data transmission duration
Figure 10. Throughput of frame data transmission.
The next QoS test is the Packet Loss Ratio (PLR) which is the testing of packets lost during delivering and receiving the data packet. The test result of the delivered and loss data is shown in Table 7. From the results of data losses in Table 7, it can be analyzed that the possibility of packet losses from several times of data transmission occurs during the delivery of frame data of large data length (bits). In this study, the server receives data packet based on the first node up to the last node, so that the last node, that is node 5 is prone to data loss. If the previous node has lost the data packet, the data is most likely to be stacked which results in larger data loss.
E. Energy Efficiency
In this experiment, the power usage of node when idle noted as Non-CH node and node and during continuous information delivery as cluster head is compared. The test parameters used are as follows:
• Baud rate Sensor INA 219: 115200 bps • Looping Time: 1 second
• Measurement Time: Up to Battery Power Expired • Data Variable: Voltage (V), Current (mA) and
Power (Watts)
• Initial Battery Condition: 7.20 Volt • Battery Capacity: 2000 mAH
The loaded data on the serial monitor is data per second, so the decrease of energy caused by the node can be identified. By measuring the energy at idle and information delivery, the obtained average of the measurement includes voltage (V), current (mA) and power (Watt), as shown in table 8. The result of the current and voltage measurement is shown in Figure 11 and 12, respectively.
The initial battery voltage condition prior to the study was 7.20 volt, in which the battery used is two 3.6 volt battery coupled series so that the total voltage is 7.20 volt. Due to the need for initial power supply, the voltage recorded on the INA 219 sensor is 7 volt. The test was taken every 1 sec until the battery lasts and there is not any power to supply another node, as shown in Figure 13.
1 2 3 4 5
0 100 200 300 400 500 600 700 800 900
Node
Ti
m
e
(
m
s
)
Comparison of Frame Data Transmission
Frame I Frame II Frame CH
1 2 3 4 5
0 0.2 0.4 0.6 0.8 1 1.2 1.4 1.6 1.8
Node
Ti
m
e
(
m
s
)
Troughput of Frame Data Transmission
TABLE 7 BIT DATA LOSSES
Node Frame Data I (184 b)
Frame Data II (288 b)
Frame Data CH (1208) Data loss PLR (%) Data loss PLR (%) Data loss PLR (%)
1 0 0 0 0 0 0
2 0 0 0 0 0 0
3 0 0 0 0 0 0
4 0 0 2 6,7 2 1,34
5 1 5,8 2 6,7 7 4,7
TABLE 8 NODE ENERGY RESULT
Scenario Voltage (V) Current (mA) Power (W) Idle 5,321846 197,1388 1,085686
Sent Packet 5,55418 203,4893 1,161908
Deviation 4,1% 3,1% 6,5%
Figure 11. Node current usage
Figure 12. Node voltage usage
Figure 13. Node power usage
In the implementation, lithium batteries as node power supply can last for 1 hour 35 seconds. The result of this experiment was obtained, the average voltage at idle node is 5.32 V with a current of 197.14 mA so that 1,086 W at 3500 data was recorded. The figure is smaller than when the node delivers information at 5.55 V and a current of 203.49 mA, so that the power obtained is 1.16 W at 3466 data. It is shown from the percentage difference between idle and information delivery of 4.1% voltage and 3.1% current and 6.5% of power differences. This is due to the fact that the power required is greater on nodes which continuously run compared with nodes which wait for information/idle.
In further analysis, the voltage on the battery decreases by an average of approximately 0.001 V with a decreased current with an average of 0.037 mA/second. The serial monitor on the Arduino is disconnected if the power no longer provides sufficient power to the nodes. At idle, the serial monitor is disconnected when the voltage points at 3.62 V and the current point at 139.9 mA, so the minimum power is 0.51 W. Meanwhile, during information delivery, the voltage is disconnected if it points at 3.8 V and 175.6 mA, so that the minimum power required node is 0.67 W. The suitable implementation of energy system requirement is to use a battery with a large capacity, so that the lifespan of the node is longer.
CONCLUSION
The communication network used utilizes ZigBee communication network by adjusting the purpose of the nodes. LEACH algorithm implemented is in accordance with the requirements of the system which can calculate the remaining energy, so that consideration in the selection of nodes to be a cluster head is obtained. The successfully designed and implemented system is able to display data manifest information along with node position that is longitude and latitude into web-based in real-time of 42 seconds computation time so that the total round of cluster head selection is 85 times within an hour. Moreover, the system is able to provide real-time information with a good level of performance that is throughput of more than 1.052 Kbps and packet loss of less than 6.7%. Relatively efficient energy usage tends to cover a large number of rounds. This energy saving can
0 500 1000 1500 2000 2500 3000 3500
0 5 10 Time (s) C u rr e n t (m A )
Node Current Usage (Idle)
0 500 1000 1500 2000 2500 3000 3500
0 5 10 Time (s) C u rr e n t (m A )
Node Current Usage (Send Packet)
0 500 1000 1500 2000 2500 3000 3500
0 100 200 300 Time (s) V o lt a g e ( V )
Node Voltage Usage (Idle)
0 500 1000 1500 2000 2500 3000 3500
0 100 200 300 Time (s) V o lt a g e ( V )
Node Voltage Usage (Send Packet)
0 500 1000 1500 2000 2500 3000 3500
0 0.5 1 1.5 2 Time (s) E n e rg y ( J /1 0 s )
Node Energy Usage (Idle)
0 500 1000 1500 2000 2500 3000 3500
0 0.5 1 1.5 2 Time (s) E n e rg y ( J /1 0 s )
store about 6.5% energy existing on 2000 mAH lithium battery.
ACKNOWLEDGMENT
This work was partially supported by Penelitian Dosen Pemula (PDP) 2018, Ministry of Research, Technology and High Education, Republic of Indonesia.
REFERENCES
[1] K. Langendoen, Medium Access Control in Wireless Networks,
Volume II: Practice and Standards, New York, United States:
Nova Science Publishers, 2008.
[2] P. Antoniou and A. Pitsillides, “Wireless sensor networks control: drawing inspiration from complex systems,” Med Hoc-Net.
Ionian Academy, 2007.
[3] D. Tian and N.D. Georganas, “A coverage-preserving node scheduling scheme for large wireless sensor networks,” In Proc. The 1st ACM International Workshop on Wireless Sensor
Networks and Applications (WSNA ‘02), 2002, pp. 32-41.
[4] A. Salazar, Wireless Sensor Network Simulator. Texas (US): Texas A&M University Thesis, 2010.
[5] M. F. Mosleh, D. S. Talib, “Implementation of active wireless sensor network monitoring using ZigBee protocol,” Journal of
Engineering Science and Technology, vol. 12, no. 11, pp.
3082-3091, 2017.
[6] Y. Wang, “Design and implementation of a wireless sensor network node based on Arduino,” International Journal of Online
Engineering, vol. 13, no.11, pp. 128-135, 2017.
[7] A. Ismail, K. Seddik, “The design and implementation of a constrained WSN for permaculture farming in Egypt,” In Proc. The 2014 IEEE Emerging Technology and Factory Automation
(ETFA), 2014.
[8] R.K. Kodali and N.K. Aravapalli, “Multi-level LEACH protocol model using NS-3,” In Proc. Advance Computing Conference
(IACC), 2014, pp. 375-380.
[9] L.M.A. Cobo, Cluster-based Routing Protocol for Mobile Sensor
Networks. Guelph (CA): University of Guelph Thesis, 2007.
[10] I. Howitt and G. Jose, “IEEE.802.15.4 low rate – wireless personal area network coexistence issues,” in Proc. IEEE
Wireless Communications and Networking (WCNC), 2003, pp.