386
ROMANIAN AVAILABILITY OF SUNFLOWER OIL IN REGIONAL AND
GLOBAL CONTEXT (2009-2011)
PÂNZARU R.L., MEDELETE D.M.
Faculty of Agronomy, University of Craiova
Key words: sunflower oil, total available food, available annual / person available daily / person
ABSTRACT
Sunflower oil is one of the foods with beneficial properties to the body, so it is used all over the world. This is an indisputable source of folic acid, magnesium and tryptophan. It has been scientifically proven that sunflower oil contains certain essential fatty acids for the body. Cold-pressed sunflower oil is very rich in vitamin E, being considered an important source of protection for the arteries and the heart.
In general, the conventional oil production process comprises the following main operations: the reception of raw materials; storage of raw materials; seed cleaning; drying of oilseeds; shelling; grinding; roasting; pressing; solvent extraction; refining.
Food consumption is differentiated according to the differences in the level of development of countries, namely poor, developing and rich countries.
For the EU food security strategy, four important elements can be structured: the rules on food safety and animal feed; independent scientific information available to the public; action to strengthen rules and process control; recognition of the consumer's right to choose, based on complete food information, where it comes from and what it contains. Food security does not mean food uniformity. The food safety system is common to all EU countries, but it allows for the diversity of production methods and national specifics.
INTRODUCTION
Sunflower belongs to the group of technical plants and oleaginous plants, as a result of which the behavior of the market can be conceived in this context.
387
systems, but also due to certain causes specific to the territorial distribution, differentiation of harvesting-takeover periods, presentation form (fresh or dry) etc.
In the exploitation of oil products, the processing system, a complex industrialization, is linked to the great diversity of the components that are extracted and then processed separately.
The sunflower pile and its derivatives can be structured into phases delimited as follows: seed production, processing (usually taking place within industrialization units), packaging, distribution and consumption.
Regarding the oil and margarine balance for the last period in Romania, trends have been reported that can be presented as follows: relative stability of oil production and increase of margarine output; increased oil and margarine imports and insignificant exports; the sharp decline in oil stocks and the shortage of stocks in recent years, especially in situations where exports have taken place; a trend of increasing consumption of oil and margarine in the last period.
Hence, it can be concluded that a significant increase in sunflower production has taken place in Romania, which has involved an important volume for processing in modernized and refurbished factories. Internal consumption of edible oils and margarine is low and price developments reflect a growing trend. This trend has intensified as unfavorable on the world market for seeds and sunflower oil.
METHOD AND MATERIAL
The study was based on the operation of a system of indicators, specific for establishing the availability for some agricultural-food products.
The specific indicators are represented by: total food available (thousand tons), annual food available (kg / pers.), daily available food (g / pers.), daily caloric food available (kcal / pers.) and the available lipid daily (g / pers.) for the period 2009-2011.
In order to highlight the situation at national level, it is presented in an international context, making a comparative analysis of the specific world situation of the European Union and the five main continental units - Africa, America (North, South, Central, Caribbean area), Asia, Europe and Oceania (Australia, New Zealand, Polynesia, etc.).
Elaboration of this study, appealed to the comparison method in space. In addition to the temporal sequences included in the analysis, the media was also operated.
RESULTS AND DISCUSSIONS
Table 1. contains total food available for 2009-2011.
In 2009, the global indicator was 9364094,04 t, of which the contribution at the continental level was the following: 52454,92 t Oceania (0,56%), 742556,93 t America (7,94%), 824279 t Africa (8,80%), 2802105,86 t Asia (29,92%) and 4942697,33 t Europe (52,78%). For the European Union and Romania, levels were 2411381,24 and 242571,17 t respectively (25.75 and 2.59% of the world total).
388
Table 1.
Available food total (thousand tons)
Specification
2009 2010 2011 Average**
Effective* Str.
%** Effective* Str. %** Effective* Str. %** Effective Str. %
Africa 824279,00 8,80 869792,00 9,63 858394,00 9,08 850821,67 9,16 America 742556,93 7,94 803787,99 8,90 885102.29 9,37 810482,40 8,73 Asia 2802105,86 29,92 2428316,73 26,89 2825445,50 29,89 2685289,37 28,93 Europe 4942697,33 52,78 4899249,67 54,24 4841982,93 51,22 4894643,31 52,73 Oceania 52454,92 0,56 30781,25 0,34 41685,40 0,44 41640,52 0,45
World 9364094,04 100 9031927,64 100 9452610,12 100 9282877,27 100 U.E. 2411381,24 25,75 2315210,94 25,63 2289776,52 24,22 2338789,57 25,19 Romania 242571,17 2,59 281768,93 3,12 249522,78 2,64 257954,29 2,78
*http://faostat3.fao.org/download/FB/CC/F (19.12.2016) ** own calculation
If we refer to the specific situation of 2011, there is a global situation characterized by a total available of 9452610,12 t, constituted by percentage contributions as follows: 51,22% Europe (4841982,93 t), 29,89% Asia (2825445,50 t), 9,37% America (885102,29 t), 9,08% Africa (858394 t) and 0,44% Oceania (41685,40 t). The situation of the European Union and Romania is reflected by the weight of 24,22 and 2,64% worldwide (2289776,52 and 249522,78 t respectively).
Based on the data presented above, the average of the period was formed, highlighting the following structural aspects: 9282877,27 t available worldwide; 41640,52 t Oceania (0.45%); 810482,40 t America (8.73%); 850821,67 t Africa (9.16%); 2685289,37 t Asia (28.93%); 4894643,31 t Europe (52.73%) - Figure 1.
Fig. 1. Structure of the total world food supply (%) - the average of the period
For the European Union and Romania, the average available quota was 2338789,57 and 257954,29 t, respectively 25,19 and 2,78% worldwide.
Annual population per capita data is included in Table 2. 9,16
8,73
28,93 52,73
0,45
Africa America Asia
389
Table 2.
Annual food availability (kg/pers.)
Specification
2009 2010 2011 Average**
Eff* % compared
to average ** Eff*
% compared to average ** Eff*
% compared to average ** Eff
% compared to average
Africa 0,91 65,00 0,93 69,92 0,90 65,22 0,91 66,42
America 0,80 57,14 0,86 64,66 0,93 67,39 0,86 62,77
Asia 0,69 49,29 0,59 44,36 0,68 49,28 0,65 47,45
Europe 6,69 477,86 6,62 497,74 6,53 473,19 6,61 482,48
Oceania 1,82 130,00 1,05 78,95 1,41 102,17 1,43 104,38
World 1,40 100 1,33 100 1,38 100 1,37 100
U.E. 4,78 341,43 4,58 344,36 4,51 326,81 4,62 337,23
Romania 11,07 790,71 12,89 969,17 11,44 828,99 11,80 861,31
*http://faostat3.fao.org/download/FB/CC/F (19.12.2016) ** own calculation
Regarding the specific situation in 2009, there is an annual global food available of 1.40 kg / person, compared with higher levels in Europe and Oceania (6.69 and 1.82 kg / person - 477.86 and 130.0%, respectively), but also subunit levels for Africa, America and Asia (0.91, 0.80 and 0.69 kg / person - 65.0, 57.14 and respectively 49.29 %).
For 2010, the indicator ranged from 0.59 kg / person. in Asia, up to 6.62 kg / person. at European level (44.36 and 497.74% respectively), in conjunction with the other situations (0.86, 0.93 and 1.05 kg / person for America, Africa and Oceania - positions at 64.66, 69.92 and 78.95% respectively), the world indicator was 1.33 kg / pers.
If we analyze the specific situation of 2011, there is a global indicator level of 1.38 kg / pers., with limits of 0.68 kg / person. in Asia (49.28%) and 6.53 kg / person. in Europe (473.19%). The rest of the continents recorded: 1.41 kg / person. Oceania (102.17%), 0.93 kg / pers. America (67.39%) and 0.90 kg / pers. Africa (65,22%).
For the European Union, there are sequential levels of annual food availability of: 4.78, 4.58, 4.51 and 4.62 kg / pers. (2009, 2010, 2011 and the average of the period respectively), while the national situation was the following: 11.07, 12.89, 11.44 and 11.80 kg / pers. (2009, 2010, 2011 and the average of the period).
The average of the period reached 1.37 kg / person worldwide, compared with the continental situation: 52.55% Asia (0.65 kg / pers.); 37.23% America (0.86 kg / pers.); -33.58% Africa (0.91kg / pers.); + 4.38% Oceania (1.43 kg / pers.); + 237.23% European Union (4.62 kg / pers.); + 382.48% Europe (6.61 kg / pers.); + 761.31% Romania (11.80 kg / pers.).
The available daily / inhabitant (g / day / person) is shown in table 3.
Regarding the specific situation of 2009, there is a global level of the indicator of 3.83 g / person, compared to which are found both subunit levels (49.09, 57.18 and 64.75% respectively 1.88, 2, 19 and 2.48 g / pers. for Asia, America and Africa) as well as supra-unit values (130.55, 342.04, 478.59 and 791.91% - 5.0, 13.10, 18, 33 and 30.33 g / pers. respectively for Oceania, European Union, Europe and Romania).
390
Table 3.
Available daily food quantity (g/pers.)
Specification
2009 2010 2011 Average**
Eff* % compared
to average ** Eff*
% compared to average ** Eff*
% compared to average ** Eff
% compared to average
Africa 2,48 64,75 2,55 69,86 2,46 65,08 2,50 66,67
America 2,19 57,18 2,35 64,38 2,56 67,72 2,37 63,20
Asia 1,88 49,09 1,61 44,11 1,85 48,94 1,78 47,47
Europe 18,33 478,59 18,14 496,99 17,90 473,54 18,12 483,20
Oceania 5,00 130,55 2,89 79,18 3,86 102,12 3,92 104,53
World 3,83 100 3,65 100 3,78 100 3,75 100
U.E. 13,10 342,04 12,54 343,56 12,36 326,98 12,67 337,87 Romania 30,33 791,91 35,31 967,40 31,35 829,37 32,33 862,13
*http://faostat3.fao.org/download/FB/CC/F (19.12.2016) ** own calculation
As far as the state of affairs in 2011 is concerned, the indicator at the global level reached 3.78 g / pers., with more favorable conditions for Asia, Africa and America (1.85, 2.46 and 2, 56 g / pers., respectively decreases compared to the level of comparison with 51.06, 34.92 and 32.28%, respectively), but also with more favorable situations in Oceania, the European Union, Europe and Romania (3.86, 12 , 36, 17.90 and 31.35 g / pers. - outflows of 1.02, 3.26, 4.73 and 8.29 times, respectively, of the reference period - the global level of the indicator).
The average of the period is characterized by an actual global level of the indicator of 3.75 g / person, with the following positions being found: 52.53% Asia (1.78 g / person); -36.80% America (2.37 g / pers.); -33.33% Africa (2.50 g / pers.); + 4.53% Oceania (3.92 g / pers.); + 237.87% European Union (12.67 g / person); + 383.20% Europe (18.12 g / pers.); + 762.13% Romania (32.33 g / pers.).
The data on the daily availability of milk expressed in kcal / person are presented in Table 4.
Table 4.
Available daily caloric food (kcal/pers.)
Specification
2009 2010 2011 Average**
Eff* % compared
to average ** Eff*
% compared to average ** Eff*
% compared
to average ** Eff
% compared to average
Africa 22 64,71 23 71,88 22 66,67 22,33 67,67
America 19 55,88 21 65,63 22 66,67 20,67 62,64
Asia 17 50,00 14 43,75 16 48,48 15,67 47,48
Europe 162 476,47 160 500,00 158 478,79 160,00 484,85
Oceania 41 120,59 25 78,13 33 100,00 33,00 100,00
World 34 100 32 100 33 100 33,00 100
U.E. 116 341,18 111 346,88 109 330,30 112,00 339,39
Romania 266 782,35 311 971,88 276 836,36 284,33 861,61
*http://faostat3.fao.org/download/FB/CC/F (19.12.2016) ** own calculation
Analyzing the 2009 specific situation, indicators of variation of the indicator from 17 kcal / pers. are found. for Asia (-50.0% compared to the world situation), up to 266 kcal / pers. in the case of Romania (7.82 times the global situation) and the overall indicator level reached 34 kcal / pers. Compared to this level, subunit values (America and Africa - 19 and 22 kcal / pers., respectively -44.12 and -35.29% versus the world level), as well as supra-unit levels (Oceania, European Union and Europe - 41, 116 and 162 kcal / pers., global 1.20, 3.41 and 4.76 respectively).
(-391
34.37%), 23kcal / pers. Africa (-28.12%), 25 kcal / pers. Oceania (-21.87%), 111 kcal / pers. European Union (+ 246.88%), 160 kcal / pers. Europe (+ 400%) and 311 kcal / pers. Romania (+ 871.88%).
At the level of 2011, there is a variation of the indicator of 16 kcal / pers. in Asia and 276 kcal / pers. in the case of Romania, to which the situation specific to the other analyzed entities adds a world level of 33 kcal / pers. The relative values of the sequential indicators were higher for Romania (836.36%), Europe (478.79% - 158 kcal / pers.), the European Union (330.30% - 109 kcal / pers.), Oceania (100% - 33 kcal / pers.) and subunits for Africa and America (66.67% respectively) Asia (48.48%).
If we refer to the average of the period, there is a global indicator level of 33 kcal / pers., against which the analyzed territorial units were placed as follows: -52,52% Asia (15,67 kcal / person); -37.36% America (20.67 kcal / pers.); -32.33% Africa (22.33 kcal / pers.); equivocal level for Oceania (33 kcal / pers.); + 239.39% European Union (112 kcal / pers.); + 384.85% Europe (160 kcal / pers.); + 761.61% Romania (284.33 kcal / pers.).
Table 5 shows the daily protein availability data, expressed in grams per person.
Table 5.
Available protein daily (g/pers.)
Specification
2009 2010 2011 Average**
Eff* % compared
to average ** Eff*
% compared to average ** Eff*
% compared to average ** Eff
% compared to average
Europe 0,03 - 0,03 - 0,03 - 0,03
-Oceania 0,03 - 0,01 - 0,02 - 0,02
-U.E. 0,01 - 0,01 - 0,01 - 0,01
-Romania 0,04 - 0,04 - 0,04 - 0,04
-*http://faostat3.fao.org/download/FB/CC/F (19.12.2016) ** own calculation
Existing statistical data refers only to four entities, namely: Europe with a unit level of the indicator of 0.03 g / person; Oceans showing variations from 0.01 to 0.03 g / person (2010 and 2009 respectively), which lead to an average of 0.02 g / person; European Union with a constant level of 0.01 g / person; Romania with a situation characterized by a constant level of 0.04 g / person, throughout the entire dynamic series.
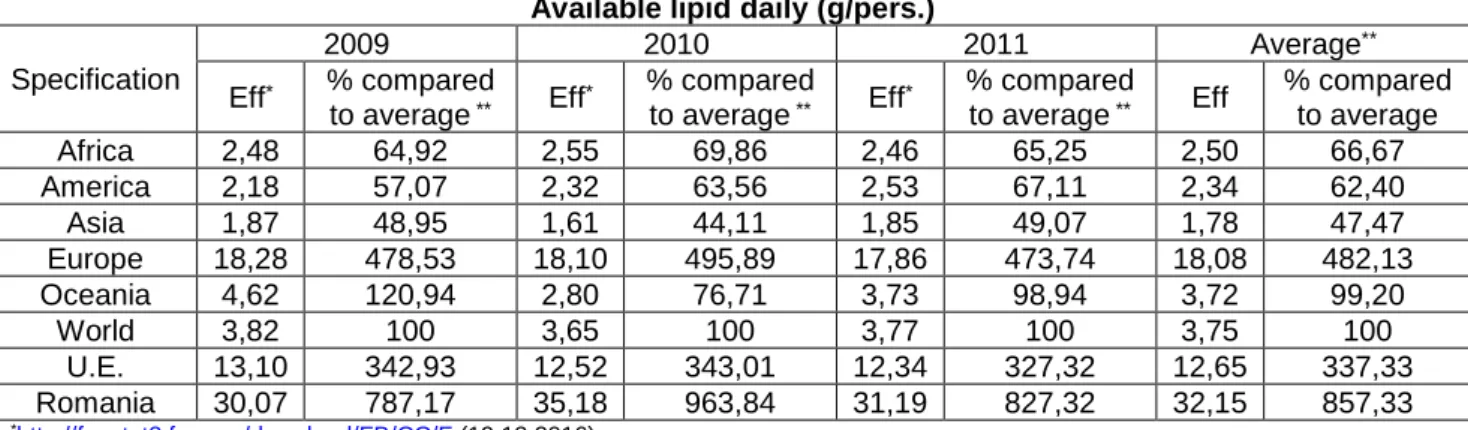
Table 6 shows the daily lipid availability data, expressed in grams per person.
Table 6.
Available lipid daily (g/pers.)
Specification
2009 2010 2011 Average**
Eff* % compared
to average ** Eff*
% compared to average ** Eff*
% compared to average ** Eff
% compared to average
Africa 2,48 64,92 2,55 69,86 2,46 65,25 2,50 66,67
America 2,18 57,07 2,32 63,56 2,53 67,11 2,34 62,40
Asia 1,87 48,95 1,61 44,11 1,85 49,07 1,78 47,47
Europe 18,28 478,53 18,10 495,89 17,86 473,74 18,08 482,13
Oceania 4,62 120,94 2,80 76,71 3,73 98,94 3,72 99,20
World 3,82 100 3,65 100 3,77 100 3,75 100
U.E. 13,10 342,93 12,52 343,01 12,34 327,32 12,65 337,33 Romania 30,07 787,17 35,18 963,84 31,19 827,32 32,15 857,33
*http://faostat3.fao.org/download/FB/CC/F (19.12.2016) ** own calculation
392
world), 2.18 g / pers. America 42.93% compared to the world), 1.87 g / pers. Asia (-51.05% vs. world).
For the year 2010, the variation limits of the indicator are 1.61 g / pers. in the case of the Asian continent (44,11% compared to the world level) and 35,18 g / pers. respectively. for Romania (963.84% compared to the global general situation), and the world level reached 3.65 g / pers. There are inappropriate situations in Africa, America and Oceania (2.55, 2.32 and 2.80 g / persons - 69.86, 63.56 and 76.71%, respectively), but also more favorable situations compared to the world level for the European Union and Europe (12.52 and 18.10 g / pers. - 343.01 and respectively 495.89%).
If we analyze the situation of the daily lipid available for 2011, we can observe a global level of the indicator of 3.77 g / pers., which is higher (Romania, Europe and the European Union - 31.19, 17.86 and 12.34 g / pers. respectively compared with the comparison term of 8.27, 4.73 and 3.27 times respectively), but also lower values (Oceania, America, Africa and Asia - 3.73, 2, 53, 2.46 and 1.85 g / person respectively decreases from the reference level by 1.06, 32.89, 34.75 and 50.93%, respectively).
If we refer to the average of the period, there is a global level of the indicator of 3.75 g / person, to which the analyzed territorial units were placed as follows: -32.53% Asia (1.78 g / pers.); -37.60% America (2.34 g / pers.); -32.33% Africa (2.50 g / pers.); -0.80% Oceania (3.72 g / pers.); + 237,33% European Union (12,65 g / person); + 382.13% Europe (18.08 g / pers.); + 757.33% Romania (32.15 g / pers.).
CONCLUSIONS
In the case of total available food (t) Europe prevails (almost 52.73% of the total) followed by appreciable distances from Asia (28.93%), while Africa, America and Oceania share less than 10%. The variation of the indicator is uneven (a situation that is found for most of the analyzed entities, with the exception of America and the European Union with upward and downward developments).
The available annual food (kg / person) has a fairly large amplitude (11.15 kg), which highlights the different potentials of the continents, as we discuss a rather large variation in the number of inhabitants and the existence of other plants as a source of food oil (soybeans, corn, peanuts, etc.). The evolution over time of the indicator has been uneven across the world (except for this trend made America, Europe and the European Union - ascending evolution in the first case and downward developments for the last two cases).
The available daily food quantity (g / pers.) was 3.75 g / person, compared to which were found favorable situations in Oceania, the European Union, Europe and Romania (advances at the world level from 1.04 at 8.62 times) but also less convenient situations for the rest. Evolution of the indicator is fluctuating globally (similar situations for Africa, Asia, Oceania and Romania), while for America the evolution is ascending, in the case of Europe and the European Union the evolution is descending.
The available daily caloric food (kcal / pers.) Shows fairly wide variation ranges (from 15.67 to 284.33 kcal / pers. in Asia and Romania respectively, with an average of 33.0 kcal / person). The evolution of the global level of the indicator has been fluctuating (the same phenomenon appears for Africa, Asia, Oceania and Romania), with exceptions: upward trends for America, downward trends for Europe and the European Union.
The available daily protein (g / pers.) is uniform in Europe, the European Union and Romania (0.03, 0.01 and 0.04 g / person respectively) and unevenly in Oceania.
393
also appears for Africa, Asia, Oceania and Romania. In the case of the American continent, we are talking about an upward trend in the indicator, while Europe and the European Union are characterized by downward trends in daily lipid availability.
BIBLIOGRAPHY
1. Asworth S., Fraser N., Leat P., 2003, The agro-food chain in Romania: on the road to accession, MAPAM Bucharest.
2. Barbu C., Pânzaru R.L., 2000, Agrarian Economy, Hyperion Publishing House, Craiova.
3. Constantin M., et al., 2009, "Marketing of Agro-Food Production", Agro Tehnica Publishing House, Bucharest.
4. Comstatin M., 2016, Dictionary of agromarketing, Tribuna Economică Publishing House, Bucharest.
5. Mâlcomete P., et al., 1994, "Internal and International Marketing Lexicon", Junimea Publishing House, Iasi.
6. Pânzaru R. L., Medelete D. M., Ștefan G., 2007, Elements of Management and Marketing in Agriculture, Universitaria Publishing House, Craiova.
7. Pânzaru R. L., Medelete D. M., Ștefan G., 2009, Economics of Vegetable Production, Publishing House Universitaria, Craiova.
8. http://faostat3.fao.org/download/FB/CC/F