Page
TABLE OF CONTENTS... i
LIST OF FIGURES ... v
LIST OF TABLES ... vi
ACKNOWLEDGMENTS... vii
ABSTRACT ... viii
L INTRODUCTION A. Background on Incineration... 1
B. Scope of Project ... 3
C. Literature Review ... 4
11. METHODS AND MATERIALS A. Description of Incinerator ... 9
B. Waste Combustion Process ... 9
C. Incineration Procedure ... 12
D. Description of Animals Used for Test Burns ... 13
E. 35s Sulfate Used for Test Burns ... 13
F. 35s Methionine Used for Test Burns... 14
G. Overview of Burns ... 14
H. Breakdown of the 18 Burns ... 15
I. Burn Sequence... 15
K. Sampling Methods 1. Description of Ash ... 16
2. Rough Ash Sampling... 16
3. Ground Ash Sampling ... 17
J. Liquid Scintillation Counting
1. Theory of Operation ... 18
2. Problems with Quench ... 19
3. Quench Curves and Standards ... 20
4. Ash Settling ... 22
5. Measurement of Rough Ash with the Liquid Scintillation Counter ... 27
6. Measurement of Ground Ash with the Liquid Scintillation Counter ... 28
7. Measurement of Extract Fluid with the Liquid Scintillation Counter ... 28
K. Windowless Gas Flow Proportional Counter 1. Theory of Operation ... 30
2. Characteristic Curve for Proportional Counter ... 31
3. 35s Extract Fluid Standard for the Proportional Counter ... 33
4. Measurement of Extract Fluid with the Proportional Counter ... 35
5. Ash Sample Size for Proportional Counter .... 35
6. Measurement of Ash with the Proportional Counter ... 37
III. RESULTS A. Statistical Analysis of the Data... 41
B. Problems Encountered in Rough Ash Measurement ... 41
C. Mass Reduction Efficiency of the Incinerator ... 43
D. Calculation of Retention Efficiency ... 46
F. Effects of Glass on Retention Efficiency... 52
G. Comparison of Sampling Methods ... 54
H. Determination of Extraction Procedure Efficiency ... 54
I. Differences Between Detectors ... 61
IV. CONCLUSIONS ... 64
V. RECOMMENDATIONS ... 67
VI. LIST OF REFERENCES ... 68
VII. APPENDICES A. Extraction Procedure ... 70
B. Procedure for Using the Proportional Counter ... 72
C. Set-up for the Proportional Counter ... 73
D. Calculation of Activity for Ash Using Data Obtained from the Proportional Counter ... 74
E. Calculation of Activity for Extraction Fluid Using a Proportional Counter ... 76
F. Calculation of Retention Efficiency ... 77
G. Retention Efficiencies 1. Rentention Efficiencies for Different Chemical Forms of 35s ... 78
2. Retention Efficiencies for Burns with Glass and without Glass ... 79
3. Retention Efficiencies for the Different Detectors ... 80
4. Mass Reduction Efficiencies... 80
2. Data on the Calculation of the Activity of the Ash Using the Liquid Scintillation
Counter ... 82
3. Data on the Calculation of the Activity of the Extract Fluid Using the Liquid
Scintillation Counter ... 83
4. Data on the Calculation of the Activity of the Extract Fluid Using the Proportional
Counter ... 84
Calculation of the Retention Efficiencies
1. Data for the Calculation of Retention
Efficiency Using the Ash and the
Proportional Counter ... 85
2. Data for the Calculation of Retention
Efficiency Using the Ash Measured with
a Liquid Scintillation Counter ... 86
3. Data for the Calculation of Retention Efficiency Using Extract Fluid and the
Liquid Scintillation Counter ... 87
4. Data for the Calculation of Retention
Efficiency Using the Extract Fluid and the
Page 1. Controlled Air, Dual Chamber, Pathological
Waste Incinerator... 10
2. Quench Curve for Ground Ash ... 21
3. Quench Curve for Extraction Fluid and Carbon Tetrachloride ... 23
4. Settling Pattern of Ash over Time Using Ash from Burn 3 ... 24
5. Settling Pattern for Extraction Fluid from Burn 3 ... 25
6. SIE and CPM for Several Ash Quantities ... 29
7. Plateau Curve for 35S Ash Standard ... 32
8. Relationship between the Activity Measured and the Amount of 35S Standard Added ... 34
9. Count Rate vs. Ash Weight for Ash with Standard Added... 38
10. Absolute Efficiency vs. Weight for Ash with Standard Added ... 39
11. Comparison of Rough Ash and Ground Ash Using Ash from Burn 17 ... AA 12. Mass Reduction of Incinerated Wastes ... 45
13. Retention Efficiency Measured by Proportional Counter ... 55
LIST OF TABLES
Page
1. Analysis of Variance ... 42
2. Mass Reduction of Incinerated Wastes ... 47
3. Retention Efficiencies for Ash and Extract Fluid ... 48
4. Effects of Chemical Form and Glass on
Retention Efficiencies ... 50 5. Effects of Chemical Form on Retention Efficiencies ... 5 1
6. Effects of Glass on Retention Efficiencies ... 53
7. Activities of Ash and Extract Fluid from Consecutive
ACKNOWLEDGMENTS
I wish to thank the following people in the Health and Safety Branch
at NIEHS for their help and advice:
Chris Hunt
Valeria Shropshire
Scott Merkle Patricia Deese Diane Wilson
Thanks to my committee members Dr. Philip Hamrick, Dr. James
Watson and Dr. Douglas Crawford-Brown for their guidance, suggestions and constructive criticism.
A special thanks to Dr. Philip Hamrick, William Fitzgerald and
Thomas Smith for their guidance and expert advice. It was a pleasure and a honor working with them.
WILLIAM E. DAVIDSON. The Measurement of 35S Retention in
Incinerator Ash. (Under the Direction of Dr. Philip E. Hamrick and Dr. James E. Watson, Jr.)
ABSTRACT
The two main objectives of this study were to measure
quantitatively the retention of 35$ in residual incinerator ash and to
determine the optimal ash sampling method for use at NIEHS. In
pursuing these objectives, 12 test burns with known activity and 6
control burns were performed using a dual chamber, starved-air,
pathological waste incinerator.
The two variables examined for their affects on the retention
efficiency of 35s in the ash were the type of vial incinerated (glass vs.
polyethylene) and the chemical form of 35s (methionine vs. sulfate).
The three sample forms tested were ash taken directly from the incinerator, ash ground in a jar mill grinder and extraction fluid obtained using EPA's Extraction Procedure and Toxicity Test Method
1310. Samples from all 18 burns were counted using a liquid
scintillation counter and a gas flow proportional counter. Because the data collected on the rough ash were considered to be biased and
inconsistent, they were not used for any calculations of retention or mass reduction
A statistically significant difference in the mean 35s retention
was found between the methionine and sulfate forms of 35s. The
for methionine was 1.51%. Ash from burns containing polyethylene and glass vials had a mean retention efficiency of 8.22% which was
significantly higher than the 3.84% for burns with polyethylene vials only.
It was concluded that until further research is done on the
extraction procedure it is best for NIEHS to use the gas flow
proportional counter and ground ash for routine sample counting to
Background on Incineration
The National Institute of Environmental Health Sciences
(NIEHS) is a biomedical research facility. Like other research
facilities NIEHS uses radioactive materials in much of its research
and must dispose of the radioactive materials once they become a
waste.
Burial in a low-level radioactive waste site in the past was the
most widely used form of disposal for low-level radioactive wastes. However, due to the increased cost of landfiUing low-level
radioactive wastes, many facilities are turning to incineration, which
has been shown to be an economically feasible alternative to landfill
disposal (Gregory and MaiUe, 1975; Glauberman and Loysen, 1963: Machis and Geyer, 1952).
The incineration process thermally oxidizes the organic
constituents in the waste stream and converts all the wastes into a
stabilized non-combustible form while greatly reducing the mass of
the wastes. Most wastes can be reduced to less than 10% of their
original mass (Glauberman and Loysen, 1963). The degree to which
the mass of the wastes is reduced affects the disposal cost. Reducing wastes to the smallest mass possible results in lower disposal costs.
The residual ash from the waste must be disposed of in an
appropriate land burial facility. The license granted by the Nuclear Regulatory Commission allows NIEHS to dispose of residual ash in a
municipal landfill if it contains a concentration of one or more
limits in 10 CFR 20 Appendix B then the ash must be shipped to a
low-level radioactive waste landfill which usually results in an large
increase in shipping and burial costs.
According to the U.S. Atomic Energy Commission (1970) the principal
benefits arising from incinerating combustible radioactive solid
wastes are:
1 - Volume Reduction - The reduction of wastes through incineration reduces the space needed for land burial. This results in less
material needed for packaging and less land needed for burial
2- Conversion of the Wastes to Noncombustlble State - Spark induced fires are common in normal landfill operations. Since the ash is non-combustible, it does not represent a
fire hazard.
3- Improved Lone-Term Environmental Safetv Conditions - Since there is a smaller volume of material, it is easier to monitor and maintain the site. The ash is also less likely to leach into
the ground water.
4- Retrievabilitv - Until a final solution is found for the disposal of radioactive wastes, it is necessary to maintain retrievability..
Incinerated wastes would be easier to retrieve and rehandle.
ͣ
S- Incineration Would Minimize Land Requirements for Burvine
Radioactive wastes - In recent years landburial has become increasing less acceptable for waste disposal and siting new landburial facilities has become very difficult. Because of the large reduction in the mass of the wastes through incineration,
1969. The three most common radioisotopes incinerated at NIEHS
are l^^C, 3h and 35s. Since 1980, the use of 35s has increased by a
factor of 10 while the use of I'^C and 3h has increased only slightly.
The fate of 35s was investigated in a previous study at NIEHS by
measuring activities in refractory ash and gaseous effluent (Hamrick
et al.. 1989).
The study by Hamrick et al. (1989) concentrated mainly on the
measurement of radioactivity in the gaseous effluent. However, some ash samples were collected and counted using a liquid
scintillation counter. The activities accounted for in both the ash and
the gaseous effluent summed to less than 50% of the total in 3 of the
11 burns and less than 95% in 9 of the 11 burns. This resulted in
doubts about the accuracy of the method for measuring the ash.
The present study investigated 33s levels in the residual ash
only. The 35s concentration in the residual ash was measured using
three sampling methods; ground ash, rough ash and extraction fluid obtained using the EPA's Extraction Procedure and Toxicity Test
Method 1310. The activity of the samples was determined using a
liquid scintillation counter and a gas flow proportional counter.
In the present study, two forms of 35s, a organic (methionine)
and an inorganic (sulfate), were examined for their effects on the
retention of 35s in the residual ash under normal operating
conditions at NIEHS. The 35s was added to several scintillation vials
be found in the waste stream at NIEHS.
By determining the extent to which different chemical forms of
a radioisotope are retained in the ash, NIEHS can make better
economic decisions concerning their disposal. Wastes containing chemical forms of radioisotopes, retained in ash in high quantities compared to other chemical forms, could be separated and held for
decay before being incinerated. Disposal costs could then be reduced
by storing the wastes containing the isotope forms which were retained in higher amounts until they had decayed to a lower
activity. At this activity they could be incinerated and disposed of in
a municipal landfill. Wastes containing isotope forms which are
retained, in the ash, in lower amounts could be incinerated without
storage and disposed of in a municipal landfill.
Incineration of glass may also affect the retention of
radioactivity. Instead of being released out the stack as gaseous
effluent, the radioisotopes may adhere to the glass and remain in the
residual ash thus making a higher concentration of radioactivity in
the ash. The effects of glass on the retention of 35s in the residual
ash and on the mass reduction of wastes were examined in this study.
Literature Review
The use of radioisotopes for research in the United States has increased significantly since 1945 (Machis and Geyer, 1952).
Because incineration is a practical and economical means of waste
burial costs (Glauberman and Loysen, 1963). A 95% mass reduction of wastes is common for incinerators (Glauberman and Loysen, 1963; Classic et al., 1985). Some of the major factors considered in
determining the feasibility of incineration are activity, half-life,
maximum permissible air concentration of the isotope and the size of
the animal carcass incinerated (Gregory and Maille, 1975).
With the increase in incineration of radioactive wastes comes the need to determine the fate of the radioisotopes. No significant difference has been found, in previous studies, (Bush and Hundal,
1972; Hamrick et al., 1989) in the retention of 35$ between chemical
forms. However, the tests were not usually representative of normal
operating conditions. In the Bush and Hundal study (1972), the animals and activity were put in stainless steel containers to be
incinerated and were not mixed with the rest of the wastes. In the
Hamrick et al. study (1989) the waste stream that was burned
during the tests was not the same as the typical waste stream at that installation.
During incineration the radioisotopes are deposited, in various proportions, in the gaseous effluent, residual ash and on the interior of the stack (Machis and Geyer, 1952). Bush and Hundal (1972) reported that the fate of incinerated radioactive material was dependent upon several factors including:
Bush and Hundal reported in 1972 that the retention of 35s in
ash for two inorganic forms of 35$ ranged from 10 to 90% for 35s sodium sulfate and from 40 to 77% for potassium sulfate. This
difference was not found to be significant. No significant difference in retention was detected for various chemical and physical forms of
32p and I25i. Samples on the order of a few [iCi or less were used.
These samples were placed in small metal cans, covered with screens
and put into an incinerator with non-radioactive waste.
A study performed by Classic et al. (1985) reported a 0%
retention of 35s in the ash for Guinea pigs which were placed in
stainless steel containers for incineration and injected with labeled
microspheres.
Katsikis et al. (1984) reported that no activity remained in the ash when ^'^C, 3H and 35s were incinerated with other pathological
wastes. They believed, a priori, that complete combustion would
result in all l^C, 3h and 35$ going up the stack as CO2 , H2O and SO2.
No details were given on the testing methods.
In 1952, a study at The Johns Hopkins University (Machis and
Geyer, 1952) found that 20 to 100% of the radionuclide 32p remained
in the ash after incineration. The reasons given for the wide
variability in the results were the difficulty in mixing the samples due to the range in particle size and the limitation on the sample size
Knapp (1984) studied the fate of I'^C and 3h during incineration
at NIEHS. No activity was found on the refractory surface and less than 0.1 % was found in the ash. It was assumed, therefore, that
99.9% of the l^^C and 3h went out the stack as off-gases.
A study was conducted at NIEHS (Hamrick et al., 1989) to
measure the amount of 35s that was contained in stack effluent and
in the refractory ash. Approximately 2.3% of the 35s methionine and
4.3% of the 35s sulfate was measured in the ash. However, only a
total of 89% of the 35s methionine and 37% of the 35s sulfate was
detected in the ash and gaseous effluent. The aqueous 35s samples
were placed in plastic jugs and the plastic jugs were placed in boxes
for incineration.
The studies presented here give ranges of 35s retention in ash
from 0 to 90%. The main difference between the studies seems to be
the testing procedures. There is wide variability between the testing
procedures of the studies. These differences in the testing
procedures may account for the variability in the retention of 35s.
Because of previous problems at NIEHS with measuring the ash directly in a liquid scintillation counter, an extraction procedure developed by the EPA was tested in this study. The extraction procedure was designed to quantify the metals, pesticides and
herbicides present in the solid wastes (Kimmell, 1986). This is done
by removing the substance of interest from the solid waste into a
(Ham et al.. 1978). *
For this study, it was thought that by removing the 35s from
the ash into the extraction fluid the total amount of 35$ originally in
A controlled air, dual chamber pathological waste incinerator
was used for this study (Figure 1). The incinerator is owned and
operated by NIEHS and is permitted to burn up to 125 ft3/hr or 350
Ib/hr of type IV waste. Type IV waste consists mainly of organics
which contain up to 85% moisture and have a heating value of 1000
Btu/lb. The incinerator is also licensed by the Nuclear Regulatory
Commission (NRC) to burn radioactive wastes. The lower chamber is heated by four 350,000 Btu/hr natural gas burners and the upper
chamber has one 1.5 x 10^ Btu/hr burner with a burner blower for
creating turbulence which supplies the excess oxygen and mixing
needed for complete combustion. The upper chamber of the
incinerator has been modified to allow for a 2 second residence time
to ensure that the wastes are completely combusted.
Waste Combustion Process
The incineration process utilizes thermal decomposition to
destroy the organic part of the waste and to reduce its total volume
(Oppelt, 1987). Under optimal operating conditions nearly all
combustable wastes will be in the form of residual ash or gaseous
effluent consisting of CO2 and H2O. It is not known if the incinerator
used for this study was operating under optimal conditions.
Wastes are pushed into the lower chamber via a hydraulic ram
charger. The lower chamber is normally operated at a temperature
of between 1200 - 1800 degrees F with 50 - 80% excess air. Due to
Figure I
Controlled Air. Dual Chamber, Pathological
Waste Incinerator
STACK
ROOF
DOOR
FAN
UPPER
BURNER
UPPER
CHAMBER
/,^
\
LOVER
CHAMBER
LOVER BURNERS
AIR
litff ft
0 0 0 0 0 0 0
RAM
LOADER
CONTHOL PANEL
#
This results in the formation of volatile hydrocarbons. CO andcombustion products. The secondary chamber normally has
100 - 200% excess oxygen and a temperature of 1400 - 2000
degrees F. The high temperature, high turbulence, and long
residence time of the secondary chamber results in the complete combustion of the CO and volatile hydrocarbons from the primary chamber. A 100% combustion efficiency can be obtained under
optimum operating conditions in which only water vapor (H2O) and
CO2, and in this case SO2, compounds would be discharged via the
stack. All other non-combustible material would remain as residual
ash.
2 C (waste) + O2 (air)---i>' CO (product of incomplete
combustion)
2 CO + O2 (air)---^ CO2 (product of complete
combustion)
2 H2 (waste or air) + O2 (air) ~^ H2O (water vapor)
Incineration Procedure
For each burn, five cardboard boxes were filled with 65 - 75 kg
of used rat bedding (wood shavings), 800 scintillation vials (Packard
Instrument Co., Inc., Meridan, CT) containing scintillation fluid (Ready
Safe, Beckman Instruments, Inc. FuUerton, CA) and approximately 50
sheets of lab bench paper (ATD American Co., Wyncote, PA). There
were also 5-12 boxes of assorted size containing a total of 75 - 85
kg of mouse and rat carcasses. These items are typically found in the
waste stream at NIEHS in variable amounts. The decision on the type
and quantity of each material incinerated during the test burns was
based on comments made by the incinerator operator on what was in
a typical NIEHS waste stream.
For each of the spiked burns 35s, in aqueous form, was pipetted
into 80 - 120 out of a total of 800 vials. The boxes were loaded into
the incinerator at a rate of 1 - 2 every 7 minutes, alternating between boxes containing animal carcasses and boxes containing
scintillation vials, animal bedding, and lab bench paper. There were
no boxes burned until the incinerator temperature was 1300 - 1400
degrees F in the primary chamber and 1800 - 1900 degrees F in the
secondary chamber. The incinerator continued burning at these
temperatures for 6 hours after the last box was loaded, at which time
it automatically shut itself down. The incinerator was allowed to cool
down over night after each burn. After cooling, the ash was swept from the bottom of the refractory using a straw broom and a flat-headed shovel. The ash was collected in a bucket and weighed on a
triple beam balance (Ohaus heavy duty solution balance, Florham
#
Description of Animals Used in Test BurnsNIEHS conducts much of its research using laboratory mice and
rats. After the animals are sacrificed, they are put into boxes which
are placed in large freezers for storage. The animals were taken from these freezers to the incinerator. The boxes, which varied in
size, usually contained between 50 and 100 mice or between 2 and
30 rats in each box. Each box was labeled with information about the
radionuclides, if any, contained in the animals. The labels on the
boxes used for this study were checked to ensure that only
uncontaminated rats and mice were burned.
35s Sulfate Used for Test Burns
The 5 mCi of 35s sulfate solution used in the spiked 35s sulfate
burns was obtained in a 1 ml volume from New England Nuclear
Research Products, Inc. (E.I. duPont deNemours and Co., Bilerica, MA).
Six 100 |il aliquots of 35s sulfate (0.5 mCi each) were pipetted into
six 100 ml volumetric flasks. The flasks were each filled with 100
ml of distilled water and mixed by inverting them several times. Six
25 III aliquots were pipetted from each flask and placed into 7 ml
scintillation vials to be counted by a liquid scintillation counter (LSC).
All sample vials to be counted in the LSC were filled with liquid
scintillation cocktail (Biofluor, NEN Research Products, Boston, MA)
and mixed using a Vortex Genie (Scientific Industries, Inc.) before
being placed in the LSC. The activity of each vial was calculated by
the LSC and the average activity of the 6 vials was used to calculate
remaining flasks. Since the activities of the flasks were all measured
at the same time before the first burn with 35s sulfate, the decay was
accounted for in each remaining burn with 35s sulfate. A 1 ml
pipette was used to transfer the 35s sulfate to 100 of the 800
scintillation vials incinerated in each of the six burns.
3^S Mgthionmg Usgd for Tgst Burns
The 35s methionine used in this study was recycled from a lab
at NIEHS. Ten 100 |il aliquots of 35s methionine were pipetted into 7
ml scintillation vials and counted via the LSC. The average activity,
calculated by the LSC in units of dpm/ml, was used as the activity of
the 35s methionine. The activity of the 35s was corrected for decay
before each burn. A 1 ml pipette was used to transfer the 35s
methionine into 80 - 120 scintillation vials for each of the six burns.
Overview of Burns
Each test burn was similar to normal burns at NIEHS except
that the materials incinerated during the spiked test burns contained
a known amount of 35s and no other known radioactivity. Because
the activity in the wastes before a burn and the activity of the ash
after the burn were known, a determination could be made of the
retention efficiency of the 35s in the ash.
A total of 18 trial burns were performed for this study. The
decision to perform only 18 burns was limited primarily by time
restrictions on the use of the incinerator since it was usually only
available for tests burns once a week. Because the incinerator was
used for this study, six control burns were designed into the schedule
to monitor the background from residual 35s, I'^C and 3h.
Control burns were the same as the spiked burns except that
no 35s was added to the wastes before incineration. The mean
activity of the 6 control burns was subtracted from the activity of
each spiked burn to reduce the affects of residual 35s, l^C, and 3h
from previous spiked burns and normal NIEHS burns on the
calculation of retention.
Breakdown of the 18 Burns
3 control burns with glass vials 3 control burns without glass vials
3 burns with glass, with 35s sulfate 3 burns without glass, with 35s sulfate
3 burns with glass, with 35s methionine
3 burns without glass, with 35s methionine
Burn Sequence 1- control burn with glass
2- burn without glass, with 35s methionine
3- burn with glass, with 35s methionine4- control burn without glass
5- burn without glass, with 35s sulfate 6- burn with glass, with 35s sulfate
7-control burn with glass
8- burn with glass, with 35s methionine
9- burn without glass, with 35s methionine
10- control burn without glass
11- burn without glass, with 35s sulfate
12- burn with glass, with 35s sulfate
13-control burn with glass
14- burn with glass, with 35s methionine
15- burn without glass, with 35s methionine
16-control burn without glass
#
17- burn without glass, with 35s sulfate 18- burn with glass, with 35s sulfate
Sampling Methods
Description of Ash
The ash contains products of combustion and uncombusted
material. Ash from burns in which no glass was incinerated
consisted of a mixture of powdery ash and bone fragments. This
type of ash was easily swept out of the incinerator. The burns in
which glass vials were incinerated yielded ash that contained bone fragments, pow.dery ash and various size chunks of molten glass and bone. Most of the glass vials were melted beyond recognition and had combined together into large chunks. However, the shape of some of the glass vials was not distorted. A flat-headed shovel had to be used to remove some of the glass chunks which had adhered to
the refractory surface.
Three ash sampling methods were tested and compared in this
project. The first two methods involve measuring the activity in the
ash by measuring the ash itself. The third method utilizes EPA's
Extraction Procedure (EP) and Toxicity Test Method 1310.
Rough Ash Sampling
After the ash from the incinerator was collected in a stainless
steel bucket, a 100 ml beaker was used to collect several samples
from different parts of the bucket. This was done in an attempt to
ash in the bucket. These samples were mixed together to form a
sample totalling about 500g. The rough ash is that which is taken directly from the incinerator in an unprocessed form. Since NIEHS
presently measures the ash in this form, it was evaluated in this
study for consistency between samples and its consistency with the
other methods.
Ground Ash Sampling
Using the same procedure for collecting ash from the bucket,
approximately 500g of ash was placed in a jar mill grinder (Model
753RM, US Stoneware, Pahwah, NJ) and ground for one to three hours. The majority of the ash obtained from the jar mill after this
grinding process was in a fine powder form. When the ash samples contained glass, some of the larger chunks of glass were not
completely ground. All ash from the jar mill was sifted through a
1/16 inch screen to remove large particles.
Extract Fluid Sampling
The 24 hour extraction procedure (EPA method 1310) was
designed to simulate the leaching conditions of a sanitary landfill for
a period of 3 to 10 years (Kimmell, 1986). The procedure, given in
Appendix A, was designed to remove several chemicals and metals from incinerator ash. During the extraction procedure, lOOg of ash is
added to distilled water and acetic acid and mixed for 24 hours. The
objective is to remove the chemicals or metals from the ash into the
water and acetic acid mixture (extract fluid) for quantification. In
#
remove 35s from the ash and into the extract fluid. Since the extractfluid was clear, it would result in much less quenching which would
require less extrapolation by the liquid scintillation counter (LSC) for
determination of activity. Also, because the fluid would not be
expected to settle-out, as is the case with particulate ash, no settling
problems would need to be remedied.
Liquid Scintillation Counting
Theory of Operation
In liquid scintillation counting the sample is placed in the liquid scintillation fluid contained in a vial. For ideal conditions, this results in 4tt counting geometry and very little sample self
absorption. The vials are automatically moved to a light tight
enclosure between two photomultiplier tubes (Knoll, 1979). The low
energy beta particles from the sample excite the fluor which is part
of the liquid scintillation fluid. The fluor emits de-excitation energy
in the form of light photons (UTP, 1982). As the photons leave the
vial, they are detected by the two photomultiplier tubes (PMT) which
measure the light photons in coincidence. Therefore, electronic noise
pulses and background radiation, which occur randomly, would not
be counted as a pulse. Because most betas have enough energy to
produce more than one photon during an interaction with the fluor, it
is likely that both PMT's will simultaneously receive light photons
from one beta interaction (UTP, 1982). Only 2 photons reaching the
PMT's simultaneously (in coincidence) will be registered as a pulse
reach the PMT's in coincidence, it is assumed that only photons counted in coincidence represent a beta particle from the source.
However, several problems arise when counting ash samples
using a LSC. The ash, for the most part, is not soluble even after being shaken vigorously. Immediately after shaking, the ash begins to settle to the bottom of the vial. The amount of settling-out on the bottom of the vial increases with time, causing self absorption of the betas and reducing the count rate measured by the LSC compared to
the actual activity of the source in the vial measured. The quotient
of the count rate (cpm), measured by the LSC, divided by the activity
(dpm) of the sample is known as the counting efficiency. Because the
ash is continually settling, the first vial, in a series of vials with equal
quantities of ash and activity, would be expected to have a much
higher count rate than the last vial.
Problems with Quench
A problem inherent in the LSC process is referred to as quench. It results when a sample introduced into the scintillation fluid
reduces the amount of light reaching the PM tubes (FCnoU, 1979).
Different materials cause different amounts of quench. High
quenching materials absorb a large amount of the light scintillations,
resulting in an underestimation of the activity of the sample by the
LSC. The amount of quench is measured by the LSC and is called the
index of the external standard (SIE). The LSC measures the SIE by
placing a I37cs pellet near the vial before counting. The high energy
photons from the I37(;;s pellet interact with the scintillation fluid via
m
physically the same as beta particles and therefore cause theemission of light scintillations through de-excitation of the fluor. The
scintillations are summed to produce an energy spectrum. The LSC
compares the energy spectrum of the scintillations produced with no
quenching present to the energy spectrum of the scintillations produced from the test sample. If quenching is present, the
spectrum will be shifted toward the lower energies because more
light is being absorbed by the sample and less light is reaching the
PMT. The higher the amount of quench, the more the spectrum will shift toward the lower energies (UTP, 1982).
Quench Curves and Standards
The LSC uses the SIE (quench) and the efficiency to produce a
quench curve. The efficiency was calculated by using eight vials,
each filled with 0.06iiCi (lOOuD of 35s standard solution. Increasing
amounts of ground ash from control burn 1, used as the quenching
agent, were added to 7 of the vials in increments of O.lg ranging
from O.lg to 0.7g. No ash was added to the remaining vial so that it
could be used as a reference point. With the activity of the 35s
samples manually programed into the machine, the LSC generated a
quench curve by plotting efficiency versus SIE (shown in Figure 2).
The LSC calculated the counting efficiency by dividing the count rate
(cpm) of each vial by the activity (dpm) of the 35$ added. The
quench curve was stored in the memory of the LSC as a specific
program. The activities of the ash samples were computed by using
Figure 2
Quench Curve for Ground Ash
>« u c
UJ
100
80
-
60-
40-
20-400
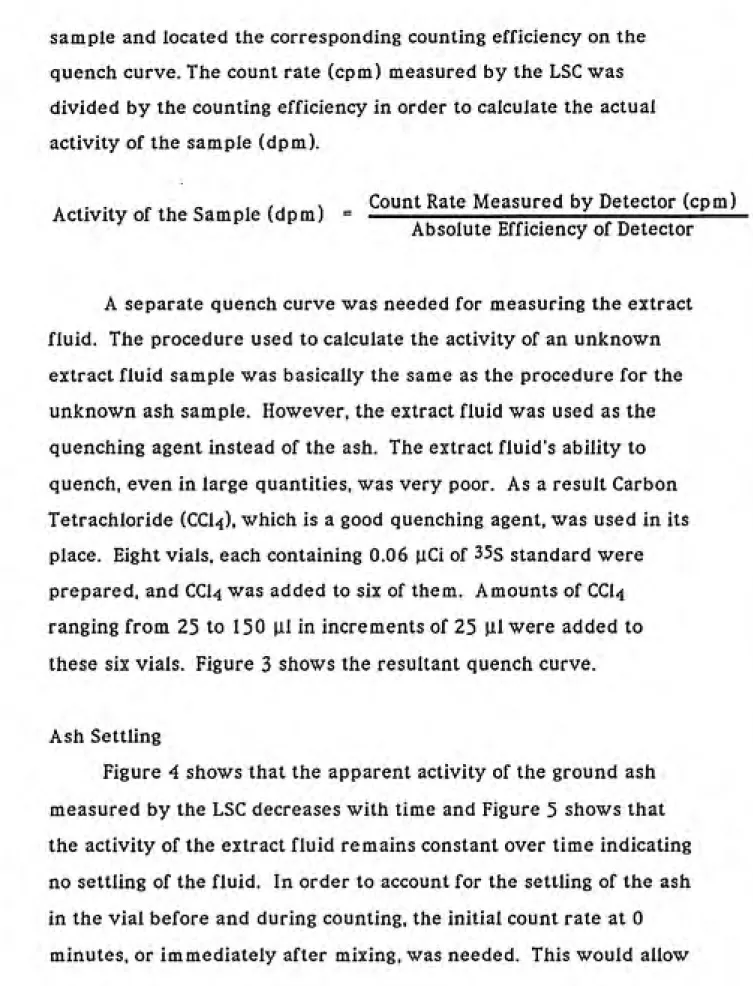
sample and located the corresponding counting efficiency on the quench curve. The count rate (cpm) measured by the LSC was
divided by the counting efficiency in order to calculate the actual
activity of the sample (dpm).
^ , ^ , ,, , Count Rate Measured by Detector (cpm) Activity of the Sample (dpm) =
-%
Absolute Efficiency of Detector
A separate quench curve was needed for measuring the extract fluid. The procedure used to calculate the activity of an unknown
extract fluid sample was basically the same as the procedure for the
unknown ash sample. However, the extract fluid was used as the quenching agent instead of the ash. The extract fluid's ability to quench, even in large quantities, was very poor. As a result Carbon Tetrachloride (CCI4), which is a good quenching agent, was used in its place. Eight vials, each containing 0.06 )iCi of 35s standard were prepared, and CCI4 was added to six of them. Amounts of CCI4
ranging from 25 to 150 |il in increments of 25 |il were added to these six vials. Figure 3 shows the resultant quench curve.
Ash Settling
Figure 4 shows that the apparent activity of the ground ash measured by the LSC decreases with time and Figure 5 shows that
the activity of the extract fluid remains constant over time indicating no settling of the fluid. In order to account for the settling of the ash in the vial before and during counting, the initial count rate at 0
>« o e
•
tit
Figure 3
Quench Curve for Extraction Fluid
and Carbon Tetrachloride
100
500 600 700
#
2000
Figure 4
Settling Pattern of Ash over Time Using Ash from Burn 3
1500
m
<
o
a
Q
1000-
500-100
Time Elapsed Since Mixing (In Minutes)
^
Figure 5
ͣͣ
2''
•IP*
I
K
lU
i
a.
a
Settling Pattern for Extraction Fluid
from Burn 3
<:uuu
-
15001000
-
50
0-«
•*• •. • * .*•••
—1---' 1---'---1---ͣ>---1
the best estimation of the actual activity of the ash. To estimate the
initial count rate, six scintillation vials, each containing 0.2g of ash
from the same burn, were shaken using a Vortex-Genie and loaded
into the LSC to be counted immediately. After the 6 vials were
counted they were again shaken, but this time there was a 5 minute
interval between mixing and the initiation of the counting process of
the LSC. This procedure was continued several more times with the
time interval between mixing and count initiation increasing each
time. The time interval between mixing and count initiation was
added to the amount of time elapsed from count initiation until the
LSC counted the vial (which is given on the LSC printout). By using
this method, a count rate was known for each 2-3 minute time
interval from 0 minutes up to 100 minutes. Normally, a total of 30
-40 data points were obtained.
The plots of count rate versus time made from this data
showed the trends in the count rate of the ash and extract fluid over
time. It was thought if the settling trends were similar between ash
samples, then a general equation could be used to describe the
trends. And if the settling trends could be described with an equation, then the count rate could be "corrected", using the
equation, for the effects of time on the count rate. Therefore, the
count rate for all the vials would appear as if they were measured at
0 minutes. This procedure was used for ash samples from burns 2, 3,
5, 6, 11, 12, 17 & 18 in order to try to model the general settling
patterns of the ash to be used for all the ash samples.
A Cricket Graph graphics program (Cricket Software, Malvern,
curve, for each ash sample, was different. Therefore, a general
equation would not adequately correct for the effects of time in all ash samples. It was subjectively determined through trial and error that the data from the burns were best fit with a logarithmic curve.
Exponential, polynomial, and simple curves were also tried, using the graphics program. Once the settling curve was generated by the
program, it was extrapolated to 0 minutes to find the initial count rate immediately after mixing. The activity of the ash was calculated
from this count rate for each vial. This method of accounting for the
settling-out of the ash was applied to all 18 burns.
For burns 1, 4, 7, 8, 9, 10, 13, 14, 15. & 16, ten vials, each
containing 0.2g of ash from each burn, were counted resulting in 10
data points. The more in depth settling curves, previously
mentioned, were not empirically determined for these ash samples
because of the length of time involved in obtaining the extra data
points. The 10 data points obtained for each ash sample were fit
with a logarithmic curve using the Cricket Graph program. The
activity of each ash sample was taken to be the activity extrapolated
to time 0 on the curve.
Measurement of Rough Ash with the Liquid Scintillation Counter
A small spatula was used to transfer ash from a 100 ml beaker
to the scintillation vials. To remain consistent with the procedure at
NIEHS, an attempt was made to sample only the smallest particles of
ash. The larger particles did not mix well and self-absorption within
the particle would cause an underestimation of the activity. Because
beaker, samples were taken from that area. In each vial 0.2g of ash were placed along with approximately 7 ml of scintillation fluid.
Measurement of Ground Ash with the Liquid Scintillation Counter
Five 7 ml polyethylene scintillation vials were filled with ash in increments of O.lg starting with O.lg and finishing with 0.5g. A
Mettler balance (Model P-1200, E.H. Sergant and Co.) was used for
weighing the samples. Figure 6 shows that the quench increases (SIE
decreases) as the quantity of ash increases, and that 0.2g of ash
resulted in the highest count rate. A higher count rate (cpm) would
require less extrapolation for estimation of the sample activity (dpm)
by the LSC. Similarly, a low amount of quench would also require less extrapolation by the LSC for determination of the sample
activity. Therefore, an ash sample weight was desired that had a
high count rate but not a large amount of quench relative to the
other ash weights. Based on these two stipulations, a subjective decision was made to use 0.2g of ash as the sample weight of ash to
be measured in the LSC.
Measurement of Extract Fluid with the Liquid Scintillation Counter To measure the activity of the samples of extract fluid from each burn, ten 7 ml vials were each filled with 1 ml extract fluid.
The remaining portion of the 7 ml vials were filled with liquid
%
Q.
o
Figure 6
SIE and CPM for Several Ash Quantities
2000 -I---r 400
1900
18001700
1600
-1500
1400
300
UJ
200
100
-Q--- cpm
ͣ
^--- SIE
Grams of Ash
#
Windowless Gas Flow Proportional CounterTheory of Operation
In an effort to validate the data collected with the LSC, an
alternate beta counting technique was used to measure the activity
in the samples. A 2tt windowless gas flow proportional counter (PC)
was used for this alternative counting technique.
The PC is well suited for measuring the low energy betas from
35s. Since the sample is placed in the active volume of the detector,
problems with beta particles being stopped or losing energy from window absorption are eliminated. This allows maximum efficiency to be achieved. However, the efficiency of the PC is limited to about 50% by its 2tt geometry configuration (Knoll, 1979).
Beta particles emitted from a source result in the formation of
ion pairs through ionization in the active volume of the detector.
Since each ion is charged, it will be attracted, by coulombic forces, to
any particle with an opposite charge and repelled from a particle with a similar charge. Voltage is applied to the anode causing it to
become positively charged. The walls of the detector, therefore,
become negatively charged. The negatively charged electrons are
swept toward the anode, and the positively charged ions are swept toward the wall of the detector. As the electrons are moving toward the anode, they collide with the neutral gas molecules causing more ion pairs to be formed. These secondary collisions spread in a
cascading fashion toward the anode until all the electrons are
collected, resulting in a pulse. A high voltage is needed to increase
Figure 7
Plateau Curve for 35S Ash Standard
0.
o
1400-
/
ͣ
^^ /
1200 -
/^^
1000800
-y*
600-/
y
400
-4
/
200-0- ---1---11---•--—r— -1----1 • 1
1600 1800 2000 2200 2400 2600
The operating voltage for this study was set near the middle of the
plateau at 2350 volts.
35s Extract Fluid Standard for the Proportional Counter
A 35$ standard solution was made by pipetting 0.07 iiCi of 35s
standard into a 20 ml volumetric flask. A 20 ml aliquot of distilled
water measured in a 25 ml graduated cylinder was added to the
flask making the concentration 0.0035 |iCi/ml. After sealing the
flask with a glass stopper, the contents were mixed by inverting the
flask several times. Five 0.5 ml aliquot were counted with a LSC.
The activity of the 35s standard solution was calculated to be 7568
dpm/ml. This activity was checked by counting five 0.5 ml aliquots,
from the flask, using the LSC. The mean activity was 7579 dpm/ml
(7492. 7372, 7594, 7890 and 7548 dpm/ml). Using a 0.5 ml pipette,
an aliquot of the standard solution was pipetted onto each aluminum
planchette (Nuclear Chicago. Inc.) in increments of 0.5 ml starting
with 0.5 ml and ending with 2.5 ml. The planchettes were heated on
a hot plate until the fluid had evaporated. Each planchette was
counted for 10 minutes using the PC. Figure 8 shows the linear
relationship between the ml of standard added and the activity of
the standard measured. This means the quantity of fluid counted
doesn't affect the count rate of the sample. In order to test for the
possibility of 35s being lost through evaporation, a piece of 4.25 cm
Whatman filter paper (Whatman International Ltd., Maidstone.
Figure 8
Relationship between the Activity Measured
and the Amount of S35 Standard Added
20000
15000
i
10000-5000
paper was placed in a scintillation vial and counted with a LSC. No activity above background was detected.
Measurement of Extract Fluid with the Proportional Counter Extraction fluid samples were pipetted onto aluminum
planchettes. A 0.5 ml pipette was used to transfer a 2 ml aliquot of
extraction fluid to each planchette. The planchettes were heated on a
hot plate to decrease evaporation time. After complete evaporation
of the extract fluid, each planchette was counted for 15 minutes.
Appendix E shows the method used for calculating the activity per
gram of ash from the counts per ml of extract fluid.
Ash Sample Size for Proportional Counter
In order to make a decision on the amount of ash that was to
be put in the planchettes for counting, two main problems were
confronted:
1- Self absorption of low energy betas by the ash.
2- Limited accuracy in measuring small amounts of ash.
The problem with self absorption of low energy beta particles can be
substantial. In order to measure the amount of self-absorption for
the several ash weights, the thickness of the ash at each weight was
needed. The first step in determining the thickness of the ash at a
specified weight was to calculate the density of the ash. To do this, a 25 ml graduated cylinder was filled to the 25 ml mark with ash and weighed. The weight of the empty graduated cylinder was
f
#
#
ash to determine the weight of the ash. The following method was
used to calculate the thickness of the ash:
Density
grams of ash _ 9
25 ml of ash ml
,, , weight of ash (g)
Volume =--- = ml density of ash (g/ml)
volume (ml)
Height = --- = thickness of the ash in cm
n r^
grams of ash thickness of ash (cm)
0.1 0.003
0.2 0.006
0.3 0.009
0.4 0.012
0.5 0.015
The average ash density calculated in this study was 1.1 g/ml.
The average range of beta particles emitted from 35s in ash of this
density is 0.0033 cm (USDHEW, 1970). Shown in the table above are
the five ash weights tested and their calculated thicknesses. As the
ash weight increases, the amount of self-absorption also increases
because the ash sample is thicker and absorbs more betas before
they reach the detector. The lowest weight was set at 0.1 g because
f
#
#
highest weight was set at 0.5g because at this amount of ash the
count rate becomes very low, indicating much self-absorption of the
betas (Figure 9) which results in low detector efficiency (Figure 10).
A final decision to use O.lg of ash as the sample size was made
because of the high detection efficiency at this weight resulting from
the least amount of sample self-absorption (see Figure 10). It was
thought that the possible errors in measuring O.lg of ash would
cause less error in the calculation of activity than the low efficiencies
associated with measuring the higher quantities of ash. Figures 9
and 10 also show the count rate and efficiency of the standard
solution (O.Og of ash). This represents the maximum efficiency and
count rate possible because there is no self-absorption from the ash.
The efficiency at O.Og also indicates the efficiency for the extract
fluid.
For sampling counting a 0.5 ml aliquot of distilled water was
added to each ash sample in the planchette to facilitate the spreading
of the ash into a smooth layer on the planchette. The ash was spread
evenly over the planchette using a small spatula. Because of possible
beta absorption by the water, the samples were gently heated on a
hot plate for 15 minutes until the water was evaporated.
Measurement of Ash with the Proportional Counter
Ground ash samples from each burn were measured into 3
planchettes in aliquots of O.lg. A 0.5 ml pipette was used to add 0.5
ml of distilled water on each planchette. This was done to ensure
that the ash was in a uniform layer in the planchette. The
9
Figure 9
Count Rate vs. Ash Weight for Ash
with Standard Added
2000
CL
a
1800-
1600-
1400-
1200-
1000-
800-600 ---1---1---1---1---1---1---1---1---1 I---r—
0.0 0.1 0.2 0.3 0.4 0.5 0.6
Grams of Ash
#
u c
•
3
o
Figure 10
Absolute Efficiency vs. Weight for Ash
with Standard Added 0.5
0.4-0.3
0.2
0.1
3784 dpm of standard was added to each planchet
—'---1---"---1---'---1---'---1—
0.0 0.1 0.2 0.3 0.4
Grams of Ash
—I---'—
0.5 0.6
f
completely evaporated and then counted for 15 minutes.Appendix D contains the equations used for calculating the sample
activity and accounting for decay.#
f
#
#
RESULTS
Statistical Analysis of the Data
Statistical procedures were performed on the data using Systat
and Mystat statistical programs (Systat Inc., Evanston, ID for the
personal computer. The mean, standard deviation, Students t-test
statistic, and analysis of variance were calculated for the 35s ash
retention efficiencies.
A Students t-test was used to compare the percentage of
radioactivity extracted from ash with glass to ash without glass
during the extraction procedure. The Students t-test compares the
means of two sample populations. Based on the t statistic a decision
can be made, depending on the confidence level, on the significance
of differences in the means.
An analysis of variance (ANOVA) was made on four groups of
data to test for significant variation between the group means
compared to among the groups (Remington and Schork, 1985). In
Table 1, the results of the analysis of variance are listed for the four
groups of data which are as follows:
-glass vs. no glass
-sulfate vs. methionine
-proportional counter vs. liquid scintillation counter
-ash vs. extract fluid
Problems Encountered in Rough Ash Measurement
There are several sources of bias associated with measuring
Table 1
Analysis of Variance
Variance within Sample Groups
Source p-value
Type of Vial 0.012
Chemical Form <0.001 Sampling Method 0.444
Type of Detector 0.669
Variance between Sample Groups
Source p-value
Type of Vial vs.
Samping Method 0.917
Type of Vial vs.
Chemical Form 0.018
Type of Vial vs.
Type of Detector 0.803
Chemical Form vs.
Sampling Method 0.511
Chemical Form vs.
Type of Detector 0.776
Sampling Method vs.
#
ash is supposed to sample only the smallest ash particles. This
sample would not be representative of the entire sample because not
all of the ash would be sampled. Second, the ash particle size
between samples may vary greatly between samples depending on
the person measuring the ash samples. Samples with different
particle sizes have different settling rates and would therefore have
different count rates. Third, most of the particles sampled are large
enough that they settle out to the bottom of the vial immediately
after mixing. As a result, the count rates for rough ash samples are
consistently much lower than count rates of ground ash. The
calculated dpm for ground ash are frequently more than twice those
of the rough ash from the same burn (see Figure 11). It was
therefore decided to persue no further study of the rough ash and to
eliminate its use in determination of retention efficiency.
Mass Reduction Efficiencv of the Incinerator
The mass reduction indicates the extent to which the wastes
incinerated are combusted. The mass reduction efficiency (MRE) for
the wastes for the 18 burns was calculated using the following
equation:
Mass of ash after incineration
|v|p^ = I _ --- X 100
Mass of wastes incinerated
In Figure 12, the mass reduction efficiencies are shown for each
Figure 11
Comparison of Rough Ash and Ground Ash
Using Ash from Burn 17
16000 -I---z---r 16000
-14000
-12000
-10000
-8000
-6000
-4000
14000
12000
10000
2000 0 2 4 6 8 10 12
Time Elapsed Since Mixing (in Minutes)
Figure 12
Mass Reduction of Incinerated Wastes
c
o
u 3
•D
«>
CC
contains glass
92.5-90.0
12 3 4 5 6 7 8 9 10 1112 13 14 15 16 17 18
#
#
glass was incinerated consistently had lower MRE's with a mean of
92.4% compared to 96.5% for the 9 burns containing no glass vials
(see Table 2). An ANOVA table computed on the MRE data showed
that this difference is statistically significant (p<0.0001).
Since polyethylene is organic, it is combusted and released as a
gaseous effluent. The glass is not an organic and is not combusted,
and since temperatures in the incinerator never reach the boiling
point of glass, it would be expected to remain in the residual ash.
The extra weight from the glass is probably responsible for the lower
MRE's for the burns with glass.
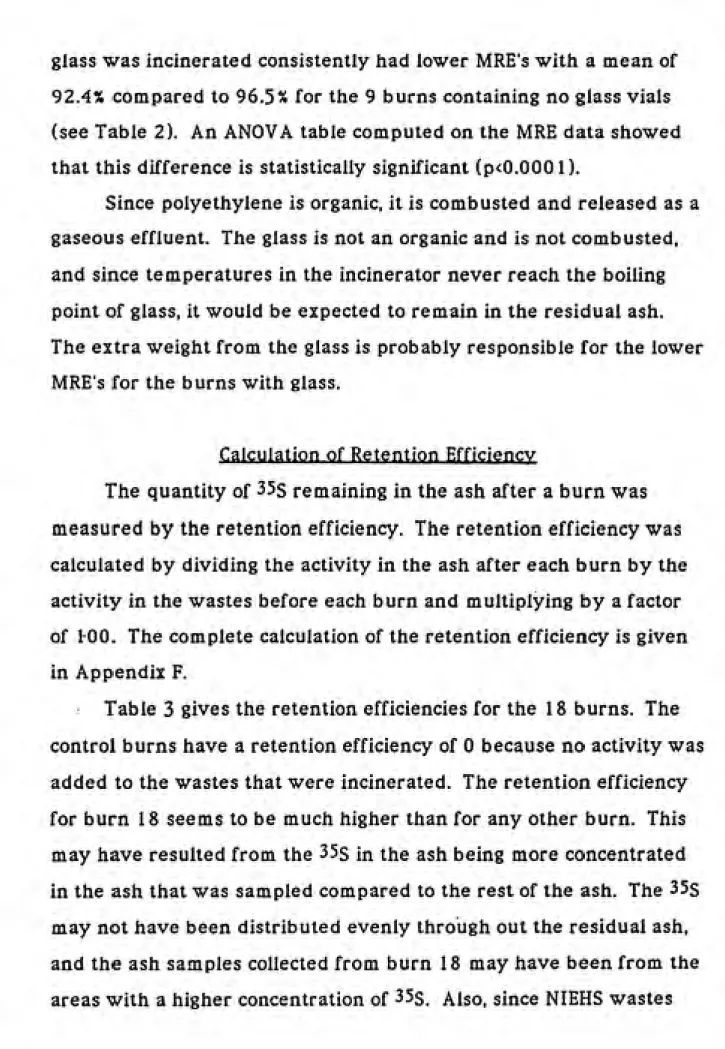
Calculation of Retention Efficiencv
The quantity of 35$ remaining in the ash after a burn was
measured by the retention efficiency. The retention efficiency was
calculated by dividing the activity in the ash after each burn by the
activity in the wastes before each burn and multiplying by a factor
of 100. The complete calculation of the retention efficiency is given
in Appendix F.
Table 3 gives the retention efficiencies for the 18 burns. The
control burns have a retention efficiency of 0 because no activity was
added to the wastes that were incinerated. The retention efficiency
for burn 18 seems to be much higher than for any other burn. This
may have resulted from the 35s in the ash being more concentrated
in the ash that was sampled compared to the rest of the ash. The 35s
may not have been distributed evenly through out the residual ash,
and the ash samples collected from burn 18 may have been from the
#
Table 2Mass Reduction of Incinerated Wastes
#
Burn #
kg of wastes
incinerated
kg of residual
ash
Mass reduction efficiency (%)
1 * 69.3 5.20
92.5 1
2- 71.1 3.64 97.7
3* 72.9 5.10 93.0
4- 72.5 2.84 96.1
5- 72.0 2.57 96.5
6* 72.9 5.36 92.7
7* 71.6 6.30 91.3
8* 67.5 5.80 91.5
9- 73.0 2.72 96.3
10- 68.0 2.23 96.8
11- 71.5 2.70 96.2
12* 73.8 4.80 93.5
13* 70.6 4.90 93.1
14* 68.4 5.71 91.7
15- 68.4 2.04 97.0
16- 68.0 2.99 95.6
17- 68.8 2.26 96.8
1 18* 68.8 5.44
92.1 1
contains glass
Table 3
Retention Efficiencies for Ash and Extract Fluid
Proportional Counter Liquid Scintillation Counter
Burn #
ancJ Code Ash% Extract fluid
Burn #
and Code Ash% Extract fluid %
1 CG 0.00 0.00 1 CG 0.00 0.00
2 M 1.90 1.63 2 M 1.16 2.05
3 MG 2.25 1.14 3 MG 2.70 1.84
4 C 0.00 0.00 4 C 0.00 0.00 Codes
5 S 4.92 2.77 5 S 3.22 5.78
6 SG 9.32 5.01 6 SG 8.16 11.66 C: Control Burn
7 CG 0.00 0.00 7 CG 0.00 0.00 M: Methionine
8 iVIG 2.18 1.88 8 MG 2.10 2.99 S: Sulfate
9 M 2.01 2.18 9 M 1.54 2.90 G: Glass
10 C 0.00 0.00 10 C 0.00 0.00
11 S 7.89 6.32 11 S 3.02 11.95
12 SG 11.14 6.38 12 SG 5.27 12.20
13 CG 0.00 0.00 13 CG 0.00 0.00
14 MG 0.50 0.44 14 MG 0.18 1.25
15 M 0.28 0.28 15 M 0.21 0.27
16 C 0.00 0.00 16 C 0.00 0.00
17 S 8.76 5.47 17 S 4.60 11.04
18 SG 29.64 21.70 18 SG 16.33 40.10
45^
w^ere burned on days w^hen test burns Tvere not being performed,
residual 35s, I'^C or 3h from the NIEHS wastes may have been in the
ash in large amounts. If this was the case, inadequate cleaning before burn 18 may not have removed all the ash from the refractory and it may have combined with the ash from burn 18 resulting in a seemingly much higher retention efficiency.
Effects of Chemical Form on Retention Efficiencv
The 6 burns with 35s sulfate yielded a higher mean retention efficiency than the mean of the 6 burns with 35s methionine. As
listed in Table 1, the p value of 0.00001 indicates that there is a statistically significant difference in the retention efficiencies between the two chemical forms of 35s. In Table 4 the retention
efficiencies are broken down by chemical form, detector type,
sampling method and the presence of glass. The sulfate form of 35s
has a much higher retention efficiency in all categories. Table 5 also
shows the mean retention efficiencies. The overall mean retention
efficiency was 10.54% for sulfate and 1.51% for methionine.
Included in the calculation of these efficiencies were the efficiencies
calculated with both detectors and efficiencies determined by measuring ground ash and extract fluid. A total of four mean
retention efficiency values (Appendix G) were averaged together to
produce the overall mean retention efficiency for each chemical form
of 35s. If burn 18 were eliminated, the mean retention efficiency for
the 4 remaining burns containing 35s sulfate would be 7.35%
#
0
Table 4
Effects of Chemical Form and Glass
on Retention Efficiencies
Ash Extract Fluid
£Q J^Q E£ LSQ
Sulfate
Glass 16.70 9.95 11.03 21.3(
No glass 7.19 3.61 4.80 9.62
Methionine
Glass 1.65 1.64 1.15 2.12
#
Table 5
Effects of Chemical Form on Retention Efficiencies
Ash Extract Fluid
Sulfate 11.95 6.78 7.94 15.50
Methionine 1.52 1.30 1.26 1.94
Mean retention efficiency using sulfate: 10.54%
Mean retention efficiency using methionine: 1.51%
#
During incineration, sulfate decomposes to SO2, and the
methionine decomposes to SO2 and NOj which are eliminated as gases
out the stack. Methionine, being an organic compound, could be
combusted to form H2O and CO2 along with SO2 and NOj and vented
up the stack. Sulfate is an inorganic compound and would not be
combusted to H2O and CO2, which may explain why more of the
sulfate is retained in the ash. The difference between the retention
efficiencies of sulfate and methionine may be due to the extent to
which they are converted to these gases and other combustion
products. Even though there are significant differences between the
mean retention efficiencies of the sulfate and methionine from of 35s,
it should be noted that the standard deviations are very large.
Effects of Glass on Retention Efficiencv
The ash and extract fluid from the burns with glass have
consistently higher retention efficiencies than the burns without
glass. Statistical data on the retention efficiencies are listed in
Table 6. The mean retention efficiency for ash with glass is 8.22%
and for ash without glass is 3.84%. There was a statistically
significant difference (p=0.012) between retention efficiencies from
burns with glass vials and burns without glass vials. Table 4 shows
the differences between burns with glass and without glass for both
chemical forms of 35s. An analysis of variance (Table 1) resulted in a
p value of 0.018, indicating that the presence of glass and the
chemical form of 35s have a statistically significant affect upon each
#
Table 6
Effects of Glass on Retention Efficiencies
Ash Extract Fluid
EQ LSQ PC LSC
Glass 9.23 5.80 6.09 11.75
Without Glass 4.29 2.28 3.11 5.69
Mean retention efficiency for burns with glass: 8.22%
«b
Comparison of Sampling Methods
The measurement of ash and extract fluid with the PC consistently resulted in higher retention efficiencies for the ash samples (Figure 13). In contrast, the measurement of ash and extract fluid with the LSC resulted in consistently higher retention efficiencies for the extract fluid samples (Figure 14). The mean retention efficiency using both detectors for ash was 5.39% and the
extract fluid was 6.66%. The analysis of variance in Table 1 shows
that there is no significant difference between the two sampling
methods. The reason that no statistically significant difference was
found between retention in ash and extract fluid may be due to the
large standard deviations (Appendix G) and may also be caused by
using the mean retention efficiency of both detectors combined. The
data in Table 1 indicate that the sampling method and the type of
detector have a statistically significant effect (p=0.046) upon each
other. This is probably because both sampling methods were not
averaged together to calculate the mean for each detector as was
previously done.
Determination of Extraction Procedure Efficiencv
In order to compare the activity of the extract fluid (dpm/ml)
to the activity of the ash (dpm/g) the activity of the extract fluid was
converted into units of dpm/g of ash (see Appendix E).
One extraction was performed on each of the 18 burns to
determine the activity of the ash from that burn (see Appendix H).
#
u e UJ c o c 4> 45 40- 35- 30-25 20- 15- 10- 5-Figure 13Retention Efficiency Measured by
Proportional Counter
5
ͣ
" Li "
ͣ
^.1.. MM. HI
M
I - l^^S^^n—"T"
12 3 4 5 6 7 8 9 10 1112 13 14 15 16 17 18
GG GGG GGG G
Burn *
Ash
Extract Fluid
M. Methionine
5: Sulfate
#
ui c o
on
Figure 14
Retention Efficiency Measured by
Liquid Scintillation Counter
B^
1 23456789 10
G G G G G
Burn ͣ
12 13 14 15 16 17 18
G G G G
ͣ
Ash
B Extract Fluid
M: Methionine
S: Sulfate
determined. This was done by performing consecutive extractions on
the same ash sample. Ash from burns 12, 13, 17 and 18 was used
for these additional extractions.
The extraction procedure, listed in Appendix A, was used for
each extraction. After each 24 hour mixing period, the ash was
allowed to settle for about 20 minutes. The extract fluid was
siphoned off the top by applying suction through a narrow glass
tube. The leftover ash slurry was filtered through Watman paper so
that only the ash remained. This ash was reused for the next
extraction. Samples of the extract fluid and ash were collected and
counted after each extraction. Only Ig of ash was collected after each
extraction so not to greatly affect the remaining extractions.
The column titled "net activity of ash" in Table 7 shows the
activity removed during several extractions on the same ash sample.
The initial activity of the ash is listed as extraction #0 for each burn.
The activity of the ash after each extraction is also given. It appears
in burns 11 and 12 that there is approximately the same amount of
activity remaining in the ash after each extraction. Therefore, the
mean activity measured in the ash, after each extraction, represents
the amount of activity that could not be removed from the ash by
the extractions. The mean background activity was calculated from
four extractions on ash from control burn 10. All activities were
determined using the liquid scintillation counter.