ABSTRACT
Environmental inorganic arsenic (iAs) exposure is a major health concern globally. iAs is found in high concentrations in well water, rice products, and other foods. Epidemiological evidence has linked iAs exposure to an increased prevalence and incidence of the diabetic phenotypes, and studies using mouse models have shown that iAs exposure leads to impaired glucose homeostasis, suggesting iAs is a diabetogen. However, the molecular mechanism by which iAs exposure causes diabetes is not well understood. This project focuses on identifying molecular mechanisms by which iAs exposure increases the risk of diabetes. We hypothesize that exposure to iAs or its metabolites disrupts hepatic insulin signaling and impairs the
pathways of glycogen metabolism in the liver. Our results demonstrate that exposure to arsenite and methylarsonite, a methylated metabolite of iAs, lead to inhibition of glycogen synthase and activation of glycogen phosphorylase, and reduces glycogen content in primary murine
ACKNOWLEDGEMENTS
I would like to thank Dr. Melinda Beck for inspiring me to pursue a BSPH in Nutrition when I took NUTR 240 in my sophomore year at UNC. I am very grateful to Dr. Miroslav Styblo for allowing me to work in his lab in the area of arsenic exposure and diabetes, as well as for investing his time in me, and providing me with guidance for conducting this project. I am indebted to Dr. Chongben Zhang for the opportunity to work on his research project, and for training me to develop and conduct experiments using primary hepatocytes. I appreciate Dr. Christelle Douillet and Dr. Nicole Dover, and all members of the Styblo lab for their collegial interactions and help over the last two years.
I would like to acknowledge Dr. Rosalind Coleman for her review of my honors thesis, and each member of the UNC faculty who taught and inspired me in the area of nutrition research over the past four years. And to my family and friends, I am blessed to have had your unwavering support throughout my undergraduate career.
TABLE OF CONTENTS
LIST OF FIGURES………vi!
LIST OF ABBREVIATIONS………...vii
CHAPTER 1: INTRODUCTION………1
1.1 Prevalence of arsenic exposure………..1
1.2 Arsenic as a carcinogen……….1
1.3 Diabetes and insulin resistance………..2
1.4 Arsenic-Associated Diabetes……….4
1.4.1 Epidemiological Evidence………..4
1.4.2 Mechanistic Evidence……….5
CHAPTER 2: MATERIALS AND METHODS……….6
2.1 Liver perfusion, hepatocyte isolation and culture……….……….6
2.2 Antibodies and reagents………..….………..7
2.3 Glycogen content assay………..7
2.4 Gluconeogenesis assay………...8
2.5 Glycogen Synthase activity assay………..8
2.6 Glycogen Phosphorylase activity assay……….9
2.7 Protein Phosphatase-1 activity assay………...9
2.8 Immunoblot analyses………...10
2.9 Cell viability……….10
2.10 Statistical analysis………..11
CHAPTER 3: RESULTS………...11
3.2 iAs3+ and MAs3+ exposure inhibited GS activation and GP deactivation by
Insulin………...……….…………12 3.3 iAs3+ and MAs3+ exposure increased GS phosphorylation at Ser-641………...15 3.4 iAs3+ and MAs3+ exposure inhibited phosphorylation of PKB/Akt with no significant change in GSK3α phosphorylation………16
3.5 PP1 activity was not inhibited by iAs3+ or MAs3+ exposure………...………18
CHAPTER 4: DISCUSSION……….21 4.1 Inhibition of GS activation by iAs3+ and MAs3+ is independent of the PKB/Akt and
GSK3α pathway………21
4.2 Inhibition of GS activation and GP deactivation appears to be independent of
LIST!OF!FIGURES!
Figure 1. iAs3+ and MAs3+exposure reduced glycogen content without impairing cell
viability………..12 Figure 2. iAs3+ and MAs3+exposure inhibited glycogen synthase and inhibited glycogen
phosphorylase………14 Figure 3. iAs3+ and MAs3+exposure increased glycogen synthase
phosphorylation……….…….16 Figure 4. iAs3+ and MAs3+exposure decreased PKB/Akt
phosphorylation………..17 Figure 5. iAs3+ and MAs3+exposure did not alter GSK3α phosphorylation……….18
LIST OF ABBREVIATIONS
As Arsenic
ATP Adenosine triphosphate
cAMP Cyclic adenosine monophosphate
Dex Dexamethosone
FOXO1 Forkhead box protein O-1
GP Glycogen phosphorylase
GPK Glycogen phosphorylase kinase
GS Glycogen synthase
GSK3α Glycogen synthase kinase 3α
iAs3+ Inorganic arsenic (trivalent)
Ins Insulin
IR Insulin resistance
MAs3+ Methylarsonite (trivalent)
mTORC2 Mammalian target of rapamycin complex 2 PDK1 3-phosphoinositidedependent protein kinase-1
PI3K Phosphoinositide 3-kinase
PKA Protein kinase A
PKB/Akt Protein kinase B/Akt
CHAPTER 1: INTRODUCTION
1.1 Prevalence of arsenic exposure
Arsenic naturally occurs in both inorganic (iAs) and organic forms, but primarily exists as an inorganic sulfide complex of arsenate (iAs5+) or arsenite (iAs3+) (IARC, 2004). Inorganic arsenic complexes are naturally occurring in many mineral species and can be released into air, water, and soil through a variety of natural processes such as volcanic eruption and groundwater leaching, which are exacerbated by mining practices, insecticide application, and other industrial practices (Beck et al., 2017, Chung et al., 2014). Many of the iAs complexes that naturally occur are easily solubilized in water, thus groundwater has a large potential to become contaminated by iAs, making iAs exposure a global health concern (IARC, 2004). While many researchers have studied iAs exposure in cohorts from nations such as China, Mexico, and Bangladesh, at least 13 million United States residents have a drinking water source containing ≥ 10 µg/L iAs, the EPA established maximum (ATSDR, 2007). Furthermore, exposure to iAs can occur through
consumption of plants (primarily rice) grown in arsenic-rich soils or waters (Davis et al., 2017), poultry (Nachman et al., 2017, Nigra et al., 2017), and other fruits and juice products (Davis et al., 2017). Unlike iAs, organic arsenic complexes such as arsenocholine or arsenobetaine that are found in fish are typically considered to have very low toxicity because they are rapidly cleared unmetabolized from the body (Vahter et al., 1983).
1.2 Arsenic as a carcinogen
While these studies are important in understanding the health effects of iAs exposure, they do not provide an accurate depiction of what occurs in individuals exposed to concentrations of As < 100 µg/L (100 ppb). Smith and colleagues (Smith et al., 1992) described the dose-response relationships between water As concentrations and cancer risks using data from a Taiwanese cohort in which well water As levels ranged from 170-800 µg/L. Epidemiological studies
published over a 10 year period were analyzed (Gibb et al., 2011) to determine the association of cancers with drinking water As concentrations below 100 µg/L. While few of the analyzed studies found significant evidence of association at As concentrations below 100 µg/L, two of the studies demonstrated a greater risk of bladder and lung cancer in individuals that began drinking As contaminated water at an early life stage as compared to those that begin
consumption at a later life stage (Gibb et al., 2011). This finding supports the hypothesis that cumulative As exposure is most influential on As related cancer development.
1.3 Diabetes and insulin resistance
In 2014, it was estimated that 422 million people were living with diabetes globally (WHO, 2014). Of those 422 million people, approximately 29 million were living in the United States (CDC, 2014), with type 2 diabetes mellitus comprising 90-95% of cases (ADA, 2016). Diabetes is classified by fasting hyperglycemia, i.e., fasting plasma glucose (FPG)
concentrations at or above 126 mg/dL, 2-hour plasma glucose at or above 200 mg/dL following an oral glucose tolerance test, or HbA1c levels at or above 6.5% (ADA, 2016). Type 1 diabetes is caused by autoimmune destruction of pancreatic β-cells, while type 2 diabetes results from
The exact mechanism of type 2 diabetes development is not well understood, but insulin resistance (IR) is believed to be one of these mechanisms. Insulin resistance is a physiological condition in which insulin becomes less effective in lowering blood glucose. The resulting increase in blood glucose may raise insulin levels above of the normal range, which can cause adverse health effects. IR in muscle and fat cells reduces glucose uptake (therefore reducing local storage of glucose as glycogen and triglycerides, respectively), whereas insulin resistance in hepatocytes results in reduced glycogen synthesis and a failure to suppress gluconeogenesis. Many theories regarding the molecular mechanism of IR have been proposed, including over-accumulation of lipid intermediates from de novo triglyceride synthesis, inflammatory cytokines, endoplasmic reticulum stress, and mitochondrial dysfunction (Zhang et al., 2013). In IR,
suppressed insulin signaling causes over activation of forkhead box protein O-1 (FOXO1), a transcription factor of gluconeogenic enzymes glucose-6-phosphatase (G6Pase) and
phosphoenolpyruvate carboxykinase (PEPCK), leading to enchanced gluconeogenesis. Over activation of FOXO1 has been associated with elevated FPG levels in type 2 diabetics,
2011). Though multiple mechanisms may exist in the of the pathogenesis of type 2 diabetes exists, many studies suggest that hepatic insulin resistance can be caused in vivo by
dysregulation of GS, GP, and other hepatic proteins (Krssak et al., 2004, Petersen et al., 1998, Siani, 2010).
1.4 Arsenic-Associated Diabetes
1.4.1 Epidemiological evidence
While sufficient evidence on the carcinogenicity of iAs exists for individuals exposed to large quantities, less is known about how lower concentrations of iAs impact the human body. A cohort study of a general population in Taiwan has demonstrated a positive association of hair arsenic concentrations ≥ 0.034 µg/g with a 2.54 times greater odds of metabolic syndrome prevalence (Wang et al., 2007). However, As is typically more concentrated in the hair and nails than in other parts of the body due to sulfhydryl groups present in keratin, resulting in As
concentrations more representative of multiple months of exposure as opposed to current water As exposure (Maull et al., 2012). While hair arsenic is a better measure of cumulative As
exposure, it has been reported that the risk of diabetic phenotype development is associated only with current As exposure (Del Razo et al., 2010). Meta-analyses of the association of iAs
exposure and diabetic phenotype confirm that there is an increased risk of diabetes development in individuals exposed to As as compared to unexposed individuals (Maull et al., 2012, Sung et al., 2015). Furthermore, an epidemiological study examining the relationship between water As exposures and cardiometabolic risk factors in a cohort of Chihuahua, Mexico residents has shown significantly increased odds of diabetes development in individuals exposed to ≥ 25.5
between As exposure and diabetic phenotype, it is imperative that the mechanism by which As-associated diabetes occurs is determined.
1.4.2 Mechanistic evidence
While evidence suggesting an association between low dose iAs exposure and a diabetic phenotype in human cohort studies is limited, there is additional animal model and in vitro
evidence providing insight into the diabetogenic effects of iAs and its methylated metabolites. iAs is absorbed as both arsenate (iAs5+) and arsenite (iAs3+) and iAs5+ is reduced to iAs3+ in the blood by glutathione (Tseng, 2007). After transport to the liver, iAs3+ is methylated to
methylarsonate (MAs5+) and reduced to methylarsonite (MAs3+) by arsenic (+3 oxidation state) methyltransferase (AS3MT) (Drobna et al., 2009). This methylation and reduction step can be repeated to yield dimethylarsonite (DMAs3+). Animal studies, particularly in mice, point to pancreatic β-cell function and insulin resistance as primary diabetogenic endpoints of iAs
exposure (Maull et al., 2012). In vitro studies have demonstrated that trivalent arsenicals (iAs3+, MAs3+, and DMAs3+) can inhibit glucose-stimulated insulin secretion (GSIS) in pancreatic islets (Douillet et al., 2013), insulin-dependent GLUT4 translocation to the plasma membrane in adipocytes (Paul et al., 2007), and disruption of preadipocyte and myoblast differentiation leading to insulin resistance in adipose and muscle tissues (Wauson et al., 2002, Wang et al., 2005, Yen et al., 2010). In murine pancreatic islets, GSIS has been shown to be inhibited by iAs3+, MAs3+, and DMAs3+ after 48-hour exposure without inhibiting insulin synthesis, suggesting that arsenic disrupts the mechanism of insulin secretion (Douillet et al., 2013).
Additionally, this study found that the effect of trivalent arsenical exposure on pancreatic islets is transient with GSIS being restored after 24-hour culture in arsenic-free media. In 3T3-L1
decrease insulin-stimulated glucose uptake (ISGU) by inhibiting phosphatidylinositol-dependent kinase-1/2 (PDK-1/2). Because PDK-1/2 phosphorylate PKB/Akt at Thr-308 and Ser-473,
respectively, inhibition of PDK-1/2 subsequently leads to an inhibition of PKB/Akt and ISGU, as active PKB/Akt stimulates GLUT4 transport to the plasma membrane in adipocytes (Paul et al., 2007).
Though mechanistic work surrounding insulin secretion and sensitivity after arsenical exposure has been conducted in many cell types, including pancreatic islets and adipocytes, few studies have focused on insulin signal transduction in hepatocytes following arsenical exposure. Because the liver, in conjunction with the pancreas, is one of the major regulators of whole body glucose homeostasis, examining the effect of arsenic exposure in hepatocytes is key to
elucidating the mechanism by which iAs3+ and its methylated metabolites induce a diabetic phenotype. The aims of this study are to determine the effect of iAs3+ and MAs3+ on (1) hepatic gluconeogenesis, (2) hepatic glycogen synthesis and breakdown, and (3) upstream and
downstream steps in the insulin signaling pathway affecting gluconeogenesis and glycogen metabolism.
CHAPTER 2: MATERIALS AND METHODS
2.1 Liver perfusion, hepatocyte isolation and culture
penicillin/streptomycin, and 2 mM glutamine. All procedures involving mice have been approved by the UNC IACUC review panel.
2.2Antibodies and reagents
Primary antibodies were purchased from Cell Signaling Technology (Danvers, MA). Secondary antibodies and SuperSignal West Pico chemiluminescent substrate were purchased from Thermo Fisher Scientific (Waltham, MA). Bovine serum albumin (fatty acid free), insulin (human recombinant), sodium-D-lactate, sodium pyruvate, Avertin (2,2,2-tribromoethanol), phosphatase inhibitor cocktails 1 and 2, Percoll, 8-Br-cAMP, dexamethasone, rabbit glycogen, glucose-1-phosphate, AMP, caffeine, ammonium molybdate, zinc acetate, and ascorbic acid were purchased from Sigma-Aldrich (St. Louis, MO). Type I collagenase was purchased from Worthington Biochemical Corporation (Lakewood, NJ). Protease inhibitor tablets were
purchased from Roche (Indianapolis, IN). Cell culture media and reagents were purchased from Invitrogen (Carlsbad, CA). 14C-UDP-glucose was purchased from American Radiolabeled Chemicals (St. Louis, MO). Absorbance and fluorescence were measured using a Synergy HT plate reader purchased from BioTek (Winooski, VT).
2.3 Glycogen content assay
A glycogen content assay kit was employed (BioVision, K646-100) following
MAs3+ for 4 hours, with or without 100 nM insulin treatment in the last 2 hours. Cells were harvested using buffer provided by the assay kit.
2.4 Gluconeogenesis assay
As previously described by Zhang et al., (2014), hepatocytes were cultured overnight and serum-starved the following day. After sixteen hours of starvation, media was changed to a phenol red and glucose-free D/MEM (Gibco, A14430-01) supplemented with 2 mM glutamine, 1% penicillin/streptomycin, 10 mM HEPES (pH 7.35), 20 mM sodium lactate, and 2 mM sodium pyruvate, and one half of the wells were also supplemented with 300 µM 8-Br-cAMP and 1 µM dexamethasone. Cells were then treated with 1.0, 2.0, or 5.0 µM iAs3+ for 4 hours. Following the exposure, media was collected by centrifugation at 12,000g for 5 minutes. Determination of glucose concentration in media was determined by glucose assay kit (Cell Biolabs, STA-680) following manufacturer’s directions.
2.5 Glycogen Synthase activity assay
Activity of glycogen synthase was measured by determining the amount of 14 C-UDP-glucose incorporated into glycogen stores as previously described (Thomas et al., 1968, Nuttall et al., 1989) after 4-hour exposure to 0.5, 1.0 and 2.0 µM iAs3+ or 0.2, 0.5 and 1.0 µM MAs3+ (with or without 100 nM insulin treatment in the last 15 minutes of the exposure). Specifically, after arsenic treatment, cells were lysed in buffer (100 mM NaF, 20 mM EDTA, 0.5% glycogen, 1% protease inhibitor, 1% phosphatase inhibitor cocktail, 50 mM glycylglycine, pH 7.4) and centrifuged for 10 minutes at 9,000g to obtain cell lysate. Lysate (20 µL) was mixed with 100 µL of reaction buffer (0.25 mM 14C-UDP-glucose, 1% glycogen, 10 mM Na2SO4, 60 mM
minutes using a Teflon-coated stir bar. The filter paper was washed in 66% ethanol a second time for 10 minutes and a third time for 5 minutes. The ethanol was decanted and the filter papers were dried for 1 hour. Filter papers were then placed into a scintillation vial with 5.0 mL of counting solution. Radioactivity was counted with a TRI-CARB 1900 TR liquid scintillation analyzer.
2.6 Glycogen Phosphorylase activity assay
When overloaded with glucose-1-phosphate and glycogen, glycogen phosphorylase can catalyze the reversal of its physiological function, leading to glucose-1-phosphate incorporation into glycogen and release of Pi. Glycogen phosphorylase activity was measured by determining
the concentration of Pi released by this reverse reaction, as previously described (Hue et al.,
1975, Saheki et al., 1985, Stalmans et al., 1975). After 4-hour exposure to 0.5, 1.0 and 2.0 µM iAs3+ or 0.2, 0.5 and 1.0 µM MAs3+ (with or without 100 nM insulin treatment in the last 15 minutes of the exposure), hepatocytes were lysed in buffer (100 mM NaF, 20mM EDTA, 0.5% glycogen, 50 mM glycylglycine, pH 7.4). Lysates were diluted 1:5 times with a homogenization buffer (100 mM NaF, 10 mM EDTA, pH 6.5) and sonicated as previously described.100 µL of cell lysate was incubated with 100 µL of reaction buffer (2% glycogen, 100 mM glucose-1-phosphate, 2 mM AMP or 1 mM caffeine) and incubated in a water bath at 30°C for 20 minutes. To determine the concentration of Pi, 20 µL of reaction mixture (or standards) were added to a
96-well plate, followed by 200 µL of a molybdate reagent (100 mM zinc acetate, 15 mM ammonium molybdate, pH 5) and 50 µL of 10% ascorbic acid (pH 5.0). The mixture was then incubated for 10 minutes at 30°C and absorbance was measured at 850 nm.
Protein phosphatase-1 activity was measured with Molecular Probes R-33700 following manufacturer directions. Hepatocytes were exposed to 0.5, 1.0, or 2.0 µM iAs3+ or 0.2, 0.5, or 1.0 µM MAs3+ for 4 hours (with or without 100 nM insulin stimulation in the last 15 minutes of the exposure) and then lysed in buffer (100 mM NaF, 20 mM EDTA, 0.5% glycogen, 1% protease inhibitor, 50 mM glycylglycine, pH 7.4) and centrifuged at 9,000g for 10 minutes. The cell lysates (50 µL) and reaction buffer were added to the wells of the substrate-coated
microplate provided in the kit. In the reaction buffer provided in the kit, 2 mM dithiothreitol (DTT) was later substituted with 1 mM tris(2-carboxyethyl)phosphine (TCEP, a non-thiol reductant). The reaction mixture was incubated for 20 minutes at room temperature with protection from light. Excitation/emission spectra of the fluorescent product were measured at 358/452 nm.
2.8 Immunoblot analyses
Hepatocytes were exposed to 0.5, 1.0 and 2.0 µM iAs3+ or 0.2, 0.5 and 1.0 µM MAs3+ for 4 hours, with or without insulin treatment in the last 15 minutes of the exposure. They were then lysed in buffer (20 mM Tris-HCl, 0.1 mM Na3VO4, 25 mM NaF, 25 mM glycerophosphate, 2
mM EGTA, 1 mM dithiothreitol, 0.5 mM PMSF, 0.3% Triton X-100, 1% protease inhibitor, 1% phosphatase inhibitor cocktail, pH 7.5). Lysates were diluted 1:2 times in Laemmli sample buffer and boiled before loading onto SDS-PAGE. SuperSignal West Pico chemiluminescent substrate was used to detect horseradish peroxidase-conjugated secondary antibodies on x-ray film. An Epson Perfection 2400 scanner was utilized to convert film to digital images, which were cropped in Photoshop CS2 and quantified using ImageJ.
Cell viability was assessed by MTT assay. Hepatocytes were cultured overnight in supplemented WME and exposed to 0.5, 1.0, 5.0, 10, and 50 µM iAs3+ or 0.1, 0.2, 0.5, 1.0, and 2.0 µM MAs3+ for 4 hours. With one hour remaining in the exposure time, cells were washed with phenol-red free D/MEM and a phenol-red free D/MEM containing the corresponding exposure was added back to the cells. After 4 hours, the cells were solubilized in DMSO and absorbance was measured at 750 nm.
2.10 Statistical analysis
All values are expressed as mean ± SD for a given number of replicates. Comparisons were performed using Student’s t test. All data represents three independent experiments, i.e. hepatocyte cultures from three mice. Only p-values < 0.05 were considered statistically significant.
CHAPTER 3: RESULTS
3.1 Hepatic glycogen content was reduced by iAs3+ and MAs3+ exposure
Glycogen content assays were utilized to determine if arsenic was indeed having an impact on hepatic glycogen metabolism. In murine hepatocytes, insulin stimulation resulted in a 20% increase in glycogen content. Following a 4-hour iAs3+ or MAs3+ exposure, glycogen content in insulin-stimulated hepatocytes was decreased in a dose-dependent manner (Figure 1A and B). Exposure to iAs3+ decreased glycogen content by 28% (0.5 µM), 37% (1.0 µM), and 43% (2.0 µM), while exposure to MAs3+ decreased glycogen content by 31% (0.1 µM), 46% (0.2
viability after a 4-hour exposure to varying concentrations of iAs3+ and MAs3+. A significant decrease in cell viability was only seen in cells exposed to 10 and 50 µM iAs3+ and no significant decrease was seen in cell viability after MAs3+ exposure in concentrations tested (Figure 1C and D).
Figure 1. Glycogen content in hepatocytes exposed to iAs3+ (A)or MAs3+ (B) for 4 hours with or without
insulin (100 nM) treatment for the last 2 hrs. Cell viability after 4-hour exposure to iAs3+ (C) or MAs3+
(D) was measured by MTT assay. Values are expressed as mean ± SD for N=3.* and # indicate
statistically significant effects of the exposure compared to control basal and control insulin-stimulated
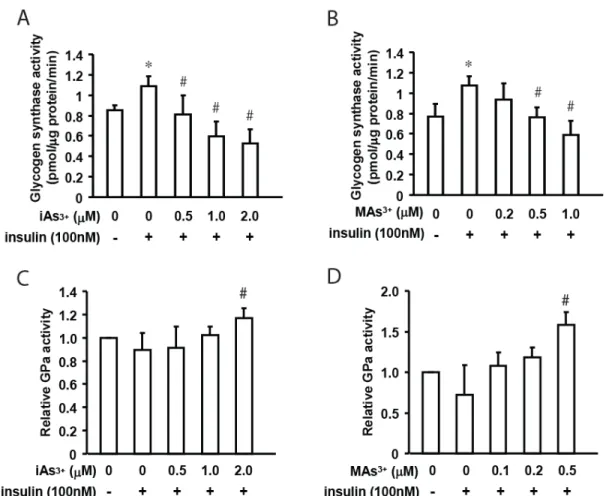
Glycogen synthase (GS), an enzyme whose activity is regulated by insulin-stimulated dephosphorylation, is a key player in the accumulation of hepatic glycogen. GS incorporates UDP-glucose into existing glycogen chains and its activity can be tracked by 14C labeled UDP-glucose incorporation into existing glycogen chains, as previously described (Thomas et al., 1968, Nuttall et al., 1989). Insulin treatment significantly increased GS activity compared to an unstimulated control, while iAs3+ or MAs3+ exposure in conjunction with insulin treatment significantly inhibited GS activity in a dose-dependent manner (Figure 2A and B). The 4-hour iAs3+ exposure inhibited insulin-stimulated GS activity by 25% (0.5 µM), 50% (1.0 µM), and 55% (2.0 µM), while the 4-hour MAs3+ exposure inhibited insulin-stimulated GS activity by 30% (0.5 µM) and 45% (1.0 µM).
Glycogen phosphorylase (GP) is another key player in hepatic glycogen content
regulation. The active, phosphorylated form of glycogen phosphorylase (GPa) is deactivated by protein phosphatase-1 (PP1), which is activated by insulin (Hue et al., 1975, Stalmans et al., 1975). Exposure to iAs3+ and MAs3+, in conjunction with insulin treatment, led to a stimulation of GP activity with statistically significant increases at 2.0 µM iAs3+ (1.31 fold) and 1.0 µM MAs3+ (2.20 fold) (Figure 2C and D). Insulin stimulation alone did not significantly inhibit glycogen phosphorylase activity, which is consistent with previous findings that insulin stimulation alone does not significantly inhibit glycogen phosphorylase (DePaoli-Roach et al., 2003, Petersen et al., 1998), though hyperglycemia does significantly inhibit glycogen
Figure 2. Glycogen synthase (GS) activity in hepatocytes exposed to iAs3+ (A)or MAs3+ (B) for 4 hours
with or without insulin treatment (100 nM) for the last 2 hours. Glycogen phosphorylase (GP) activity in
hepatocytes exposed to iAs3+ (C) or MAs3+ (D) 4 hours with or without insulin treatment (100 nM) for the
last 2 hrs. Values are expressed as mean ± SD for N=3. * and # indicate statistically significant effects of
3.3 iAs3+ and MAs3+ exposure increased GS phosphorylation at Ser-641
GS activity is controlled both allosterically and by phosphorylation status. Allosterically, GS is activated by glucose-6-phosphate and inhibited by ATP, ADP, and Pi. The phosphorylation
of GS by glycogen synthase kinase-3α (Rylatt et al., 1980), AMP-activated kinase (AMPK)
(Embi et al., 1981), or protein kinase A (PKA) (Proud et al., 1977) inhibits GS. Consistent with our finding that 4-hour iAs3+ and MAs3+ exposure lead to significant inhibition of GS activity, immunoblot analysis showed that significant phosphorylation of GS at Ser-641 occurred during the 4-hour iAs3+ and MAs3+ exposure (Figure 3). The iAs3+ exposure increased GS
phosphorylation at Ser-641 by 1.3, 1.7, and 2.0 fold at 0.5 µM, 1.0 µM, and 2.0 µM,
Figure 3. Glycogen synthase (GS) and phosphorylated GS (pGS) levels in hepatocytes exposed for 4
hours to iAs3+ (A,B) or MAs3+ (C,D) with or without insulin (100 nM) treatment for the last 15 minutes.
Representative immunoblots (A,C) are shown for N=3. (B,D) Values are expressed as mean ± SD for
N=3. * and # indicate statistically significant effects of the exposure compared to control basal and
control insulin-stimulated hepatocytes, respectively.
3.4 iAs3+ and MAs3+ exposure inhibited phosphorylation of PKB/Akt with no significant
change in GSK3α phosphorylation
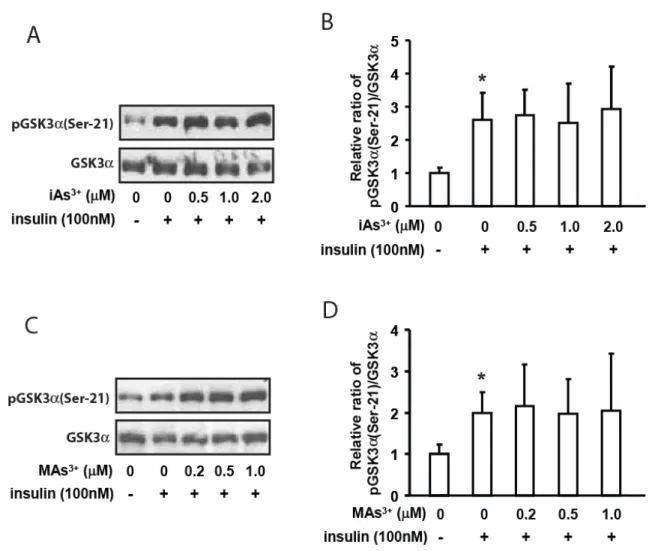
activity. Insulin stimulates PKB/Akt phosphorylation at Ser-473 and Thr-308, the two sites essential for full activation of PKB/Akt (Alessi et al., 1996, Sarbassov et al., 2005). Both iAs3+ and MAs3+ significantly decreased PKB/Akt phosphorylation at both the Ser-473 and Thr-308 in a dose-dependent manner (Figure 4), while no significant change in GSK3α phosphorylation at
Ser-21 was seen after 4-hour exposure to iAs3+ or MAs3+ (Figure 5). The results of these experiments suggest that GS inhibition and GP activation by iAs3+ and MAs3+ is due to a mechanism other than the disruption of PKB/Akt-mediated insulin signal transduction.
Figure 4. Representative images of immunoblots of mouse primary hepatocytes exposed to iAs3+ (A) or
MAs3+ (C) for 4 hours with or without 100nmol insulin for the last 15 minutes. Quantitative analysis of A
and C using ImageJ are shown in figures B and D, respectively. Values are expressed as means ± SD for
Figure 5. Representative images of immunoblots of mouse primary hepatocytes exposed to iAs3+ (A) or
MAs3+ (C) for 4 hours with or without 100nmol insulin for the last 15 minutes. Quantitative analysis of A
and C using ImageJ are shown in figures B and D, respectively. Values are expressed as means ± SD
N=3. * and # indicate significant change compared to control basal and insulin-stimulated control
hepatocytes, respectively.
3.5 PP1 activity was not inhibited by iAs3+ or MAs3+ exposure
Since GS inhibition by As exposure is independent of Akt/GSK3α-mediated
activated by insulin, dephosphorylates both GS and GP (Cohen,1989). Dephosphorylation of GS and GP activates and inactivates the two enzymes, respectively (DePaoli-Roach et al., 2003). PP1 activity was measured using a Ser/Thr phosphatase assay kit (Molecular Probes, R-33700) with buffers modifiable to select for several Ser/Thr phosphatases, including PP1. Despite following the manufacturer’s directions, no significant change in PP1 activity was observed following either iAs3+ or MAs3+ exposure. Dithiothreitol (DTT), one of the modifiable buffer reagents, is a thiol containing reducing agent. Because thiol containing compounds readily bind to arsenic (Spuches et al., 2005), DTT was later replaced by 1 mM tris(2-carboxyethyl)phosphine (TCEP, a non-thiol reducing agent) in the reaction buffer. While activity of PP1 was anticipated to increase upon insulin stimulation, no significant differences between the unstimulated control, the insulin-stimulated control, or iAs3+ and MAs3+ treatments were observed (Figure 6A and B). These results suggest that neither inhibition of PP1 activity nor Akt-GSK3α signaling are
Figure 6. Protein phosphatase 1 (PP1) activity in hepatocytes exposed to iAs3+ (A) or MAs3+ (B) for 4
hours with or without insulin (100 nM) treatment for the last 2 hours. (C) Glucose output from
hepatocytes exposed to iAs3+ for 4 hours in the presence of GNG substrates (20 mM sodium lactate and 2
mM sodium pyruvate), and treated with 300 mM 8-Br-cAMP (cAMP), 1 mM dexamethasone (Dex),
and/or 100 nM insulin. Representative immunoblots (D) for FOXO1 and pFOXO1 levels in hepatocytes
treated iAs3+ for 4 hours; with or without stimulation with 100 nM insulin for the last 15 minutes. Values
in panels A, B, and C are expressed as mean ± SD for N=3. * and # mark statistically significant effects
CHAPTER 4: DISCUSSION
4.1 Inhibition of GS activation by iAs3+ and MAs3+ is independent of the PKB/Akt and
GSK3α pathway
Regulation of hepatic glycogen content is a major component in whole body glucose homeostasis. GS and GP are the two major enzymes impacting hepatic glycogen content and are both regulated by complex pathways of kinases and phosphatases, in addition to allosteric and transcriptional regulation (Figure 7). Under our experimental conditions, C57BL/6 primary hepatocytes exposed to iAs3+ and MAs3+ saw significant, dose-dependent reduction in insulin-stimulated glycogen accumulation, suggesting a dysregulation of glycogen metabolism by arsenicals. Hepatic glucose output was not affected by arsenic exposure (Figure 6C).
Figure 7. Mechanism by which As exposure disrupts glycogen metabolism in primary murine
hepatocytes
The dose-dependent increase in glycogen synthase phosphorylation (Figure 3) corresponding to a subsequent loss in activity (Figure 2A and B) provides a basis for the mechanism of glycogen accumulation dysregulation in hepatocytes exposed to arsenicals. To determine if iAs3+ and MAs3+ were directly acting on GS itself or an upstream effector, iAs3+ and MAs3+ of varying concentrations were administered in vitro to control cell lysates and GS
Glucagon, Epinephrine Adenylyl cyclase ATP cAMP Phosphodiesterase 5’-AMP Insulin Akt P P cAMP PKA PKA R R Glucose Glycogen P GS GS PP1 GSK3a GSK3a P GP GP P GPK P GPK PP1 PKA R cAMP R cAMP PP1 Insulin Insulin
iAs3+&and&MAs3+&
inhibit&
phosphoryla3on&of& Akt&
iAs3+&and&MAs3+&
inhibit&GS& ac3va3on&by& insulin&
iAs3+&and&MAs3+&exposure&
decreases&glycogen&content&
iAs3+&and&MAs3+&
inhibit&GP& deac3va3on&
?& ?&
iAs3+&and&MAs3+&did¬&
for inhibition of GS activity in hepatocytes exposed to arsenicals. Additionally, subtoxic trivalent arsenical exposure has previously been demonstrated to inhibit insulin-dependent PKB/Akt phosphorylation at both the Ser-473 and Thr-308 residues in 3T3-L1 adipocytes (Paul et al., 2007). Phosphatidylinositol-dependent kinase-1 (PDK-1) and mTORC2 activate PKB/Akt by phosphorylation at Thr-308 and Ser-473, respectively, and have been shown to be inhibited by iAs3+ and MAs3+ exposure in 3T3-L1 adipocytes (Paul et al., 2007), providing a possible mechanistic link to As exposure and impaired insulin-stimulated PKB/Akt phosphorylation in primary hepatocytes.
GSK3α is a constitutively active enzyme regulated by phosphorylation of tyrosine
residues (active form) and serine residues (inactive form) (Wang et al., 1994). GSK3α
phosphorylation at Ser-21 was anticipated to decline after arsenic exposure, corresponding to an increase in activity, as its inhibitor’s (phospho-PKB/Akt) phosphorylation was reduced by iAs3+ and MAs3+ exposure. While a dose-dependent reduction in PKB/Akt phosphorylation at both Ser-473 and Thr-308 was observed in hepatocytes after both iAs3+ and MAs3+ exposures, no significant change was seen in phosphorylation of GSK3α at Ser-21. However, the serine
phosphorylation of GS by GSK3α (Rylatt et al., 1980) is not the only mechanism of GS
deactivation. AMP-activated kinase (AMPK) (Bultot et al., 2012), casein kinase 2 (CK2) (Grande et al., 1989, Imazu et al., 1984a), and protein kinase A (PKA) (Proud et al., 1977) have also been implicated in this process. GSK3α phosphorylates 641, 645, 647, and
Ser-653 of GS (Rylatt et al., 1980); AMPK phosphorylates Ser-7 (Bultot et al., 2012); CK2
Ser-710 are located (Bai et al., 1990, Ros et al., 2009). Thus, the liver isoform of GS is not phosphorylated by PKA. Notably, Ser-7, the site phosphorylated by AMPK, was found by mutagenesis to be the most influential phosphorylation site for GS activity regulation (Ros et al., 2009).
Though clear inhibition of PKB/Akt phosphorylation was seen in this study, it did not alter the phosphorylation status of GSK3α Ser-21, strongly suggesting the involvement of PP1 in
GS and GP dysregulation.
4.2 Inhibition of GS activation and GP deactivation appears to be independent of PP1
The catalytic subunit of PP1 (PP1c) is targeted to glycogen by dimerization with the regulatory glycogen-binding subunit (GL). GL binding to PP1c has been shown to be insulin
dependent and to increase specificity of PP1 to GS over GP (Munro et al., 2005). With no significant change seen in GSK3α activity, a significant decrease of PP1 activity could explain
possible that an alternative method of sample preparation such as cellular fractionation to isolate a glycogen-enriched pellet (Greenberg et al., 2006) would be beneficial in isolating PP1 from other Ser/Thr phosphatases in the cell lysate to more clearly see changes in PP1 activity. Additionally, GS or GP isolation and purification from mouse liver and subsequent 32
P-phosphorylation by protein kinases can be utilized to measure glycogen metabolism-specific PP1 activity in future studies (DePaoli-Roach et al., 2003).
4.3 Conclusions and Future Directions
In this study, we have demonstrated a new mechanism by which arsenical exposure disrupts glucose homeostasis, and specifically hepatic glycogen metabolism, by inhibiting GS and activating GP in hepatocytes. Both arsenic exposure and diabetes are global public health issues and the identification of this mechanism may help to develop strategies for treatment and/or prevention of As-associated diabetes.
Our results do not appear to suggest the involvement of the insulin-stimulated PI3K-Akt-GSK3α pathway, much to our surprise. While PP1 activity was not shown to have changed with
arsenic exposure, it is possible that with modification and further optimization of the PP1 activity measurement, potential involvement of PP1 can be better assessed. Investigation into the
potential roles of AMPK and CK2 in the regulation of GS activity during arsenic exposure may also help to reveal the mechanism by which arsenicals inhibit GS activity.
References
(ADA) American Diabetes Association. Classification and Diagnosis of Diabetes. Diabetes Care
2016; 39:S13-S22.
Agius L. Role of glycogen phosphorylase in liver glycogen metabolism. Mol Aspects Med. 2015; 46:34-45.
Alessi DR, Andjelkovic M, Cauldwell B, Cron P, Morrice N, Cohen P, Hemmings BA. Mechanism of activation of protein kinase B by insulin and IGF-1. Embo. J. 1996; 15: 6541-6551.
(ATSDR) Agency for Toxic Substances, Disease Registry. Toxicological Profile for Arsenic. U.S. Department of Health and Human Services. 2007. Available from:
https://www.atsdr.cdc.gov/toxprofiles/tp2.pdf
Bai G, Zhang ZJ, Werner R, Nuttall FQ, Tan AW, Lee EY: The primary structure of rat liver glycogen synthase deduced by cDNA cloning. Absence of phosphorylation sites 1a and
1b. J Biol Chem 1990; 265:7843-7848.
Beck R, Styblo M, Sethupathy P. Arsenic Exposure and Type 2 Diabetes: MicroRNAs as Mechanistic Links? Curr Diab Rep. 2017; 17:18.
Bultot L, Guigas B, Von Wilamowitz-Moellendorff A, Maisin L, Vertommen D, Hussain N, Beullen M, Guinovart JJ, Foretz M, Viollet B, Sakamoto K, Hue L, Rider MH. AMP-activated protein kinase phosphorylates and inactivates liver glycogen synthase. Biochem J. 2012; 443:193-203.
(CDC) Centers for Disease Control. National Diabetes Statistics Report [Internet]. Centers for Disease Control. 2014. Available from:
https://www.cdc.gov/diabetes/pubs/statsreport14/national-diabetes-report-web.pdf Cross DAE, Alessi DR, Cohen P, Andjelkovich M, Hemmings BA. Inhibition of glycogen
synthase kinase-3 by insulin mediated by protein kinase B. Nature 1995; 378:785-789. Chung JY, Yu S Do, Hong YS. Environmental source of arsenic exposure. J Prev Med Public
Heal. 2014; 47:253–7.
Cohen P. Regulation of Protein Phosphatases. Regulation. 1989;453–508.
Davis MA, Signes-Pastor AJ, Argos M, Slaughter F, Pendergrast C, Punshon T, Gossai A, Ahsan H, Karagas MR. Assessment of human dietary exposure to arsenic through rice. Sci Total
with increased prevalence of diabetes: a cross-sectional study in the Zimapán and Lagunera regions in Mexico. Environ Health 2011; 10:73.
DePaoli-Roach AA, Vilardo PG, Kim JH, Mavila N, Vemuri B, Roach PJ: Determination of mammalian glycogen synthase phosphatase activity. Methods Enzymol 2003; 366:17-34. Douillet C, Currier J, Saunders J, Bodnar WM, Matoušek T, Styblo M. Methylated trivalent
arsenicals are potent inhibitors of glucose stimulated insulin secretion by murine pancreatic islets. Toxicol Appl Pharmacol. 2013; 267:11–5.
Drobna Z, Styblo M, Thomas DJ. An Overview of Arsenic Metabolism and Toxicity. Curr Protoc Toxicol. 2009; 42:4.31.1-4.31.6.
Druwe IL, Vaillancourt RR. Influence of arsenate and arsenite on signal transduction pathways: An update. Arch Toxicol. 2010; 84:585–96.
Embi N, Parker PJ, Cohen P: A reinvestigation of the phosphorylation of rabbit skeletal-muscle glycogen synthase by cyclic-AMP-dependent protein kinase. Identification of the third site of phosphorylation as serine-7. Eur J Biochem 1981; 115:405-413.
Gibb H, Haver C, Gaylor D, Ramasamy S, Lee JS, Lobdell D, Wade T, Chen C, White P, Sams R. Utility of recent studies to assess the National Research Council 2001 estimates of cancer risk from ingested arsenic. Environ Health Perspect 2011; 119:284-290. Grande J, Perez M, Plana M, Itarte E. Acute effects of insulin and glucagon on hepatic casein
kinase 2 in adult fed rats: correlation of the effects on casein kinase 2 with changes in glycogen synthase activity. Arch Biochem Biophys. 1989; 275:478-485.
Greenberg CC, Danos AM, Brady MJ. Central Role for Protein Targeting to Glycogen in the Maintenance of Cellular Glycogen Stores in 3T3-L1 Adipocytes. Mol Cell Biol 2006; 26: 334-332.
Hue L, Bontemps F, Hers H: The effects of glucose and of potassium ions on the interconversion of the two forms of glycogen phosphorylase and of glycogen synthetase in isolated rat liver preparations. Biochem J 1975; 152:105-114.
(IARC) International Agency for Research. IARC Monographs on the Evaluation of
Carcinogenic Risks to Humans, Some Drinking-water Disinfectants and Contaminants, Including Arsenic. World Health Organization International Agency for Research on Cancer. 2004.
Krssak M, Brehm A, Bernroider E, Anderwald C, Nowotny P, Dalla Man C, Cobelli C, Cline GW, Shulman GI, Waldhausl W, Roden M. Alterations in postprandial hepatic glycogen metabolism in type 2 diabetes. Diabetes 2004; 53:3048-3056.
Lin HV, Accili D: Hormonal regulation of hepatic glucose production in health and disease. Cell Metab 2011; 14:9-19.
Maull EA, Ahsan H, Edwards J, Longnecker MP, Navas-Acien A, Pi J, Silbergeld EK, Styblo M, Tseng CH, Thayer KA, Loomis D. Evaluation of the association between arsenic and diabetes: a National Toxicology Program workshop review. Environ Health Perspect
2012; 120:1658-1670.
Mendez MA, González-horta C, Sánchez-ramírez B, Ballinas-casarrubias L, Cerón RH, Morales DV, Baeza Terrazas FA, Ishida MC, Guiterrez-Torres DS, Saunders RJ, Drobna Z, Fry RC, Buse JB, Loomis D, Garcia-Vargas GG, Del Razo LM, Styblo M. Chronic Exposure to Arsenic and Markers of Cardiometabolic Risk: A Cross-sectional Study in Chihuahua, Mexico. Environ. Health Perspect. 2016; 104:104–11.
Munro S, Ceulemans H, Bollen M, Diplexcito J, Cohen PTW. A novel glycogen-targeting subunit of protein phosphatase 1 that is regulated by insulin and shows differential tissue distribution in humans and rodents. FEBS J. 2005; 272:1478–89.
Nachman KE, Love DC, Baron PA, Nigra AE, Murko M, Raber G, Francesconi KA, Navas-Acien A. Nitarsone, Inorganic Arsenic, and Other Arsenic Species in Turkey Meat: Exposure and Risk Assessment Based on a 2014 U.S. Market Basket Sample. Environ
Health Perspect. 2016; 125:363–9.
Nigra AE, Nachman KE, Love DC, Grau-perez M, Navas-acien A. Poultry Consumption and Arsenic Exposure in the U.S. Population. Envirnomental Heal Perspect. 2016; (3):370–7. Nuttall FQ, Gannon MC: An improved assay for hepatic glycogen synthase in liver extracts with
emphasis on synthase R. Anal Biochem 1989; 178:311-319.
Paul DS, Harmon AW, Devesa V, Thomas DJ, Styblo M: Molecular mechanisms of the diabetogenic effects of arsenic: inhibition of insulin signaling by arsenite and methylarsonous acid. Environ Health Perspect 2007; 115:734-742.
Paul DS, Hernández-Zavala A, Walton FS, Adair BM, Dědina J, Matoušek T, Styblo M. Examination of the effects of arsenic on glucose homeostasis in cell culture and animal studies: Development of a mouse model for arsenic-induced diabetes. Toxicol Appl
Proud CG, Rylatt DB, Yeaman SJ, Cohen P. Amino Acid Sequences at the Two Sites on Glycogen Synthase Phosphorylated by Cyclic AMP-Dependent Protein Kinase and their Dephosphorylation by Protein Phosphatase-III. FEBS Letters 1977; 80: 435-442.
Rylatt DB, Aitken A, Bilham T, Condon GD, Embi N, Cohen P: Glycogen synthase from rabbit skeletal muscle. Amino acid sequence at the sites phosphorylated by glycogen synthase kinase-3, and extension of the N-terminal sequence containing the site phosphorylated by phosphorylase kinase. Eur J Biochem 1980; 107:529-537.
Roach PJ. Control of glycogen synthase by hierarchal protein phosphorylation. FASEB J. 1990; 4:2961-2968.
Ros S, Garcia-Rocha M, Dominguez J, Ferrer JC, Guinovart JJ: Control of liver glycogen synthase activity and intracellular distribution by phosphorylation. J Biol Chem 2009; 284:6370-6378.
Saheki S, Takeda A, Shimazu T: Assay of inorganic phosphate in the mild pH range, suitable for measurement of glycogen phosphorylase activity. Anal Biochem 1985; 148:277-281. Saini V. Molecular mechanisms of insulin resistance in type 2 diabetes mellitus. World J
Diabetes. 2010; 1:68–75.
Sarbassov DD, Guertin DA, Ali SM, Sabatini DM. Phosphorylation and regulation of Akt/PKB by the rictor-mTOR complex. Science. 2005; 307:1098-1101.
Smith AH, Hopenhayn-Rich C, Bates MN, Goeden HM, Hertz-Picciotto I, Duggan HM, Wood R, Kosnett MJ, Smith MT. Cancer risks from arsenic in drinking water. Environ Health Perspect. 1992; 97:259–67.
Spuches AM, Kruszyna HG, Rich AM, Wilcox DE: Thermodynamics of the As(III)-thiol interaction: arsenite and monomethylarsenite complexes with glutathione, dihydrolipoic acid, and other thiol ligands. Inorg Chem 44:2964-2972, 2005
Srivastava AK, Pandey SK. Potential mechanism(s) involved in the regulation of glycogen synthesis by insulin. Mol. Cell Biochem. 1998; 182:135-141.
Stalmans W, Hers HG: The stimulation of liver phosphorylase b by AMP, fluoride and sulfate. A technical note on the specific determination of the a and b forms of liver glycogen
phosphorylase. Eur J Biochem 1975; 54:341-350
Sung TC, Huang JW, Guo HR. Association between Arsenic Exposure and Diabetes: A Meta-Analysis. Biomed Res Int 2015; 2015: 368087
Biochem 1968; 25:486-499.
Tseng CH. Arsenic methylation, urinary arsenic metabolites and human diseases: current perspective. J Environ Sci Health C Environ Carcinog Ecotoxicol Rev. 2007; 25:1-22. Vahter M, Marafante E, Dencker L. Metabolism of arsenobetaine in mice, rats and rabbits. Sci
Total Environ. 1983; 30:197–211.
Walton FS, Harmon AW, Paul DS, Drobná Z, Patel YM, Styblo M. Inhibition of
insulin-dependent glucose uptake by trivalent arsenicals: Possible mechanism of arsenic-induced diabetes. Toxicol Appl Pharmacol. 2004; 198:424–33.
Wang QM, Fiol CJ, DePaoli-Roach AA, Roach PJ. Glycogen synthase kinase-3α is a dual
specificity kinase differentially regulated by tyrosine and serine/threonine phosphorylation. J Biol Chem. 1994; 269:14566–74.
Wang SL, Chang FH, Liou SH, Wang HJ, Li WF, Hsieh DPH. Inorganic arsenic exposure and its relation to metabolic syndrome in an industrial area of Taiwan. Environ Int. 2007;
33:805–11.
Wang ZX, Jiang CS, Liu L, Wang XH, Jin HJ, Wu Q, Chen Q: The role of Akt on arsenic trioxide suppression of 3T3-L1 preadipocyte differentiation. Cell Res 2005; 15:379-386. Wauson EM, Langan AS, Vorce RL: Sodium arsenite inhibits and reverses expression of
adipogenic and fat cell-specific genes during in vitro adipogenesis. Toxicol Sci 2002; 65:211-219.
(WHO) World Health Organization. Global Report on Diabetes. France. World Health Organization; c2016. Available from:
http://apps.who.int/iris/bitstream/10665/204871/1/9789241565257_eng.pdf Yen YP, Tsai KS, Chen YW, Huang CF, Yang RS, Liu SH: Arsenic inhibits myogenic
differentiation and muscle regeneration. Environ Health Perspect 118:949-956, 2010 Zhang C, Cooper DE, Grevengoed TJ, Li LO, Klett EL, Eaton JM, Harris TE, Coleman RA: Glycerol-3-phosphate acyltransferase-4-deficient mice are protected from diet-induced insulin resistance by the enhanced association of mTOR and rictor. Am J Physiol
Endocrinol Metab 2014; 307:E305-315.
Zhang C, Klett EL, Coleman RA. Lipid signals and insulin resistance. Clin. Lipidol 2013; 8:659-667.