ORIGINAL ARTICLE
Effects of Crude Oil and Gold Prices on US Stock Market: Evidence
for USA from ARDL Bounds Testing
Matiur Rahman1*, Muhammad Mustafa2
1 McNeese State University 2 South Carolina State University
Abstract: This paper explores the effects of changes in crude oil and gold prices on US Stock market movement. Daily data are used from the first business day of January, 1986 to December 30, 2016. Efficient unit root tests (DF-GLS and Ng-Perron) are applied to examine the time series property of the variables in terms of stationarity or non-stationarity. ARDL Bounds Testing is applied for co-integration. Both DF-GLS and Ng-Perron tests confirm non-stationarity of each variable and depict behavior of all the variables in log-levels, included in this study. The ARDL-Bounds testing confirms co-integration among the variables. There is evidence of long-run convergence among all these variables with very tepid adjustment towards the equilibrium. Short-run negative effects of changes in gold and crude oil prices on US stock market returns are observed. The effect is statistically significant from gold price changes, but insignificant from crude oil price changes.
Keywords: gold price; crude oil price; stock market return; ARDL; VECM; causality; feedback; long-run; short-run
1. Introduction
The causal interactive relationship among US stock market return and prices of crude oil and gold is complex and often ambiguous. The direction of causality is an unsettled issue in the empirical literature of macroeconomics and finance. The complexity in their relationship is confounded by negative political shocks and global unease in financial markets. Crude oil and gold are strategic commodities. They are traded in US dollar. So, fluctuations in the external value of US dollar significantly influence crude oil and gold prices. The US dollar is the cornerstone of the world financial system. Obviously, its value matters to investors. Quite how it matters is very difficult to understand clearly. The explanations keep changing. Apparently, a weak dollar boosts stocks. However, this inference may occasionally fade away. They are also largely held in institutional portfolios in combination with global securities for diversification of risk. Moreover, central banks hold reserves in gold, major key currencies and highly liquid safe short-term securities. Individuals and crude oil-exporting countries also invest in gold for hedging against inflation to preserve asset value. In brief, turmoils in one market create shockwaves in other markets.
The changes in different markets do not always move in tandem. The common causes of changes include fluctuations in inflation rates, interest rates and exchange rates. They, in turn, affect consumption and investment that are connected to commodity, capital, currency and job markets. So, deepening understanding of the effects of changes in crude oil and gold prices on stock prices is of profound importance[1–12]. The objective of this study is to empirically
explore the long-run and short-run influences of changes in prices of crude oil and gold on changes in US S&P 500. To this effect, the ARDL bounds testing approach is applied using daily data from the first business day of January,1986
Copyright © 2018 Matiur Rahmanet al.
doi: 10.18686/fm.v3i1.1055
This is an open-access article distributed under the terms of the Creative Commons Attribution Unported License
(http://creativecommons.org/licenses/by-nc/4.0/), which permits unrestricted use, distribution, and reproduction in any medium, provided the original work is properly cited.
to December 30, 2016.
The rest of the paper is structured as follows. Section 1 reviews the related empirical literature. Section 2 outlines the empirical design. Section 3 reports results. Section 4 offers conclusions and implications.
2. Review of Related Empirical Literature
An extensive and expanding volume of empirical literature exists on the pairwise and trilateral dynamic interactive relationships between/among prices of crude oil, gold and equity returns across developed and developing countries over varying sample periods using data of differing frequencies and distinctly different econometric tools or techniques. Using data from January, 2008 to January, 2009, Sharma and Mandeep[13] applied regression equation model to
investigate the pairwise relationship between macroeconomic factors like changes in exchange rate, foreign exchange reserves, inflation rate, gold prices and stock value. Empirical results of the study revealed a strong relationship between gold price and the U.S. stock prices. Findings of this study revealed cyclic relationship between gold and stock prices. Historical data from 1930 to 1976 show that gold has negative beta. When included in investment portfolio, it helps mitigate systematic risk. Findings of Dempster and Artigas[14] proved that investment strategies are
highly correlated between gold and stock market along with profitability in the periods of inflation and deflation. Levin and Wright[15] examined the relationship between gold prices and the external values of US dollar. They applied
co-integration technique using data from January, 1976 to August, 2005, and found long-term relationship between these variables. The results revealed further that 1% increase in the external value of US dollar leads to 1% increase in gold prices. However, the relationship may be uneven and weak due to unforeseen external shocks. Findings of their study also suggested positive relationship between gold price movement and US inflation, US inflation volatility and credit risk.
Baur and Mc Dermott[16]conducted a descriptive and econometric analysis of data from 1979 to 2009. Results of
the study indicated that gold is mostly used as hedge against inflation and considered as safe haven for major European and US stock markets except Australia, Canada, Japan and emerging markets such as BRIC countries. Gold investors use it to protect the wealth in extreme unfavorable market conditions. This phenomenon creates higher demand for gold and an overall increase in gold prices, globally. Baur and Mc Dermott[16]studied the trend of gold prices in negative
market conditions and found it curvilinear. They further suggested that negative market conditions exert significant impact on gold investors. Further, McCown and Zimmerman[17] detected gold as Zero-beta asset implying no market
risk.
Moore[18]empirically examined the relationship between gold prices and the value of stock markets empirical for
the period of 1970 to 1988. They observed a negative relationship between gold prices and the value of stock markets which demonstrated that an increase in gold prices tends to cause a decline in the value of stock markets. These findings were also confirmed by Buyuksalvarci[19] who investigated the effects of seven macroeconomic variables (consumer
price index, money market interest rate, gold price, industrial production index, oil price, foreign exchange rate and money supply) on the Turkish capital markets. Findings of this study showed that Turkish investors used gold as an alternative investment tool for equities. In the cases of rising gold prices, they invested less in stocks and more in gold in view of their negative relationship.
Issamand Murinde[20] re-explored the relationship between changes in exchange rate and equity prices in India,
Pakistan, Korea and the Philippines during 1985–1944 by employing co-integration methodology. To add further, Muhammed et al.[21]explored the relationship between exchange rates and equity prices in Pakistan, India, Sri Lanka
and Bangladesh for the period of 1994–2000. Findings of the above studies depicted no causal relationship among monetary variables and equity returns.
In general, prices of commodities tend to move in unison because they are influenced by common macroeconomic factors such as interest rate, exchange rate and inflation[22]. To explain, oil and gold, among others, are the two strategic
commodities which have received much research attention recently, partly due to surges in their prices and rises in their economic uses. Crude oil is the world’s most commonly traded commodity and its price is the most volatile in the commodity market. Gold is considered the leader in the market of precious metals as increases in its price seem to lead to parallel movements in the price of other precious metals[23]. Gold is also an investment asset and commonly known
as a “safe haven” to avoid the increasing risk in financial markets. Using gold as one of risk management tools in hedging and diversifying commodity portfolios, investors in both advanced and emerging markets often switch between oil and gold or combine them to diversify their portfolios[24].
High crude oil price adversely affects economic growth and hence pushes down share prices. Consequently, investors switch to gold for safety as one of alternative assets. Such a scenario prevailed during the 1970s. When the oil cartel reduced crude oil output, there was a steep surge in crude oil price. The oil crisis in 1973 sent shockwaves through the US and the rest of the world. They led to a prolonged global recession in the 1970s. The impact of crude oil prices on gold prices could be established through the export revenue channel[15]. In order to disperse market risk and
maintain commodity value, dominant oil-exporting countries use high revenues from selling oil to invest in gold. Since several countries including crude oil producers keep gold as an asset of their international reserve portfolios, rising crude oil prices may have implications for the surge in gold price. This holds true as long as gold accounts for a significant part in the asset portfolio of oil exporters and oil exporters purchase gold in proportion to their rising oil revenues. Melvin and Sultan[25]opine that the expansion of oil revenues enhances the gold market investment and this
causes price volatility of oil and gold to move in the same direction. In such a scenario, an oil price increase leads to a rise in demand for gold and hence its price.
Presumably, inflation channel is the best and the most common way to explain the linkage between oil and gold markets. A rise in crude oil price leads to an increase in the general price level[26,27]. When the general price level goes
up, the price of gold increases. Hence, surges in inflation, caused by oil prices, lead to an increase in demand for gold to hedge against it and thus push up the gold price. On the other hand, when the gold price fluctuates due to changes in demand for jewelry, being hoarded as a reserve currency and/or being used as an investment asset, it is unlikely to have anything related to oil prices[23]. Several other studies support this view. Sari et al.[23] explore directional
relationships between spot prices of four precious metals (gold, silver, platinum, and palladium), oil and USD/euro exchange rate. They find a weak and asymmetric relationship between oil and gold prices. Specifically, gold price returns do not explain much of oil price returns while oil price returns account for 1.7% of gold price returns. On examining the long-term causal and lead-and-lag relationship between oil and gold markets, Zhang et al.[28] report a
significant co-integrating relationship between the prices of the two strategic commodities. They indicate that percentage changes of crude oil price return significantly and linearly Granger cause the percentage change of gold price return.
Volatility of the external value of US dollar may cause fluctuations in international crude oil and gold prices to move in tandem since both are traded in US dollar. To add further, during expected inflation time, the US dollar weakens against other major currencies. Consequently, investors move from dollar-denominated soft assets to dollar-denominated physical assets[23]. Deterioration of US dollar vis-a'- vis euro may also push up oil price as crude oil
trade is denominated in US dollar. Zhang and Wei[28] confirm evidence of high correlations between the US dollar
exchange rate and the prices of crude oil and gold. Furthermore, Granger causality stemming from the US dollar index induces the price changes of both commodities. Geopolitical events are also another factor that may impact the prices of crude oil and gold simultaneously. In fact, both the commodity markets are very sensitive to the turmoil of international
political situation. Particularly, in times of financial crises, investors often rush to buy gold. Consequently, the price of gold escalates.
Again, Soytas et al.[24]show that the world crude oil price has no predictive power of the prices of precious metals
including that of gold in Turkey. In reality, the situation can become even more complicated, as one can observe that the crude oil price and the gold price relationship are not stable over time.
Several other studies do not support any of the above. In fact, some studies find two-way feedback relationships between crude oil and gold prices[29]. Some indicate that the price of gold, among others, triggers crude oil
price. This implies that when the world economic system is hit by a common stochastic shock, the gold price moves first and the oil price follows[22]. This finding, however, does not support the common belief that oil price is the leader
of the formation of overall inflation. Several other previous studies also have shown that oil price fluctuations have asymmetric effects on macroeconomic variables and the gold price[23,27,29]. Crude oil and gold prices have discernible
economic impacts on financial activities, and all sectors of the US economy. This impact is directly apparent in consumption, industrial production and investment in both real and financial sectors. Volatilities of crude oil and gold prices influence directly stock prices with implications for the US capital market. Indirectly, they influence inflation and unemployment[1].
Crude oil price is also influenced by geopolitical and weather related factors, which may create unexpected shifts in supply and demand leading to volatility in crude oil price. Understanding the volatility of crude oil price is very critical, because it may create uncertainty in all sectors of the economy. In turn, there would be instability in the economies of both oil-exporting and oil-importing countries. The crude oil price volatility exposes industrial producers and consumers to risk. Goods and services cannot be provided in fair price, because of the reliance of these industries on crude oil and oil-related products[2]. The crude oil price volatility also affects derivative markets, because the value
of a commodity is based on a contingent claim affected by the volatility[3].
Gold is a precious metal considered as a commodity and a monetary asset. It is viewed as a source of wealth, a unit of value and medium of exchange[4]. Also, gold is used for investment since it is highly liquid and a valuable metal for
jewelry[5]. Traditionally, gold has been an indicator of future inflation, as a hedge against inflation, an important asset in
portfolio allocation and has shown its role in crises. Central banks and international financial institutions retain a large amount of gold for portfolio diversification, and economic security[6].
Volatility of gold price may further lead to negative consequences for financial markets, because an increase in the gold price volatility leads to an unsafe investment condition. In contrast, lower gold price volatility leads to safe investment condition[7]. Thus, it is essential to learn about gold price volatility for derivative valuation, hedging
decisions, financial markets and the overall economy[8]. An increase in gold volatility is an alert for investors and the
gold mining industry, as it exposes them to risk. So, understanding the gold price volatility enhances the understanding of financial markets[9].
Oil has an important place in the US economy, because volatility in oil price leads to changes in stock prices. In efficient markets, oil and stock prices are contemporaneously correlated. If oil price increases, it would cause decline in the stock price of companies which consume oil in their operation. In efficient markets, changes in oil price would also adjust with lagged changes in stock price[30]. A study by Jones and Kaul[31]for the period of 1947–1991 found that oil
price has no impact on real stock returns. Huang et al.[32]investigated the influence of crude oil prices on stock returns
of the oil companies by applying the VAR model. They observed that oil futures returns and stock returns move in the same direction. Ciner[5] drew attention to the impact of crude oil price on real stock returns, using the non-linear
connection. This study found that variability in the crude oil price affects the stock index returns. Papapetrou[33]studied
multivariate VAR model. The results show that changes in the crude oil price significantly explain changes in the stock returns. Masih et al.[10]reported that volatility of oil price determines real stock returns.
Cai et al.[34] examined the relationship among GDP, inflation and gold price. They argued that GDP and inflation
have a strong impact on volatility of gold price returns. Capie et al.[35] claim that gold is a hedge against foreign
exchange volatility. Baur and McDermott[36]explored the impact of gold price on financial market for 1979–2009. The
finding illustrated that gold acts as a hedge, and a safe haven, in the U.S. and the most European countries. Batten et al.[11] found a significant impact of gold price volatility on the financial market returns. Mensi et al.[16] studied the
correlation and volatility transmission across commodities such as gold and crude oil, and equity market. The results of their study revealed that the changes in S&P500 affect gold and crude oil price volatility. Bhunia[37] studied the
relationship between gold price and stock returns, using Granger test. Bidirectional causality between gold price and stock was observed. Arouri et al.[12]implemented VAR-GARCH model to explore the effect of gold price volatility on
the stock market returns in China for 2004–2011.Their results demonstrated evidence of significant impact of gold price volatility on China’s stock market return.
3. Empirical Design
For estimation, the following basic logarithmic model is specified:
LSPt= α1+ β1LGOLDt+ β2LOILt+ et……(1)
Where, LSP = log of S&P500, LGOLD = log of gold price per troy ounce, LOIL = log of Brent Crude oil price per barrel, e = random error term (white noise) and t = time subscript.
Initially, non-stationarity/stationarity of each time series variable is ascertained. A non-stationary time series has a different mean at different points in time, and its variance increases with the sample size. The feature of non-stationary time series variables is very crucial. Any linear combinations of these time series variables create spurious regression. When this happens, t-values of the coefficients are highly significant, coefficient of determination (R2) is very close to one and the Durbin-Watson (DW) statistic value is very low, which often lead to a high frequency of Type-1 errors[38].
Consequently, the results of the estimated coefficients become biased. Hence, it is necessary to detect the existence of stationarity or non-stationarity in the time series variables in order to avoid the issue of spurious regression. For this, the unit root tests are conducted using the efficient (DF-GLS), and Ng-Perron tests[39]. If a unit root is detected for more
than one variable, the test for co-integration should be used in terms of unrestricted Error Correction Mechanism (ECM).
To analyze possible long-run relationship among stock market return, gold price and crude oil price, traditional co-integration approaches are applied[40,41]. This study invokes a more recent and advanced approach to test whether
long-run relationships among the variables exist. The autoregressive distributive lag (ARDL) bounds testing approach is applied, as developed in Pesaran et al.[42] because of its several advantages. For example, ARDL approach can be
applicable if the variables of interest have ambiguous order of integration i.e. purely I(0), purely I(I)/, I(0) or /I(I) which is not acceptable in the traditional approaches. The above approach provides better results for small sample size and the short-run and long-run parameters simultaneously.
Next step is to compare the calculated F-statistic with critical values which are generated by computer software (EVIEW 9.5). One set assumes that all variables in the model are I(0) and the other set assumes they are all I(1). If the calculated F-statistic exceeds the upper critical bound value, then the Ho of no co-integration is rejected. If the F-statistic falls within the bounds, then the test is inconclusive. Lastly, if the F-statistic falls below the lower critical bound value, there is no co-integration.
∆LSPt = λ0 + i=1n λ1i∆LSPt−i + i=0n λ2i∆LGOLDt−i + ni=0λ3i∆LOILt−i + ψ1LSPt−1 +ψ2LGOLDt−1+ ψ3LOILt−1+
μt …… (2)
For null hypothesis (Ho) of no co-integration, ψ1= ψ2 = ψ3 = 0
For alternative hypothesis, (HA) of co-integration, ψ1 ≠ ψ2 ≠ ψ3≠ 0
Third, a vector error-correction model using the first-differences of the variables is estimated on the evidence of co-integration from equation (2) for the lagged long-run solution, and to determine the speed of adjustment toward long-run equilibrium. A general vector error-correction model relating to basic model (1) following Engle and Granger[40]is specified below:
∆LSPt = θ0 + et−1+ i=1n θ1i∆LSPt−i + i=0n θ2i∆LGOLDt−i + i=0n θ3i∆LOILt−i + μt……(3)
The estimated coefficient (π) of the error-correction term (et−1)is expected to be negative for long-run convergence
and causal flows. If θ1i’s,θ2i’s and θ3i’s are non-zeros, lagged changes in LSP and LGOLD and LOIL lead the
change in current LSP in the short-run. Their relative numerical magnitudes indicate relative influence of the relevant explanatory variable on the dependent variable. The sum of the coefficients of each lagged independent variable shows its net interactive feedback effect with other variables. The optimum lag-lengths are determined by AIC for good fit of the model with minimum loss of information as in Akaike[43]. Finally, following Pesaran and Pesaran[44], CUSUM and
CUSUM-squares tests are applied for parametric stability. Gold price and stock market return data are collected from www.YahooFinance.com. Oil price data are obtained from Energy Information Website.
4. Results
Table 1: Unit Root Tests (DF- GLS and Na- Perron)*
Level Difference
Series DF-GLS NG-PERON DF-GLS NG-PERON
LSP5 1.4071 1.4071 -4.115 -1.8695
LGOLD 0.5594 0.5559 -88. 7941 -44.2855
LOIL -1.6280 -1.4511 -4.5264 -3.8617
*The modified Dicke-Fuller (DF-GLS) critical values are -2.653 and -1.954 at 1% and 5% levels of significance, respectively. The Modified Phillips-Perron (Ng-Perron) critical values are -2.50 and -1.98 at 1% and 5% levels
of significance, respectively.
Both DF- GLS and Ng-Perron efficient unit root tests confirm non-stationarity of all three time series variables in log-levels at 1 and 5 percent significance levels. At the same time, stationarity is restored on first-differencing of the variables in log-levels depicting I (1) behavior. Next, the ARDL bounds testing procedure is implemented. The estimated results are reported as follows:
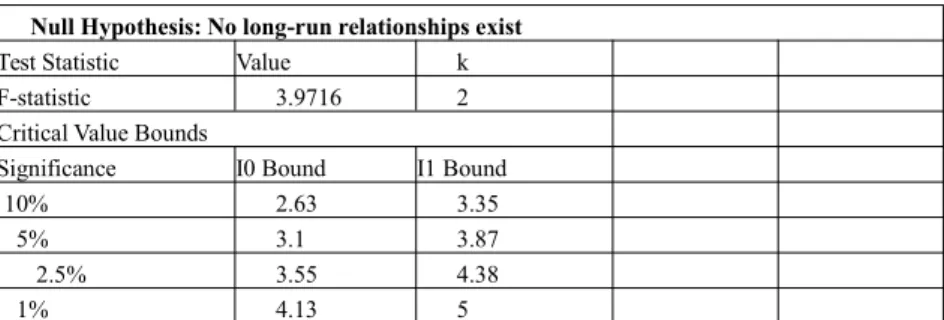
Table 2: ARDL Bounds Test
Null Hypothesis: No long-run relationships exist
Test Statistic Value k
F-statistic 3.9716 2
Critical Value Bounds
Significance I0 Bound I1 Bound
10% 2.63 3.35
5% 3.1 3.87
2.5% 3.55 4.38
1% 4.13 5
The computed F-statistic at 3.9716 exceeds the upper-bound critical F-value providing evidence of co-integration among the variables at 5 percent level of significance.
Table 3: Long-Run Co-efficient (LSP5: Dependent Variable)
Variable Co-efficient Std. Error t-Statistic Prob.
LGOLD 0.693352 1.436894 0.482535 0.6294
LOIL -0.084181 1.269830 -0.066293 0.9471
C 3.693488 5.059610 0.729995 0.4654
The long-run effect of gold on US stock market is positive and that of the oil price is negative. However, each effect is insignificant in terms of the associated respective t-value. In other words, stock, gold and oil markets have subdued long-run causal flows to the US stock market.
Finally, the estimates of the VECM are reported as follows:
Table 4: ARDL Co-integrating And Long Run Form
Dependent Variable: LSP Selected Model: ARDL(4, 1, 0) Co-integrating Form
Variable Co-efficient Std. Error t-Statistic Prob.
∆(LSP5(-1)) -0.041044 0.011683 -3.513258 0.0004
∆(LSP5(-2)) -0.053991 0.011727 -4.604141 0.0000
∆(LSP5(-3)) -0.015579 0.011746 -1.326379 0.1848
∆(LGOLD) -0.030767 0.013606 -2.261265 0.0238
∆(LOIL) -0.004610 0.005470 -0.842829 0.3994
ECT(et−1) -0.000391 0.000117 -3.354977 0.0008
Co-integrating = LSP - (0.6934*LGOLD -0.0842*LOIL + 3.6935 )
The coefficient of the error-correction term has expected negative sign. The associated pseudo t-value of this coefficient is significant. The abysmally low numerical value of the coefficient indicates very tepid adjustment toward long-run equilibrium. Short-run feedback effects of both gold and oil price movements to stock market are negative
4. Conclusions and Implications
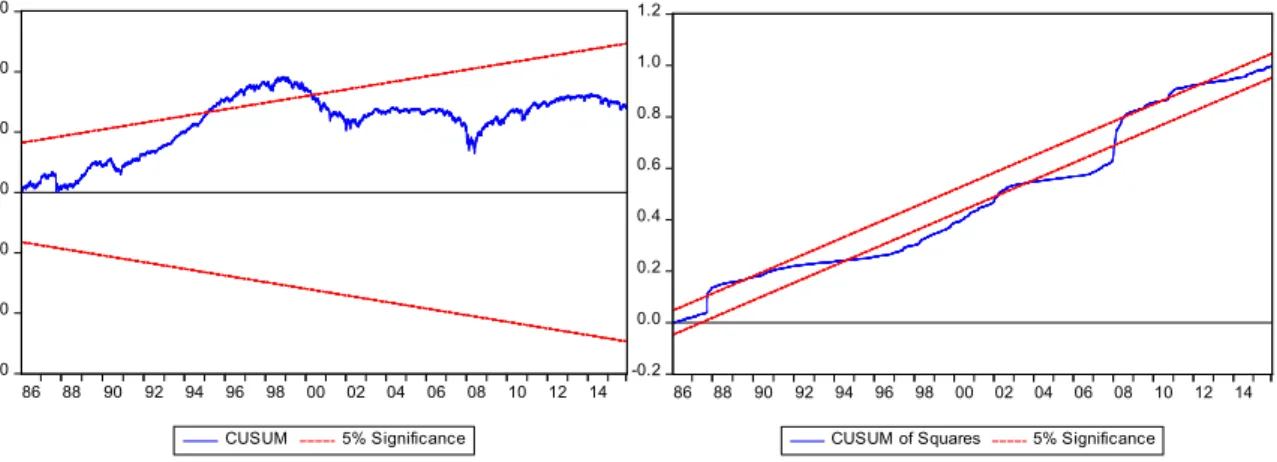
US stock market (proxied by S&P 500) return, gold price and oil price in log-levels are nonstationary. They are also found to converges toward long-run equilibrium with almost negligible speed of adjustment. The short-run interactive feedbacks are negative. For change in gold price, the feedback is statistically significant but it is insignificant for crude oil price. The parameters of the model seem somewhat unstable as unveiled in figures 1 and 2 (Appendix-A) for CUMSUM and CUMSUM-squares, respectively.
-300 -200 -100 0 100 200 300
86 88 90 92 94 96 98 00 02 04 06 08 10 12 14
CUSUM 5% Significance
-0.2 0.0 0.2 0.4 0.6 0.8 1.0 1.2
86 88 90 92 94 96 98 00 02 04 06 08 10 12 14
CUSUM of Squares 5% Significance
The markets for crude oil, common stocks and gold are interconnected in different ways. Their relationships are complex in which exchange rate changes; inflation rate, unemployment rate, economic growth and portfolio investment performance are impacted. So global policy makers, traders and investment advisors should closely monitor the
unfolding developments in all three markets, although change in one market affects the rest. Any abrupt and substantial changes are counterproductive to the US economy and the rest of the world.
References
1. CEbrahim, Z., O.R. Inderwidi, D.A. King. Macroeconomic impacts of oil price volatility: Mitigation and resilience. Frontiers in Energy, 2014, 8(1): 9–24.
2. Pindyck, R. S.. Volatility in natural gas and oil markets. Cambridge, MA: Massachusetts Institute of Technology, 2003. 3. Narayan, P.K., S. Narayan. Modelling oil price volatility. Energy Policy, 2007, 35: 6549–6553.
4. Goodman, B. The Price of Gold and International Liquidity. Journal of Finance, 1956, 11(1): 15–28.
5. Ciner, C. Energy shocks and financial markets: Nonlinear linkages. Studies in Nonlinear Dynamics & Econometrics, 2001, 5: 203–212.
6. Kaufman, T. D., R. A. Winters. The price of gold: A simple model. Resources Policy, 1989, 15: 309–313. 7. Baur, D. G. Asymmetric volatility in the gold market. Journal of alternative investments, 2012, 14: 26–38.
8. Ewing, B. T., F. Malik. Volatility transmission between gold and oil futures under structural breaks. International Review of Economics and Finance, 2013, 25: 113–121.
9. Tully, E., B.M. Lucey. A power GARCH examination of the gold market. Research in International Business and Finance, 2007, 21: 316–325.
10. Masih, R., S., Peters, L. D. Mello. Oil price volatility and stock price fluctuations in an emerging market: Evidence from South Korea. Energy Economics, 2011, 33: 975–986.
11. Batten, J. A., C., Ciner, B.M. Lucey. The macroeconomic determinants of volatility in precious metals markets. Resources Policy, 2010, 35: 65–71.
12. Arouri, M. E., A., Lahiani, D. K. Nguyen. World gold prices and stock returns in china: Insights for hedging and diversification strategies. Economic Modelling, 2015, 44: 273–282.
13. Sharma, G.D., M. Mandeep. Impact of macro-economic variables on stock prices in India. Global Journal of Management and Business Research, 2010, 10(7): 1–18.
14. Dempster, N., J.C. Artigas. Gold: Inflation hedge and long-run determinants of the price of gold. World Gold Council Report, Research Study No. 32, Business School, London, 2010.
15. Levin, E.J., A. Montagnoli, R.E. Wright. Short-run and long-run determinants of the price of gold. World Gold Council Report, Research Study No.32, Business School, London, 2006.
16. Mensi, W., M., Beljid, A., Boubaker, S. Managi. Correlations and volatility spillovers across commodity and stock markets: Linking energies, food, and gold. Economic Modelling, 2013, 32: 15–22.
17. McCown, R.J., J.R. Zimmerman. Is gold a zero-beta asset? Analysis of the investment potential of precious metals. 18. Moore, G.H. Gold prices and a leading index of inflation. Challenge, 1990, 33(4): 52–56.
19. Buyuksalvarci, A. The Effects of macroeconomics variables on stock returns: Evidence from Turkey. European Journal of Social Sciences, 2010, 14: 404–416.
20. Issam, S.A.A., V. Murinde. Exchane rate and stock price interactions in emerging financial markets: Evidence on India, Korea, Pakistan and the Philippines. Applied Financial Economics, 1997, 7(1): 25–35.
21. Muhammed, N., A. Rasheed, H. Fazal. Stock prices and exchange rates: Are they related? Evidence from South Asian Countries, Pakistan Development Review, 2003, 41(4): 535–550.
22. Hammoudeh, S., R. Sari, B.T. Ewing. Relationships among strategic commodities and with financial variables: A new look. Contemporary Economic Policy, 2008, 27(2): 251–264.
23. Sari, R., S., Hammoudeh, U. Soytas. Dynamics of oil price, precious metal prices, and exchange rate. Energy Economics, 2010, 32: 351–362.
24. Soytas, U., R., Sari, S. Hammoudeh, E. Hacihasanoglu. World oil prices, precious metal prices and macroeconomy in Turkey. Energy Policy, 2009, 37: 5557–5566.
25. Melvin, M., J. Sultan. South African political unrest, oil prices, and the time varying risk premium in the gold futures market. Journal of Futures Markets, 1990, 10: 103–111.
26. Hunt, B. Oil price shocks and the U.S. stagflation of the 1970s: Some insights from GEM. Energy Journal, 2006, 27: 61–80. 27. Hooker, M.A. Are oil shocks inflationary? Asymmetric and nonlinear specifications versus changes in regime. Journal of
Money, Credit and Banking, 2002, 34: 540–561.
28. Zhang, Y.J., Y.M. Wei. The crude oil market and the gold market: Evidence for cointegration, causality and price discovery. Resources Policy, 2010, 35: 168–170.
29. Wang, K.M., Y.M. Lee. The yen for gold. Resources Policy, 2011, 36(1): 39–48.
30. Mork, K. A., O. Olsen, H.T. Mysen. Macroeconomic responses to oil price increases and decreases in seven OECD countries. Energy Journal, 1994, 15: 19–35.
31. Jones, C.M., G. Kaul. Oil and the stock markets. Journal of Finance, 1996, 51: 309–313.
32. Huang, R.D., R.W. Masulis, H.R. Stoll. Energy shocks and financial markets. Journal of Futures Markets, 1996, 1: 1–27. 33. Papapetrou, E. Oil price shocks, stock market, economic activity and employment in Greece. Energy Economics, 2001, 23:
511–532.
34. Cai, J., Y.L., Cheung, M.C., Wong. What moves the gold market? Journal of Future Markets, 2011, 21: 257–278.
35. Capie F., T. C., Mills, G. Wood. Gold as a hedge against the dollar. Journal of International Financial Markets, Institutions and Money, 2005, 15: 343–352.
36. Baur, D.G., T.K., McDermott. Is gold a safe haven? International evidence, Journal of Banking and Finance, 2010, 34: 1886–1898.
37. Bhunia, A. Cointegration and casual relationship among crude price, domestic gold price and financial variables: An evidence of BSE and NSE. Journal of Contemporary Issues in Business Research, 2013, 2: 1–10.
38. Granger, C.W.J., P. Newbold. Spurious regressions in econometrics. Journal of Econometrics, 1974, 2: 111–120.
39. Elliot, G., T.J. Rothenberg, J.H. Stock. Efficient tests for an autoregressive unit root. Econometrica, 1996, 64(4): 813–836. 40. Engle, R.F., C.W. J. Granger. Cointegration and error correction representation: Estimation and testing. Econometrica, 1987,
55(2): 521–576.
41. Johansen, S., K. Juselius. Maximum likelihood estimation and inference on cointegration with application to the demand for money. Oxford Bulletin of Economics and Statistics, 1990, 52(2): 169–210.
42. Pesaran, M.H., Y. Shin, R.J. Smith. Bounds testing approaches to the analysis of level relationships. Journal of Applied Econometrics, 2001, 16(3): 289–326.
43. Akaike, H. Fitting autoregression for prediction, annals of the institute of statistical mathematics, 1969, 21: 243–247.
44. Pesaran, M.H., B. Pesaran. Working with microfit 4.0: Interactive econometric analysis. Oxford: Oxford University Press, 1997.