Ecosystems: Components,
Energy Flow, and Matter
Cycling
Key Questions:
What is ecology?
What are the major parts of the earth’s life support systems?
What are the major components of an ecosystem?
What happens to matter and energy in ecosystems?
What are ecosystem services?
Ecology and the levels of
organization of matter
Ecology—Greek oikos meaning house
Study of how organisms interact with one another and their non-living environment (biotic and abiotic components)
Studies connections in nature on the thin life supporting membrane of air, water, and soil Levels of Organization of Matter
Ecosystem Organization
Organisms
Made of cells
Eukaryotic vs Prokaryotic
Species
Groups of organisms that resemble one another in appearance, behavior, and genetic make up
Sexual vs Asexual reproduction
Production of viable offspring in nature 1.5 million named; 10-14 million likely
Populations
Genetic diversity
Communities Ecosystems Biosphere
Fig. 4.2, p. 66 Biosphere
Biosphere
Ecosystems
Communities
Populations
Earth’s Life Support Systems
Troposphere
To 11 miles Air is here
Stratosphere
11 to 30 miles Ozone layer
Hydrosphere
Solid, liquid, and gaseous water
Lithosphere
Crust and upper mantle
Contains non-renewable res.
Atmosphere
Vegetation and animals Soil Rock Biosphere Crust core Mantle Lithosphere Crust Lithosphere
(crust, top of upper mantle)
Hydrosphere
(water)
Atmosphere
(air)
Biosphere
(Living and dead organisms)
Crust
Sustaining Life on Earth…
One way flow of high quality
energy
The cycling of matter (the
earth is a closed system)
Gravity
Causes
downward movement of matter
Biosphere
Carbon
cycle Phosphoruscycle Nitrogencycle Watercycle Oxygencycle
Heat in the environment
Major Ecosystem Components
Abiotic
Components
Water, air, temperature, soil, light levels, precipitation, salinity Sets tolerance limits for populations and communitiesLimiting Factors on Land & in H
2O
Terrestrial
SunlightTemperature Precipitation Soil nutrients Fire frequency Wind
Latitude Altitude
Aquatic/Marine
Light penetration• Water clarity
Water currents
Dissolved nutrient concentrations
• Esp. N, P, Fe
Dissolved Oxygen concentration
The Source of High Quality Energy
Energy of sun lights and warms the planet Supports photosyn. Powers the cycling of matter Drives climate and weather that distribute heat and H2O
Solar
radiation Energy in = Energy out
Reflected by atmosphere (34%) UV radiation Absorbed by ozone Absorbed by the earth
Visible light Lower Stratosphere (ozone layer) Troposphere Heat Greenhouse effect Radiated by atmosphere as heat (66%)
Earth
Fate of Solar Energy…
Earth gets 1/billionth of sun’s output of nrg 34% is reflected away by atmosphere
66% is absorbed by chemicals in atm = re-radiated into space
Visible light, Infrared radiation (heat), and a small amount of UV not absorbed by ozone reaches the atmosphere
Energy warms troposphere and land
Evaporates water and cycles it along with gravity Generates winds
A tiny fraction is captured by photosynthesizing organisms
Primary Productivity
The conversion of light energy to chemical
energy is called “gross primary production.” Plants use the energy captured in
photosynthesis for maintenance and growth.
Primary Productivity
NPP=GPP-respiration rate
GPP= RATE at which producers convert solar energy into chemical energy as biomass
Rate at which producers use photosynthesis to fix inorganic carbon into the organic carbon of their tissues
These producers must use some of the total biomass they produce for their own respiration
NPP= Rate at which energy for use by consumers is stored in new biomass (available to consumers)
Units Kcal/m2/yr or g/m2/yr
How do you measure it? AP Lab Site
What are the most productive
Ecosystems?
Estuaries Swamps and marshes Tropical rain forest Temperate forest Northern coniferous forest (taiga) Savanna Agricultural land Woodland and shrubland Temperate grassland Lakes and streams Continental shelf Open ocean Tundra (arctic and alpine) Desert scrub Extreme desert
800 1,600 2,400 3,200 4,000 4,800 5,600 6,400 7,200 8,000 8,800 9,600
Fate of Primary Productivity and
Some important questions…
Since producers are ultimate source of all food, why shouldn’t we just harvest the plants of the world’s marshes?
Why don’t we clear cut tropical rainforests to grow crops for humans?
Why not harvest primary producers of the world’s vast oceans?
Vitousek et al: Humans now use, waste, or destroy about 27% of earth’s total
Biotic Components of Ecosystems
Heat Heat Heat Heat Heat Abiotic chemicals (carbon dioxide, oxygen, nitrogen, minerals) Producers (plants) Decomposers (bacteria, fungus) Consumers (herbivores, carnivores) Solar energy Producers (autotrophs)Source of all food
Photosynthesis
Consumers=heterotroph Aerobic respiration
Anaerobic respiration
Methane, H2S
Decomposers
Matter recyclers…
Trophic
Levels
Each organism in an ecosystem is assigned to a feeding (or Trophic) level
Primary Producers
Primary Consumers (herbivores) Secondary Consumer (carnivores) Tertiary Consumers
Omnivores
Detritus feeders and scavengers
Directly consume tiny fragments of dead stuff
Decomposers
Digest complex organic chemicals into inorganic nutrients that are used by producers
Detritivores vs Decomposers stop
Fig. 4.15, p. 75 Mushroo
m Wood
reduced to powder Long-horned
beetle holes
Bark beetle engraving
Carpenter ant galleries
Termite and carpenter
ant work
Dry rot fungus
Detritus feeders Decomposers
Energy Flow and Matter Cycling in Ecosystems…
Food Chains vs. Food Webs
KEY: There is little if no matter waste
in natural ecosystems!
Heat Heat Heat Heat
Heat
Heat
Heat First Trophic
Level
Second Trophic Level
Third Trophic Level
Fourth Trophic Level
Solar energy
Producers
(plants) consumersPrimary (herbivores) Tertiary consumers (top carnivores) Secondary consumers (carnivores) Detritvores
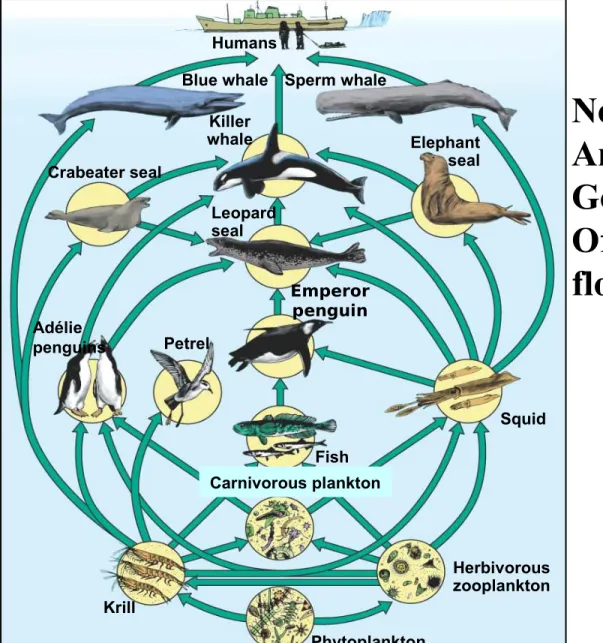
Generalized Food Web of the Antarctic
Fig. 4.18, p. 77
Humans
Blue whale Sperm whale
Crabeater seal
Killer
whale Elephant seal Leopard
seal
Adélie
penguins Petrel
Fish
Squid
Carnivorous plankton
Krill
Phytoplankton
Herbivorous zooplankton
Emperor penguin
Note: Arrows
Go in direction Of energy
Food Webs and the Laws of matter and energy
Food chains/webs show how matter and energy move from one organism to another through an ecosystem
Each trophic level contains a certain amount of biomass (dry weight of all organic matter)
Chemical energy stored in biomass is transferred from one trophic level to the next
With each trophic transfer, some usable energy is degraded and lost to the environment as low quality heat
• Thus, only a small portion of what is eaten and digested is
actually converted into an organisms’ bodily material or biomass (WHAT LAW ACCOUNTS FOR THIS?)
Ecological Efficiency:
The % of usable nrg transferred as biomass from one trophic level to the next (ranges from 5-20% in most ecosystems, use 10% as a rule of thumb)
Pyramids of Energy and Matter
Pyramid of Energy Flow
Pyramid of Biomass
Heat Heat Heat Heat Heat 10 100 1,000 10,000 Usable energy Available at Each tropic level
Implications of Pyramids….
Why could the earth support more people if the eat at lower trophic levels?
Why are food chains and webs rarely more than four or five trophic levels?
Why do marine food webs have greater ecological efficiency and therefore more trophic levels than terrestrial ones?
Why are there so few top level carnivores? Why are these species usually the first to
Ecosystem Services and Sustainability
Solar Capital Air resources and purification Climatecontrol Recyclingvital
chemicals Renewable energy resources Nonrenewable energy resources Nonrenewable mineral resources Potentially renewable matter resources Biodiversity and gene pool Natural pest and disease control Waste removal and detoxification Soil formation and renewal Water resources and purification Natural Capital
1. Use Renewable Solar Energy As Energy Source 2. Recycle the chemical nutrients needed for life Lessons
Matter Cycles
You are responsible for knowing the
water, carbon, nitrogen, sulfur, and
phosphorus cycles
Know major sources and sinks
Know major flows
HYDROLOGIC CYCLE
Slide 34 Slide 34 Slide 34
Figure 4-28 Page 76 Precipitation to
land Transpirationfrom plants Runoff Surface runoff
(rapid)
Evaporation
from land Evaporation
from ocean Precipitation to ocean
Ocean storage Surface
runoff (rapid) Groundwater movement (slow)
Rain clouds Condensation Transpiration
Evaporation
Precipitation Precipitation
HUMAN IMPACTS TO WATER
CYCLE
1. Water withdrawal from streams, lakes andgroundwater. (salt water intrusion and groundwater depletion)
2. Clear vegetation from land for agriculture, mining, road and building construction. (nonpoint source runoff carrying pollutants and reduced recharge of groundwater)
3. Degrade water quality by adding nutrients(NO2, NO3, PO4) and destroying wetlands (natural filters).
MARINE CARBON CYCLE
Slide 35 Slide 35 Slide 35
Diffusion between atmosphere and ocean
Carbon dioxide dissolved in ocean water
Marine food webs
Producers, consumers, decomposers, detritivores
Marine sediments, including formations with fossil fuels
Combustion of fossil fuels
incorporation
into sediments sedimentationdeath, geologic timeuplifting over
sedimentation photosynthesis aerobic
respiration
TERRESTRIAL CARBON
CYCLE
Slide 36 Slide 36 Slide 36 photosynthesis aerobic respiration Terrestrial rocks Soil water (dissolved carbon)Land food webs producers, consumers, decomposers,
detritivores
Atmosphere
(most carbon is in carbon dioxide)
Peat, fossil fuels combustion of wood (for
clearing land; or for fuel
sedimentation volcanic action
death, burial, compaction over geologic time
PHOTOSYNTHESIS
Photosynthesis: occurs within the chloroplasts of green plants. The photosynthetic membranes are arranged in flattened sacs called the thylakoids.
6CO2 + 12H2O C6H12O6 + 6O2 + 6H2O light
(reactants) (products)
CELLULAR RESPIRATION
Cellular Respiration occurs in light simultaneously with photosynthesis. It occurs in the cytoplasm and
mitochondria.
It is the reverse reaction of photosynthesis.
Function = chemical energy release
C6H12O6 + 6O2 + 6H2O 6CO2 + 12H2O+ chemical energy
HUMAN IMPACTS TO
CARBON CYCLE
1. Forest and brush removal has left less vegetation to absorb CO2 through
photosynthesis.
2. Burning fossil fuels and wood produces CO2 (greenhouse gas) that flows into the
troposphere. Trapping of CO2 in atmosphere enhances natural greenhouse effect and may contribute to climate changes that would
disrupt global food production, wildlife
IMPORTANCE OF CARBON
CYCLE
NITROGEN CYCLE
Slide 39 Slide 39 Slide 39
NO3 – in soil Nitrogen
Fixation
by industry for agriculture
Fertilizers
Food Webs On Land
NH3, NH4+ in soil
1. Nitrification
bacteria convert NH4+ to nitrate (NO2–)
loss by leaching uptake by autotrophs excretion, death, decomposition uptake by autotrophs Nitrogen Fixation
bacteria convert N2to
ammonia (NH3) ; this dissolves to form ammonium
(NH4+)
loss by leaching
Ammonification
bacteria, fungi convert the residues to NH3, this dissolves to form NH4+
2. Nitrification
bacteria convert NO2-to nitrate (NO3-)
Denitrification
by bacteria
Nitrogenous Wastes, Remains In Soil
Gaseous Nitrogen (N2) in Atmosphere
NO2– in soil
NITROGEN CYCLE
MAJOR STEPS IN NITROGEN CYCLE1. Nitrogen fixation by cyanobacteria or
Rhizobium bacter.
2. Ammonification by decomposers and/or
nitrogen fixing bacteria.\
3. Nitrification by bacteria (NO2 [toxic to
plants]to NO3 [useable by plants]).
4. Assimilation (used by plants) OR
Denitrification by anaerobic bacteria in
HUMAN IMPACTS ON
NITROGEN CYCLE
1. WORLD War II, German chemist Fritz Haber developed the Haber Process and won the Nobel Prize. He developed
Commercial inorganic fertilizer in the laboratory. This was to solve global famine problems!
N2 + 3H2 2NH3
HUMAN IMPACTS ON
NITROGEN CYCLE CONT.
N
2O gas is released into the atmosphere
by anaerobic bacteria on livestock
wastes and commercial fertilizers
applied to the soil. These act as
greenhouse gases and when N
2O
HUMAN IMPACTS ON
NITROGEN CYCLE
Remove nitrogen from Earth’s crust when we mine for nitrogen-containing minerals for fertilizers
(ammonium nitrate (NH4NO3).
Deplete nitrogen from topsoil by harvesting nitrogen-rich crops (soybeans, alfalfa).
Leach water-soluble NO3 ions from soil through irrigation.
Remove nitrogen from topsoil when we burn
HUMAN IMPACTS ON
NITROGEN CYCLE CONT.
Cultural Eutrophication – adding of
excess nutrients of NO2, NO3, and PO4,
from agricultural runoff (fertilizer and
Slide 40 Slide 40 Slide 40
Figure 4-32 Page 81
1920 1940 1960 1980 2000
G lo b a l n it ro g en ( N ) fi xa ti o n (t ri lli o n g ra m s) 0 50 100 150 200 Year
IMPORTANCE OF NITROGEN
CYCLE
Organisms use nitrogen to make vital organic
compounds such as amino acids, proteins, DNA, and RNA.
In both terrestrial and aquatic ecosystems, nitrogen is typically in short supply and limits the rate of
PHOSPHOROUS CYCLE
Slide 41 Slide 41 Slide 41 GUANO FERTILIZER ROCKS LAND FOOD WEBS DISSOLVED IN OCEAN WATER MARINE FOOD WEBS MARINE SEDIMENTS weathering agriculture uptake by autotrophs death, decompositionsedimentation settling out weathering
leaching, runoff DISSOLVED IN
HUMAN IMPACTS TO
PHOSPHOROUS CYCLE
1. Humans mine LARGE quantities of phosphate rock to use in commercial fertilizers and detergents. Phosphorous is NOT found as a gas, only as a solid in the earth’s crust. It takes millions to hundreds of millions of years to replenish.
2. Phosphorous is held in the tissue of the trees and vegetation, not in the soil and as we deforest the land, we remove the ability for phosphorous to replenish globally in ecosystems. 3. Cultural eutrophication – ad excess phosphate to aquatic
IMPORTANCE OF
PHOSPHOROUS CYCLE
1.Phosphorous is an essential nutrient of both plants and animals.
2. It is part of DNA molecules which carry genetic information.
3. It is part of ATP and ADP) that store chemical energy for use by organisms in cellular respiration. 4. Forms phospholipids in cell membranes of
plants and animal cells.
SULFUR CYCLE
Slide 42 Slide 42 Slide 42 Figure 4-34 Page 83 Sulfur Hydrogen sulfide Sulfate salts PlantsAcidic fog and precipitation Ammonium sulfate Animals Decaying matter Metallic sulfide deposits Ocean Dimethyl sulfide
Sulfur dioxide Hydrogen sulfide
Sulfur trioxide Water Sulfuric acid Ammonia Oxygen
Volcano
HUMAN IMPACTS TO SULFUR
CYCLE
Approximately 1/3 of all sulfur emitted into atmosphere comes from human activities. 1. Burning sulfur containing coal and oil to produce electric power (SOx = acid
deposition).
2. Refining petroleum – (SOx emissions)
IMPORTANCE OF SULFUR
CYCLE
1. Sulfur is a component of most proteins and some vitamins. 2. Sulfate ions (SO4 2- ) dissolved in water are common in
plant tissue. They are part of sulfur-containing amino acids that are the building blocks for proteins.
3. Sulfur bonds give the three dimensional structure of amino acids.