Amar Oedit∗ Rawi Ramautar Thomas Hankemeier Petrus W. Lindenburg
Division of Analytical Biosciences, Leiden Academic Center for Drug Research, Leiden University, Leiden, the
Netherlands
Received November 19, 2015 Revised January 6, 2016 Accepted January 31, 2016
Review
Electroextraction and electromembrane
extraction: Advances in hyphenation
to analytical techniques
Electroextraction (EE) and electromembrane extraction (EME) are sample preparation tech-niques that both require an electric field that is applied over a liquid-liquid system, which enables the migration of charged analytes. Furthermore, both techniques are often used to pre-concentrate analytes prior to analysis. In this review an overview is provided of the body of literature spanning April 2012–November 2015 concerning EE and EME, focused on hyphenation to analytical techniques. First, the theoretical aspects of concentration enhancement in EE and EME are discussed to explain extraction recovery and enrichment factor. Next, overviews are provided of the techniques based on their hyphenation to LC, GC, CE, and direct detection. These overviews cover the compounds and matrices, exper-imental aspects (i.e. donor volume, acceptor volume, extraction time, extraction voltage, and separation time) and the analytical aspects (i.e. limit of detection, enrichment factor, and extraction recovery). Techniques that were either hyphenated online to analytical tech-niques or show high potential with respect to online hyphenation are highlighted. Finally, the potential future directions of EE and EME are discussed.
Keywords:
Bioanalytical applications / Electroextraction / Electromembrane extraction /
Hyphenation / Sample preparation DOI 10.1002/elps.201500530
1 Introduction
In the field of analytical chemistry, sample pretreatment is often needed in order to enable the selective and sensitive analysis of compounds in complex samples. Commonly ap-plied sample pretreatment techniques are solid-phase extrac-tion (SPE), liquid–liquid extracextrac-tion (LLE), and protein precip-itation [1]. Recently, various miniaturized electromigration-based extraction techniques have been introduced that offer low solvent consumption, simple extraction procedures, and the ability to deal with small sample volumes [2]. Analyte ex-traction is not based on passive diffusion, as in conventional extraction techniques, but on active electric field-enhanced transport. This increases the extraction speed and allows exhaustive extraction to take place, thereby making elec-tric field-assisted extraction techniques promising for high-throughput analysis and for the analysis of low-abundant an-alytes.
Electromembrane extraction (EME) and electroextraction (EE) are based on immiscible liquid–liquid systems compris-ing organic and aqueous phases. Analytes are electroextracted and concentrated from a donor phase, often via a filter phase, into an acceptor phase. Due to the fact that the electrophoretic
Correspondence: Dr. Petrus W. Lindenburg, Division of Analyt-ical Biosciences, Leiden Academic Center for Drug Research (LACDR), Leiden University, P.O. Box 9502, 2300 RA Leiden, The Netherlands
E-mail: [email protected]
velocity of the ions is proportional to the electric field, extrac-tion speed is enhanced in the organic (filter or donor) phase a high electric field strength is present there. High analyte con-centration factors can be achieved, because of the fact that the acceptor phase is small in volume when compared to the donor phase.
In EME, the liquid–liquid system typically comprises donor and acceptor phases that are both aqueous and are separated by a membrane of which the pores contain an or-ganic filter phase, i.e. a supported liquid membrane (SLM). EME was first demonstrated in 2006 by Pedersen-Bjergaard
et al.[3] and has so far primarily been used for drug analysis studies [4, 5].
In EE, no membranes are used and the donor phase is typically comprised of an organic solvent and the accep-tor phase is comprised of an aqueous solution. EE was first described by Stichlmairet al.as a modified liquid–liquid ex-traction technology in an industrial setting [6]. It was ap-plied for analytical purposes in 1994 by Van der Vliset al.[7] and for bioanalysis by Lindenburg et al.in 2010 [8]. Until now, EE has been mainly applied to analysis of peptides and metabolites.
∗Additional corresponding author: Amar Oedit
E-mail: [email protected]
This paper is dedicated to our late colleague Shanna Shi (1978-2012)
Colour Online: See the article online to view Figs. 1, 4 and 5 in colour.
C
2016 The Authors ELECTROPHORESIS Published by WILEY-VCH Verlag GmbH & Co. KGaA, Weinheim www.electrophoresis-journal.com
In 2013, Raterinket al.[9] and shortly thereafter Kub´a ˇn
et al.[10, 11] reported on a system comprised of three liquid phases, i.e. aqueous donor and acceptor phase separated by a layer of organic solvent acting as a filter. Raterinket al.
denoted this system as ‘three-phase EE’ and Kub´a ˇn et al.
‘EME across free liquid membranes’, but in essence both systems utilize the same extraction principle.
A PubMed – NCBI query to with either ‘electromembrane extraction’ or ‘electroextraction’ in the title that appeared be-tween April 2012 and November 2015 resulted in 95 papers, underlining that research in this area is quite active.
A variety of instrumental setups for electrophoretic sam-ple pretreatment have been developed, which were reviewed by Lindenburg et al. These setups were deemed highly promising for metabolomics and peptidomics. However, the authors noted that commercial electrophoretic sample pre-treatment setups were required in order for electrophoretic sample pretreatment to become routinely used [2]. Krishna Marothuet al.discussed the setups and experimental proce-dures, innovations, and applications of EME [5]. Seipet al.
explored the optimal experimental EME conditions for vari-ous bioanalytical applications and discussed recent advances in the use of EME for bioanalysis. The review also dis-cussed challenges with EME, such as matrix interference during EME, difficulties with the extraction of acidic and polar compounds and the lack of commercial setups [4]. Seipet al.mathematically described mass transport in EME by creating a theoretical model of the process [12]. Huang
et al. summarized the recent efforts that were made to gain understanding of mass transport taking place during EME [13].
Until now, aspects such as (online) hyphenation of EE and EME to analytical separation and/or detection techniques have not been considered in detail. Therefore, in this re-view, the hyphenation of EE and EME to three major sep-aration techniques is discussed, i.e. LC, GC, and CE, as well as the hyphenation to direct detection. Special emphasis is placed on online hyphenation of EE and EME to the afomentioned separation and detection techniques. In this re-view, an overview is presented of the EE and EME systems that permit concentration of analytes, which can only be achieved when the acceptor phase volume is smaller than the donor phase volume. In order to provide the reader with a proper comparison, only studies that report LOD values are included. In this context, the presence of information on parameters, such as extraction recovery and enrichment factor, was also used as inclusion criteria. In Section 2, the-oretical aspects, more details are provided concerning the relevant analytical parameters, i.e. extraction recovery and en-richment factor. These parameters are not always combined, but can provide useful insights in the process efficiency of EE and EME, as is discussed in the Section 3 regarding hy-phenation. The review is concluded with a critical discus-sion on the challenges and requirements of online hyphen-ation of EME and EE to analytical separhyphen-ation and detection techniques.
2 Theoretical aspects
Theoretical aspects concerning the concentrative ability of EME have often been reported in literature. We have included these aspects in order to provide a framework for the next sections.
The obtained enrichment factor (EF) of analytei(EFi) is based on the ratio of the analyte concentrations in the acceptor and donor phase, i.e.
EFi=
Cacce ptori
Cdonori
(1)
When the measured concentration is within the linear response of the detector, the detector signal can be used to calculate EFi.
The maximum attainable EF (EFmax), i.e. when all ana-lyte molecules are extracted from the donor into the acceptor phase, is based on the volume ratio of the donor and acceptor phase:
EFmax=
Vdonor
Vacce ptor
(2)
From this equation, it can be derived that in order to be able to concentrate analytes, an EME or EE system should encompass a larger donor phase volume than acceptor phase volume. For example, EME across free liquid membrane as reported by Kub´a ˇn & Bocek [10,11,14] utilizes equal volumes of donor and acceptor phase and thus has no concentrating power. A similar technique, three-phase EE, utilizes a much smaller acceptor phase volume in comparison to the donor phase and thus was able to concentrate analytes [9].
The extraction recovery (ER) of analytei(ERi) is based on the ratio between EFi and the maximum attainable EF (EFmax), expressed as a percentage:
ERi=
EFi
EFmax ×
100% (3)
When Equation 1–3 are combined, the extraction recov-ery of analyteican be written as:
ERi=
Cacce ptori × Vacce ptor
Cdonori × Vdonor
× 100% (4)
and thus, combining Equation 1 and 4
ERi=EFi ×Vacce ptor
Vdonor
× 100% (5)
It is important to have information about both ERiand EFi. When a very large donor volume is used, a large EFi can be achieved even though ERiis low. Thus, in order to be able to assess the extraction performance correctly, either ERior EFiin combination with Vdonorand Vacceptorshould be reported in the paper. In the case that ERior EFiis missing, it can easily be calculated using Eq. 5.
concentrating analytes and were considered as relevant for this review due to their innovative character.
3 Hyphenation of EME and EE: an
overview
Thus far, the majority of the reported EME and EE work was coupled offline to separation and/or detection techniques. In these cases, the extracts are collected after the experiment, transferred to a sample vial and introduced into an analytical system. However, there are several examples where EME and EE are fully integrated into the analytical system and sample extraction takes place in conjunction with consecutive anal-ysis. In the next sections, we discuss progress of online hy-phenation and steps taken towards online hyhy-phenation using LC, GC, CE, and direct detection, respectively.
3.1 Hyphenation to LC
Table 1 provides a detailed overview of the work in which EME and EE have been combined with LC. A total of 29 studies have been included of which two were coupled online to LC, which are highlighted in this section. In the majority of the EE-LC and EME-LC work optical detection techniques were used, such as UV (17) or fluorescence (2) detection. Furthermore, several instances of MS detection (12) were reported. Certain applications reported combinations and have not been as-signed separately. In order to make a comparison between the different techniques, the reported detection limits were con-verted to nM, which was also done for the articles discussed in the remainder of the review. Analyses performed with LC-MS and both LC-UV both typically yielded sub-nM to×102nM detection limits, which is surprising, as MS is generally con-sidered more sensitive than UV detection. One EME-LC-UV method [20] managed to achieve remarkably low sub-nM de-tection limits using UV. The majority of the EME and EE work was applied to drug compounds or relatively hydrophobic compounds, such as aromatic amino acids [21], azo red dyes [22], herbicides [23], and volatile organic compound metabo-lites [24, 25]. Notable exceptions are the EME of inorganic anions [26], pulsed mode EME of histidine, phenylalanine, tryptophan [21], and asparagine and glutamine [27]. Not all papers included in the table reported both ER and EF. EFs and ERs listed initalicswere calculated using Eq. 5. The highest EFs were achieved using EE, which was applied to extract pep-tides from plasma [28] and EE, which was applied to extract acylcarnitines from urine [29]. These high EFs were achieved by having nearly exhaustive extraction for selected target com-pounds combined with the fact that the donor volume was 1000 times larger than the acceptor volume. The EE flow cell developed by Schoonenet al.[30] showed demonstrated near exhaustive extraction for target analytes except for lau-roylcarnitine, which is likely caused by solubility issues. The largest achievable EF in the cited works was in studies that made use of a 24 mL donor phase [31-33] in combination with
acceptor phases of 10–25L. According to Eq. 2, very high EFs of up to 2400 can theoretically be achieved with this system. However, since the extractions were not exhaustive, with ERs typically below 15%, moderate EFs were obtained as follows from Eq. 5. Recently, it was demonstrated that pH changes due to electrolysis affecting the acceptor phase during EME play an important role in the ability of an extraction to be ex-haustive. Furthermore, by choosing an acceptor phase with a stronger buffering capacity, the ERs that can be achieved are strongly enhanced [34]. This can be explained by the fact that the analytes maintain their charge in the acceptor phase for a longer duration due to reduced effects of electrolysis of the acceptor phase. A potential downside of this approach is that the sample might not be suitable for injection into an analytical system due to the high/low pH value or the salt content becomes too high when the sample is neutralized prior to injection. The extraction times for all techniques were in the range of 5 min to 20 min, with exception of the chip-based EME setups, where the optimized extraction times were
⬎33 min [35] and 25 min [23]. It is important to note that the flow rate and the donor volume play a critical role in the ex-traction times of chip-based setups. A chip-based setup for the EME of chlorinated phenoxyacetic acids [23] was faster, despite having a donor volume that was five times higher than the EME chip for basic drugs [35]. The parallel EME setup [36] had the highest throughput, despite taking 8 min for the EME procedure. The achieved high throughput is a consequence of the extractions taking place in parallel. The system with the fastest total analysis time reported the ex-traction of drugs from whole blood [37], taking 5 min for EME and 5.5 min for separation. The range of voltages ap-plied span several orders of magnitude, from 1.5 V [38] to 300 V [39] for EME and 300 V [30] to 15 kV [28, 29] for EE. The 1.5 V for EME [38] was chosen due to the fact that the extrac-tion took place over an ionic liquid-based membrane, which typically has a lower resistance than commonly used SLM solvents. This results in higher currents and necessitates the use of a low extraction voltage in order to avoid effects of elec-trolysis and Joule heating. EE usually takes place from a thick organic phase, often ethyl acetate, into an aqueous phase. Be-cause of this, higher voltages can be applied during EE than in EME, where the organic phase, which is located inside the SLMs, is typically thin. When hyphenating EE and EME to LC, care should be taken that the acceptor phase is suited for injection onto the LC column. In all the LC-related work that is within the scope of this review, the acceptor phase is of aqueous nature, which explains the fact that reversed phase LC is almost exclusively used in combination with EE and EME, one exception being ion chromatography for the anal-ysis of inorganic anions [26]. Furthermore, this might also explain the fact that the application area of EME-LC currently mainly covers medium-apolar to apolar compounds, such as peptides and drugs.
Ta b le 1 . Continued Ref. Tech. Hyph. Det. Matrix Compounds * LOD E F E R Vdonor Vacceptor ET ST EV (nM) (%) (mL) ( L) (min) (min) (V) [64] EME o ffline U V A cademic 2.1 30 5 n.r. 20 diclofenac 5.1 59 84.3 [34] EME o ffline U V U rine nortriptyline, amitryptiline 11-14 17-18 34-36 1 20 33.3 15 40 [65] EME o ffline U V U rine nortryptiline, amitryptiline 1.9-3.6 89-94 11.6-12.5 30 40 20 12 100 Plasma amitryptiline, nortryptiline 1.8-1.9 83–92 11.1-12.3 [20] EME o ffline 10 30 15 15 50 UV Academic fluoroquinolones ** 0.039-0.22 40-85 12-26 FLD Academic fluoroquinolones *** 0.014-0.10 40-85 12-26 [66] EME o ffline A cademic 10 50 7 12 10 UV basic drugs # 0.17-6.6 51-86 26-43 FLD naproxen, salicylic acid, ibuprofen 0.0026-3.5 [26] EME o ffline C D A cademic chloride, nitrate, fluoride, nitrite, bromide, sulfate, phosphate 17-79 67-117 40-70 53 0 10 14 15 [38] EME + LPME offline UV/MS P lasma ketoprofen, ibuprofen, citaprolam, sertraline 0.79-6.2 3.8-5.7 63-95 0.6 100 15 6.1
(UV) 17(MS)
Figure 1. (A) Experimental setup of the developed EME-LC-MS system (B) EME-LC-MS results of CPAs spiked to river water (extrac-tion voltage 200 V, donor phase flow rate 0.2 mL/min). (a) 5 mL of 0.5 ng/mL CPAs (b) 10 mL of 0.25 ng/mL CPAs and (c) 25 mL of
0.1 ng/mL CPAs. Note that for each experiment the total amount of CPAs was the same. 4-CPA=chlorophenoxyacetic acid; 3,4-D=
3,4-dichlorophenoxyacetic acid; 2,4-D=2,4-dichlorophenoxyacetic acid; 2,4,5-T=trichlorophenoxyacetic acid. Adapted from [23].
Figure 2. (A) Valve setup for interfacing large volume cEE with LC. (a) inlet capillary, (b) EE capillary, (c) sample loop, (d) outlet capillary, (e) LC waste, (f) LC pump tubing, (g) tubing to earth, (h) tubing to LC-MS. Step 1: situation after all phases have been loaded. The grey zone in the EE-capillary depicts the organic phase with analytes. Before EE starts, the valve is switched. Step 2: situation after EE is finished; the small black zone depicts the concentrated analytes. Step 3: situation after the sample has been transferred into the sample loop by applying pressure. After sample transfer, the valve is switched back. Step 4: situation where the sample zone is being injected
into the LC-MS system. (B)comparison of chromatograms obtained from LC (0.1L injection) and large volume cEE-LC-MS (100L
extraction volume). The initial peptide concentration was equal and ERs. Adapted from [28].
EME system to the LC system should be prevented in order to avoid possibly damaging the equipment and to prevent endangering the operator.
See & Hauser reported on an automated system for EME coupled online with LC-MS [23]. In this work a previously developed polymer inclusion membrane (PIM) was used [40, 41]. This PIM consisted of cellulose triacetate as base poly-mer, tris(2-ethylhexyl)phosphate as plasticizer and varying amounts of Aliquat 336 as cationic carrier.
were varied while the total amount of chlorinated phenoxy-acetic acid herbicides (CPAs) that were led through the ex-traction cell were kept constant. This led to similar chro-matograms (Fig. 1B), this indicates exhaustive extraction took place regardless of the concentration. The LODs that were obtained (using 5 mL donor phase) with this system for CPAs were 0.12–0.43 nM and EFs of 201–235 were reported. Furthermore, the repeatability was good; when the CPAs were spiked to river water samples the rela-tive standard deviations were in the range of 4.8–5.5%. The (nearly) exhaustive extraction of samples as large as 25 mL was successfully demonstrated, suggesting that very high EFs and thus very low LODs can be achieved. How-ever, this comes at the cost of unfavorably long extraction times.
Lindenburget al.coupled EE online to reversed-phase LC-MS via a 2-way 10-port switching valve for the determina-tion of peptides spiked to plasma [28]. EE took place in a large bore (1 mm inner diameter) PEEK capillary. A schematic dia-gram of this setup is shown in Fig. 2A. First, the injection of the donor and acceptor phases, application of the electric field and transfer to the sample loop of the switching valve, were performed using a CE apparatus. Next, the loop was switched and the extracted analytes were injected onto the separation column using an LC-MS system. The entire system, i.e. CE instrument, switching valve and LC-MS equipment, was au-tomated and could extract and analyze a series of samples without human interference. The organic donor phase vol-ume was 100L of ethyl acetate containing the sample ions and 1.8% (v/v) trifluoroacetic acid, the extraction voltage was 15 kV and the extraction time 6 min. LODs of 10–50 nM were obtained, and EFs of 570–990, corresponding to ERs of 57– 99%. Figure 2B shows a comparison between EE-LC-MS and conventional LC-MS.
The aforementioned method was successfully applied to the analysis of acylcarnitines in urine [29], resulting in esti-mated LODs of 1.4–390 nM and EFs of 175–970, correspond-ing to ERs of 17.5–97%. The polarity of the acylcarnitines, which is mainly a result of the acyl chain, was observed to be of major influence on extraction performance (with a bias to the more apolar acylcarnitines in the test mixture).
3.2 Hyphenation to GC
Table 2 shows detailed information on the works that com-bined EME with GC. Five EME procedures were analyzed by GC-FID, while two were analyzed by GC-MS. Generally EME-GC was applied to tricyclic anti-depressants [16, 42-44], once to opioids [45] and once to pyridine derivates [46]. Detection limits in general were in the low nM range. The extraction times ranged between 14 and 20 min, with voltages rang-ing from 50 to 240 V and separation times between 5 and 25 min.
The number of reported EME-GC applications is lower than the combination of EME and LC. This is due to the fact that EME typically takes place from an aqueous donor into
an aqueous acceptor. However, when combined with GC only one EME work made use of an aqueous acceptor phase, which was subsequently directly injected into the GC system. Sev-eral precautions were taken in order to make this possible, such as keeping the injection volume low, preventing the wa-ter from condensing on the column and selecting appropriate column [44]. However, despite these complications, this sys-tem had the fastest total analysis time. It took 25 min from extraction to completion of the GC analysis. The other works made use of organic injection solvents by applying EME di-rectly into a solid support, i.e. solid-phase microextraction (SPME) [15, 16], into an organic phase [43, 45] or by applying dispersive liquid-liquid microextraction (DLLME) after the EME procedure [42, 46]. In general, polar groups need to be derivatized prior to GC analysis in order to increase the vapor pressure of the analytes. Only one technique [15] included derivatization, which was performed after EME into a solid pencil support.
The largest EFs were achieved with EME-DLLME of drugs from urine followed by GC-MS analysis [42]. As already men-tioned in the LC section, the highest EFs can be obtained where the difference between donor and acceptor volume is the largest. However, the EF cannot be deduced from EME-SPME, as the analytes adsorb to a solid sorbent. The combi-nation of EME-SPME and EME-DLLME typically had a low reported recovery. This is due to the fact that the reported recoveries are not the recoveries of EME alone, but recov-eries from the combination of EME and SPME or DLLME. Two-phase EME and regular EME show satisfactory recovery values (⬎70%). It is important to note that in order to properly assess the total analysis time when combining EME with GC that the duration of the SPME, DLLME and derivatization pro-cedures need to be taken into account. These analysis times were⬎10 min for the EME-DLLME of pyridine derivates [46],
⬎3 min for the EME-DLLME of tricyclic anti-depressants [42] and⬎2 min for the thermal desorption and derivatization during EME-SPME [15, 16].
Until now, EME has not been coupled online to GC, but important steps have been taken towards achieving online hy-phenation. For example, an EME system called ‘electromem-brane surrounded solid phase microextraction’ bridges the gap between EME and GC considerably [16]. Here, the an-alytes were extracted from an aqueous donor phase, via an organic supported liquid membrane, into an aqueous accep-tor phase in which the analytes were adsorbed to a solid sorbent, i.e. a pencil lead, that acted as the cathode. After EME, the pencil lead was inserted into a GC injector for ther-mal desorption of the analytes and consecutive analysis. The method was applied to analysis of doxepin and amitriptyline in urine (LOD 3.6 nM for both) and plasma (LOD 18 and 9 nM, respectively); reported ERs (covering both EME and SPME) were in the range 3–10%. In the work performed by Razazadehet al.[15], EME-SPME was applied to the anal-ysis of acidic herbicides in plant material, with LODs of 2.2–25 nM and ERs (including SPME) of 0.6–4.8%.
Ta
b
le
2
.
Overview
of
EME
h
yphenated
to
G
C.
EF
and
E
R
values
indicated
in
italic
are
c
alculated
b
ased
on
data
pro
v
ided
in
the
p
aper
Ref.
Tech.
Hyph.
Det.
Matrix
Compounds
*
LOD
E
F
E
R
Vdonor Vacceptor
ET
ST
EV
(nM)
(%)
(ML)
(
L)
(min)
(min)
(V)
[42]
EME
o
ffline
FID
2.1
7
20
5
200
Plasma
imipramine,
clopramine
1.7-2.5
215-250
72
Urine
1.4-2.4
240-265
81
[45]
EME-DLLME
o
ffline
FID
Urine
quinoline,
2,4-lutidine,
3-methylpyridine, 4-dimethylaminopyridine
1.9-16
40-202
1.7-8.4
24
10
20
10
50
[15]
EME-SPME
o
ffline
FID
Plant
tissue
2,4-dichlorophenoxyacetic
acid,
2-methyl-4-chlorophenoxyacetic acid
2.3-25
n.a.
0.6-4.8
24
n
.a.
20
12
50
[16]
EME-SPME
o
ffline
FID
Urine
doxepin,
amitriptyline
3.6
n.a.
4.0-10.4
24
n
.a.
20
8
120
Plasma
amitriptyline,
doxepin
9.0-18
n
.a.
5.9-3.1
[44]
Two-phase
E
ME
offline
FID
Academic
methadone,
alfentanil,
sufentanil
1.9-3.6
353-476
70.5-95.2
3
6
20
12.5
80
[16]
EME-SPME
o
ffline
FID
24
n.a.
20
8
120
Urine
doxepin,
amitriptyline
3.6
n.a.
4.0-10.4
Plasma
amitriptyline,
doxepin
9.0-18
n
.a.
5.9-3.1
[43]
Two-phase
E
ME
offline
MS
imipramine,
citaprolam,
sertraline,
desipramine
1.2
6
15
25
60
Academic
0.36-0.75
140-175
70-87
Urine
n
.r.
145
73
[46]
EME-DLLME
o
ffline
M
S
24
10
14
10
240
Urine
doxepin,
amitriptyline,
trimipramine
11-51
753-781
31.3-32.5
Plasma
trimipramine,
doxepin,
amitriptyline
10-54
383-397
16.0-16.5
1matrix
is
only
m
entioned
w
hen
extraction
p
erformance
is
tested
therein.
*in
o
rder
of
increasing
L
were made, i.e. two-phase EME [43, 45]. This allowed for di-rect injection of the extracted analytes into a GC system. In both cases the EME setup consisted of a sample vial contain-ing the donor phase in which one electrode is immersed and a hollow SLM fiber containing the acceptor phase in which the other electrode is immersed. Using a magnetic stirrer, the donor solvent was agitated during EME to enhance ex-traction. After extraction, the acceptor solution was collected and injected directly into a GC system. FID was used in case of optimization experiments and MS in case of analytical characterization.
The authors tested several organic solvents as acceptor solvent and found that 1-heptanol yielded the highest ERs for tricyclic anti-depressants [43]. A requisite of the solvent is that it has some electric conductance, which draws par-allels to EE. The pH of the donor solution, extraction volt-age, stirring speed and extraction time were optimized and a comparison with conventional (three-phase) EME was made. Two-phase EME was shown to have an interday repeatability in the range of 6.2–10.8% while intraday repeatability was in the range of 6.0–11.8%, indicating robust analytical perfor-mance. Two-phase EME was found to be faster than three-phase EME (15 versus 20 min extraction time), while the EF and LOD were somewhat lower, i.e. 145 versus 280 and 0.1 ng/mL versus 0.8 ng/mL respectively. However, this com-parison does not take into account differences in volume ra-tios of donor and acceptor phase that affect both EF and ER (Eq. 5). There is an important difference in the electric field distribution in conventional (three-phase) EME and two-phase EME, which could account for the shorter extraction time in two-phase EME. In the two-phase EME setup, the ma-jority of the electric field is applied over the acceptor phase, which has the highest resistance, which could indicate slow extraction and low recovery. However, the ER of some selected test compounds (imipramine, desipramine, sertraline and citalopram) after 15 min of EME with 1-heptanol as organic phase was surprisingly high:±70–87%. Interesting to note is that further improvements have been made by performing two-phase EME in pulsed mode and in combination with a surfactant to enhance mass transport across the SLM [45]. Here the acceptor phase consisted of octanol instead of 1-heptanol and the donor phase contained 0.02% (w/v) sodium dodecyl sulfate. By performing the EME in pulsed mode with the aforementioned surfactant, the recoveries increased com-pared to conventional two-phase EME from 48.3–68.5% to 70.5–95.2%.
In our opinion, the fact that analytes were successfully extracted from an aqueous donor phase into an organic donor phase, which is opposite to all other EE and EME work, is important. This is because it not only opens up possibilities for online hyphenation of EME to GC, but also to normal phase LC and HILIC. As the donor and acceptor solvent are immiscible and present in sufficient volumes, the membrane could perhaps be abandoned, which might result in a simpler EE system.
3.3 Hyphenation to CE
Since CE, EE, and EME are all based on electromigration, combinations of CE with one of the two is a logical and attractive option. However, no reports of EE coupled with CE have been reported within the timeframe of this review. Table 3 shows that the combination of EME with CE has been reported in the literature various times. In all cases, a com-bination of EME and capillary zone electrophoresis was re-ported. However, in the aforementioned EE of acylcarnitines in urine [29], the primary employed separation technique was LC, but the offline combination with CE was briefly explored and found to be promising: extracts from urine obtained by EE were analyzed with a CE-MS system and it was shown that metabolites from various important classes, such as amino acids and acylcarnitines could be measured in these extracts. As can be observed in Table 3, UV detection has been reported nine times in combination with EME-CE. MS de-tection in combination with EME-CE has not been reported, despite the sensitivity and selectivity it offers. Capacitively coupled contactless conductivity detection (C4D) is reported three times. C4D has two advantages for usage in combina-tion with EME, (i) integracombina-tion into a CE system is relatively simple and (ii) detection of all charged species is possible, including those that cannot be detected with optical detec-tion methods [47]. As CE is more suited than reversed phase LC for separation of hydrophilic and charged analytes, some EME applications to amino acids [48], polyamines [49] and polar herbicides [40] were combined with CE. The reported LODs were generally in the low nM range, regardless of the use of C4D or UV as detection method. It is interesting to note that some applications had low ERs, but still had fa-vorable, low nM to M LODs, such as EME performed at constant current [48] and nano-EME [50]. The low LODs with nano-EME that were obtained, despite the ERs⬍1%, were achieved due to the fact that the potential EF would be 25 000 times on the basis of exhaustive extraction. Nearly exhaustive extractions were obtained when using carbon nanotubes in SLMs [51, 52], with ERs of⬎90% and EFs of⬎180. Extraction times ranged from 2 to 32 min and separation times between 4 and 25 min. The fastest EME and separation procedure us-ing CE takes 9 min to complete. Voltages ranged between 4 and 1500 V. In case of the 1500 V potential, as was applied in a polymer inclusion membrane (PIM) EME flow cell [40], electrolysis issues were resolved by placing the electrode in the donor channel at the outlet, which caused bubbles to be flushed away and prevented them from intervening with the extraction process.
Ta b le 3 . Overview of EME h yphenated to C E. EF and E R values indicated in italic are c alculated b ased on data pro v ided in the p aper Ref. Tech. Hyph. Det. Matrix Compounds * LOD E F E R Vdonor Vacceptor ET ST EV (nM) (%) (mL) ( L) (min) (min) (V) [50] EME online U V U rine loperamide, methadone, haloperidol, nortryptiline, pethidine 0.41-60 25-196 0.10-0.79 0.2 0.008 2 25 200 [48] EME o ffline U V U rine drugs and amino acids ** 2.1-2500 0.35-39 0.20-21.7 3.5 20 5 4 ± 4/ ± 40 [69] EME o ffline U V S -and R-propranolol 4 20 32 19 40 Urine 27 132-134 66-67 Plasma 39 108-110 54-55 [70] EME o ffline U V 4 20 20 7 125 Hair methadone, ephedrine, methamphetamine 9.8-41 116-140 56-64 Urine m ethadone, methamphetamine, ephedrine 4.9-18 112-128 58-70 [71] EME o ffline U V U rine thebaine, ibuprofen 23-24 150-160 75-80 4 20 25 10 40 [52] EME o ffline U V 4 20 101 45 Acedemic naproxen, ibuprofen 4.3-7.3 180-188 90-94 Plasma n.r. 138-154 69-77 Waste water n .r. 180-184 90-92 Breast m ilk n.r. 148-156 74-78 Urine n .r. 170-176 85-88 [51] EME o ffline U V U rine buprenorfine 2.1 185 92 4 20 15 10 200 [72] EME o ffline U V 4 20 152 01 5 Academic naproxen, diclofenac 6.56-8.17 176-184 88-92 Urine d iclofenac, naproxen 15.3-15.8 164–176 82–88 Plasma diclofenac, naproxen 19.7-20.5 158–166 79–83 [73] EME o ffline U V
and 4CD
Environmental water chlorinated phenoxyacetic acids *** 39 6.8-11 15-25 0.9 20 5 10 150 [49] EME o ffline C 4D S aliva spermine, spermidine, cadaverine, putrescine 8.4-79 17 -106 1.9-12 7 8 20 22 10 [74] EME o ffline C 4D P lasma
3,4-methylenedioxy-metamphetamine, amphetamine, metamphetamine
Figure 3. (A) Instrumentation used for nano-EME (B) urine analysis by CE-UV, comparing (a) blank urine without nano-EME, (b) spiked urine without nano-EME and (c) spiked urine with nano-EME, applying 200 V for only 15 s. Peak assignment: 1 pethidine, 2 nortriptyline, 3 methadone, 4 haloperidol, 5 loperamide. Adapted from [50].
corresponding to volumes of up to 20 to 30 nL, unless stack-ing procedures are used. The low loadability of CE can be considered a limiting factor in achieving low LODs; this is where online coupling of EE and EME to CE can be highly advantageous.
Ramos-Pay´an et al. [50] fully integrated EME in a CE separation capillary. This integration resulted in an EME-CE capillary that could be used as many as 200 times, before it needed to be replaced. These 200 runs took place in a period of two months in which water samples and urine samples were analyzed. This EME mode was aptly named ‘nano-EME’, as the acceptor volume consisted of a minute amount of 8 nL phosphate buffer. The nano-EME setup was realized with a cracked fused silica capillary, which was surrounded by an SLM (Fig. 3A). With this setup, pethidine, nortriptyline, methadone, haloperidol, and loperamide were extracted from urine, separated by CE and detected with UV. The sample volume was 200L, the membrane solvent was nitrophenyl octyl ether, the extraction time 120 s and the extraction voltage 200 V. EFs were 25–196, but the ERs were low (⬍1%). This could be a benefit when the setup is applied to study reaction kinetics, as oversampling would disturb the kinetics. Impor-tantly, the authors developed a electromigration-based SLM cleaning procedure by submerging the SLM for 2 min in 10 mM HCl while applying 200 V and simultaneously flushing the capillary with separation buffer. This cleansing extraction procedure eliminated carry-over in the system. Furthermore, the relative standard deviations were less than 15% when this cleansing extraction procedure was applied and it ensured that one EME-CE capillary could be used 200 times. The au-thors also show highly promising urine analysis results in which several spiked drugs were significantly enhanced by rapid 15 s extractions (Fig. 3B). No between-capillary repeata-bility was reported. However, the authors indicated that a more robust nano-EME design should be created.
For the analysis of low-abundant analytes in biological samples the low recovery does not pose a limitation (the ob-tained LODs were 0.41–60 nM). Nonetheless, online coupling of EME-CE to a more sensitive detector, such as LIF or MS seems attractive for the analysis of low-abundant compounds.
3.4 Hyphenation to direct detection
Ta b le 4 . Overview of EME h yphenated to d irect d etection Ref. Tech. Hyph. Det. Matrix Compounds * LOD E F E R Vdonor Vacceptor ET ST EV (nM) (%) (mL) ( L) (min) (min) (V) [17] EME online M S R at liver microsomes amitriptyline, promethazine, imipramine *** 29 n.r. n.r. 1 flowing variable n.a. 2.5 [18] EME online M S R at liver microsomes Amitriptyline 140 n.r. 83 1 flowing variable n .a. 15 [9] Three-phase E E online M S P lasma acylcarnitines ** 90-330 2 -7 8.0-28 0.05 2 9 n.a. 140 [19] EME online M S R at liver microsomes amitriptyline, promethazine, methadone *** n.r. n.r. n.r. flowing flowing variable n .a. 200 [55] EME o ffline E D U rine Morphine 5.3 152 76 4 20 24 n .a. 90 [53] EME o ffline FLD Seawater Uranium 0.42 64.1-88.1 51.8-70.5 2.5 20 14 n.a. 80 [75] EME-SPME o ffline M S A cademic mefenamic acid, ibuprofen 0.17-0.24 n.r. n.r. 3 n .a. 24 n .a. 80 [54] EME o ffline U V W aste water Thorium 1.2 50 10 10 20 30 n.a. 90 1matrix is only m entioned w hen extraction p erformance is tested therein. *in o rder of increasing L OD. **propion yl-, octanoyl-, butyryl-, decanoyl-and h exanoylcarnitine. ***and their metabolites.
of 3L/min and an acceptor volume of 1 mL. Aside from the monitoring applications, the extraction times were in the range of 9 and 30 min. For the online applications this time was very close to the total analysis time.
A major complication in MS is ion suppression of an-alytes by co-occurring sample components, such as salts, buffer molecules and proteins [56]. EE and EME enable selec-tive extraction of analyte molecules while leaving salts, buffer components and proteins behind, this in turn enables direct targeted MS analysis.
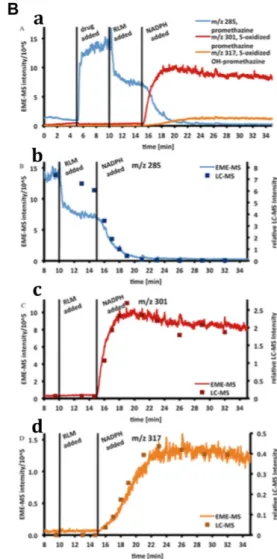
As mentioned, in the past few years, several EME de-vices have been developed that allow for direct monitoring of drug metabolism [17-19]. In these studies, the main ob-jective was not to achieve the highest ERs and lowest LODs, but to couple EME online to MS and to apply it to study drug metabolism in real time. One such application is a mi-crofluidic EME chip that can be coupled online to MS and allows for monitoring of metabolism of amitriptyline by rat liver microsomes in an easily accessible open reservoir [18]. The chip consisted of two polymethyl methacrylate (PMMA) plates with channels on each plate. A polypropylene SLM con-sisting of porous polypropylene with nitrophenyl octyl ether immobilized in its pores was located between the two plates, which separated the donor and acceptor channels. A plat-inum wire electrode was inserted in the sample channel, in order to close the electric circuit. Furthermore, this electrode prevented the SLM from blocking the channel upon appli-cation of negative pressure at the outlet. The EME chip was connected to a temperature-controlled reaction chamber, in which amitriptyline was metabolized by rat liver microsomes. With a syringe pump, the reaction mixture was transferred to the sample channel, where amitriptyline and its metabo-lites were extracted by EME. Another syringe pump trans-ferred the acceptor solvent containing the extracted analytes towards an ion trap MS. The response time of the system, i.e. the time until the detector responded to a change in the sample, was rapid at 9 s. The EME recovery of amitriptyline from a standard solution was 83% at 5L/min sample flow, which was determined using a sample loop. The authors thor-oughly investigated ion suppression and showed that salts, proteins and buffer components were not extracted. Dugstad
Figure 4. (A) Schematic drawing of the dip-in flow-flow EME probe. (B) comparison of metabolic profiles of promethazine obtained with EME-MS and LC-MS. a) overlay of extracted ion chromatograms of promethazine (b) and its two main metabolites, S-oxide promethazine
(c) and S-oxide OH-promethazine (d). NADPH was added to the reaction mixture to initiate metabolism. RLM=rat liver microsome.
Adapted from [19].
(10L/min) flushed through the chamber while EME took place (extraction voltage 200 V). Finally, the acceptor phase of EME, which was flowing as well during the extraction (10L/min), was flushed to a triple quadrupole MS to detect the analytes in selected ion monitoring mode. The setup was used to study metabolism kinetics of amitriptyline, promet-hazine and methadone. Figure 4B shows extracted ion chro-matograms of the products of promethazine metabolism by rat liver microsomes into its two major metabolites S-oxide promethazine and S-oxide OH-promethazine. It would be interesting to know the associated LODs of this innovative approach, but these are not reported. The performance of EME-MS was shown to be consistent with LC-MS. Thus EME could provide a valuable alternative to LC, offering analysis speed and efficient removal of ion suppressing compounds, especially when the analysis of a limited number of analytes is to be measured.
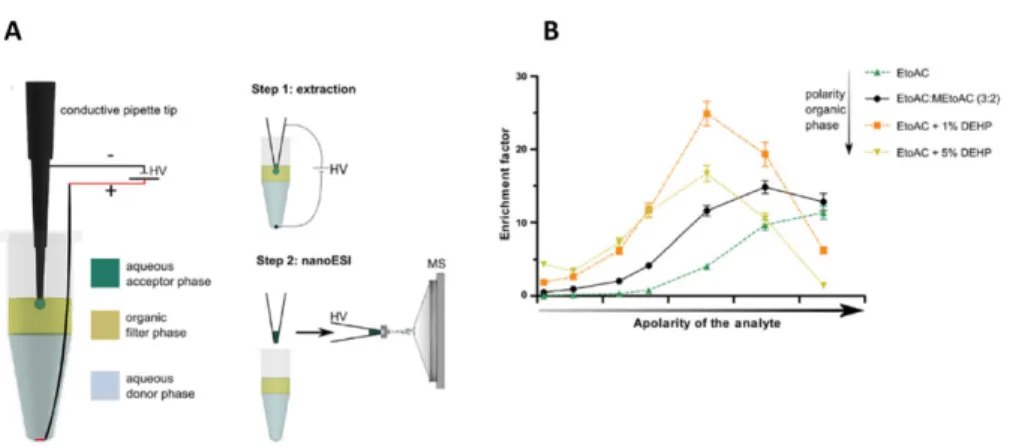
Figure 5. (A) setup of three-phase EE (left) and its coupling to nanoESI-DI-MS (right). (B) influence of the organic filter composition on
ana-lyte enrichment factor. EtoAc=ethyl
acetate, MetoAc = methyl acetate,
DEHP=bis(2-ethylhexyl)phosphate.
Adapted from [9].
can be tuned by altering the organic filter phase compo-sition. Furthermore, the authors demonstrated analysis of acylcarnitines spiked to protein rich samples and plasma with relative standard deviations below 15%. In plasma, endogenous acylcarnitines were detected and LODs were 90–330 nM. Clean mass spectra were obtained, implying effective protein removal and a multitude of endogenous metabolites were detected in plasma. Lastly, the ability of automating the approach using an automated nano-ESI robot and a modified 96-wells plate was explored. As be-ing capable of automatically performbe-ing EE and nano-ESI would make the approach highly suitable for high-throughput metabolomics studies.
4 Concluding remarks and future
perspectives
In this review, we presented a detailed overview of concen-tration enrichment studies performed by EE and EME in the period between April 2012 and November 2015. Specifically, we made a comparison between various approaches and the combination with separation techniques and direct detection. In this comparison, the importance of looking at the combi-nation of EF and ER was emphasized, as EF alone does not yield sufficient information on the extraction efficiency. Not all papers reported on all crucial parameters, i.e. ER, EF, ac-ceptor and/or donor phase volume and LOD, which made it difficult to put the techniques into perspective and to compare the various approaches. Therefore, we propose that at mini-mum the aforementioned crucial parameters are reported in EE and EME research, in order to provide results that can be compared to other methodologies.
Several papers were highlighted that demonstrated the online hyphenation of EE and EME to analytical separation and/or detection techniques or in which important steps were taken towards achieving online hyphenation. MS is often the detection method of choice, as it offers unmatched selectiv-ity and high sensitivselectiv-ity. However, due to the concentration power of EME sub-nM LODs could also be obtained with UV detection. Online hyphenation of EME with LC was achieved
by coupling an EME flow cell to a channel selection valve. The advantage of this flow cell based setup is its ability to extract large donor phase volumes without compromising the high ER. The other EE and EME flow cell designs covered in this review also have a similarly high potential for online hyphen-ation to LC. The nano-EME technique was also coupled online to CE and has an advantage over conventional hydrodynamic injection, as the analytes are concentrated directly within the minute volume of the separation capillary and thereby the loadability of CE is enhanced. Though far from exhaustive, this type of extraction can still be of added value for moni-toring reaction kinetics. Most online monimoni-toring of reaction kinetics using EME took place via direct detection, often MS was the detector of choice. Whether via flow cell designs or probes, EME was able to extract drug metabolites generated by rat liver microsomes. The focus here was not so much on the concentration enrichment, but on the removal of compo-nents that could result in ion suppression. The EME probe setup was modified to make use of both flowing donor and acceptor phases, which prevented perturbations in the reac-tion kinetics. Another technique, three-phase EE, was briefly evaluated for online hyphenation to MS analysis and showed promising results for high throughput metabolomics.
Last, the two-phase EME method shows a high potential for automated online coupling to GC, as the acceptor solvents are suited for direct injection into a GC column and the man-ual removal of the acceptor phase by the injection syringe could be automated. The two-phase extraction without the use of an SLM, as it is identical to the acceptor phase solvent, might warrant investigation. The two-phase EME technique could also be used in conjunction with normal phase LC and HILIC due to the nature of its (organic) acceptor phase solvents.
successfully developed chip-based EE and EME approaches which show excellent potential for incorporation into LOC systems, such as the EE and EME flow cells [23, 30, 35]. These setups make use of low voltages and low flows, which matches the scales that are used on LOC systems. Another EME system that demonstrates scalability with LOC systems is nano-EME, which uses low volumes and voltages. Fur-thermore, using nano-EME very short extraction times can be sufficient to concentrate analytes [50], which implies that it is promising for high-throughput screening of drug com-pounds on in vitro cell cultures in microfluidic LOC systems. The current focus of EME is often on hydrophobic drug compounds. There are promising examples of EE and EME of hydrophilic compounds, but their number is limited. Im-proved knowledge of EME processes have enhanced the ex-traction process of these hydrophilic compounds as described recently [4], but the extractions are often not exhaustive. Fur-ther research into expanding the target range of EE and EME analysis to more hydrophilic compounds makes the extrac-tion of many endogenous compounds, such as metabolites, feasible.
Overall, we conclude that EME and EE are highly promis-ing electromigration-based sample pretreatment techniques with excellent prospects for online hyphenation to analytical separation and detection techniques. In the resulting sys-tems efficient sample cleanup and analyte enrichment are integrated with high performance separation and selective, sensitive detection.
This review was made possible by the European Union CAM-PaC project, Seventh Framework Programme (FP7/2007-2013) under grant agreement 602783.
The authors have declared no conflict of interest.
5 References
[1] Soltani, S., Jouyban, A.,Bioanalysis2014,6, 1691–1710.
[2] Lindenburg, P. W., Ramautar, R., Hankemeier, T.,
Bioanal-ysis2013,5, 2785–2801.
[3] Pedersen-Bjergaard, S., Rasmussen, K. E., J.
Chro-matogr. A2006,1109, 183–190.
[4] Seip, K. F., Gjelstad, A., Pedersen-Bjergaard, S.,
Bioanal-ysis2015,7, 463–480.
[5] Krishna Marothu, V., Gorrepati, M., Vusa, R., J.
Chro-matographic Sci.2013,51, 619–631.
[6] Stichlmair, J., Schmidt, J., Proplesch, R., Chem.
Engi-neer. Sci.1992,47, 3015–3022.
[7] Van der Vlis, E., Mazereeuw, M., Tjaden, U., Irth, H., Van
der Greef, J.,J. Chromatogr. A1994,687, 333–341.
[8] Lindenburg, P. W., Seitzinger, R., Tempels, F., Tjaden,
U. R., van der Greef, J., Hankemeier, T.,
Electrophore-sis2010,31, 3903–3912.
[9] Raterink, R. J., Lindenburg, P. W., Vreeken, R. J.,
Hankemeier, T.,Analyt. Chem.2013,85, 7762–7768.
[10] Kuban, P., Bocek, P.,Analyt. Chim. Acta2014,848, 43–50.
[11] Kuban, P., Bocek, P.,J. Chromatogr. A2014,1346, 25–33.
[12] Seip, K. F., Jensen, H., Sonsteby, M. H., Gjelstad,
A., Pedersen-Bjergaard, S., Electrophoresis 2013, 34,
792–799.
[13] Huang, C., Jensen, H., Seip, K. F., Gjelstad, A.,
Pedersen-Bjergaard, S.,J. Separation Sci.2016,39, 188–197.
[14] Kuban, P., Bocek, P.,J. Chromatogr. A2014,1337, 32–39.
[15] Rezazadeh, M., Yamini, Y., Seidi, S., Tahmasebi, E.,
Rezaei, F., J. Agricultural Food Chem. 2014, 62,
3134–3142.
[16] Rezazadeh, M., Yamini, Y., Seidi, S., Ebrahimpour, B.,J.
Chromatogr. A2013,1280, 16–22.
[17] Dugstad, H. B., Petersen, N. J., Jensen, H.,
Gabel-Jensen, C., Hansen, S. H., Pedersen-Bjergaard, S.,
An-alyt. Bioanal. Chem.2014,406, 421–429.
[18] Petersen, N. J., Pedersen, J. S., Poulsen, N. N., Jensen, H., Skonberg, C., Hansen, S. H., Pedersen-Bjergaard, S., Analyst2012,137, 3321–3327.
[19] Fuchs, D., Jensen, H., Pedersen-Bjergaard, S.,
Gabel-Jensen, C., Hansen, S. H., Petersen, N. J.,Analyt. Chem.
2015,87, 5774–5781.
[20] Ramos-Payan, M., Villar-Navarro, M., Fernandez-Torres,
R., Callejon-Mochon, M., Bello-Lopez, M. A., Analyt.
Bioanal. Chem.2013,405, 2575–2584.
[21] Rezazadeh, M., Yamini, Y., Seidi, S., Esrafili, A.,Analyt.
Chim. Acta2013,773, 52–59.
[22] Nojavan, S., Tahmasebi, Z., Bidarmanesh, T., Behdad, H.,
Nasiri-Aghdam, M., Mansori, S., Pourahadi, A.,J.
Sepa-ration Sci.2013,36, 3256–3263.
[23] See, H. H., Hauser, P. C., Analyt. Chem. 2014, 86,
8665–8670.
[24] Suh, J. H., Eom, H. Y., Kim, U., Kim, J., Cho, H.-D., Kang,
W., Han, S. B.,J. Chromatogr. A2015,1416, 1–9.
[25] Suh, J. H., Lee, H. Y., Kim, U., Eom, H. Y., Kim, J., Cho, H.
D., Han, S. B.,J. Separation Sci.2015,38, 4276–4285.
[26] Nojavan, S., Bidarmanesh, T., Memarzadeh, F., Chalavi, S.,Electrophoresis2014,35, 2446–2453.
[27] Rezazadeh, M., Yamini, Y., Seidi, S., Aghaei, A.,Talanta
2015,136, 190–197.
[28] Lindenburg, P. W., Tempels, F. W., Tjaden, U. R., van der
Greef, J., Hankemeier, T.,J. Chromatogr. A2012,1249,
17–24.
[29] Lindenburg, P. W., Tjaden, U. R., van der Greef, J.,
Hankemeier, T.,Electrophoresis2012,33, 2987–2995.
[30] Schoonen, J.-W., van Duinen, V., Oedit, A., Vulto, P.,
Hankemeier, T., Lindenburg, P. W.,Analyt. Chem.2014,
86, 8048–8056.
[31] Rezazadeh, M., Yamini, Y., Seidi, S., Esrafili, A.,J.
Chro-matogr. A2012,1262, 214–218.
[32] Seidi, S., Yamini, Y., Rezazadeh, M., Esrafili, A.,J.
Chro-matogr. A2012,1243, 6–13.
[33] Arjomandi-Behzad, L., Yamini, Y., Rezazadeh, M.,Analyt.
Biochem.2013,438, 136–143.
[34] ˇSlampov ´a, A., Kub ´a ˇn, P., Bo ˇcek, P.,Analyt. Chim. Acta
2015,887, 92–100.
[35] Asl, Y. A., Yamini, Y., Seidi, S., Ebrahimpour, B.,Analyt.
[36] Eibak, L. E., Parmer, M. P., Rasmussen, K. E.,
Pedersen-Bjergaard, S., Gjelstad, A., Analyt. Bioanalyt. Chem.
2014,406, 431–440.
[37] Jamt, R. E., Gjelstad, A., Eibak, L. E., Oiestad, E. L., Christophersen, A. S., Rasmussen, K. E.,
Pedersen-Bjergaard, S.,J. Chromatogr. A2012,1232, 27–36.
[38] Sun, J. N., Chen, J., Shi, Y. P.,J. Chromatogr. A2014,
1352, 1–7.
[39] Huang, C., Seip, K. F., Gjelstad, A., Shen, X.,
Pedersen-Bjergaard, S.,Analyt. Chem.2015,87, 6951–6957.
[40] See, H. H., Stratz, S., Hauser, P. C.,J. Chromatogr. A2013,
1300, 79–84.
[41] See, H. H., Hauser, P. C., Analyt. Chem. 2011, 83,
7507–7513.
[42] Seidi, S., Yamini, Y., Rezazadeh, M.,J. Chromatogr. B
2013,913–914, 138–146.
[43] Davarani, S. S., Morteza-Najarian, A., Nojavan, S.,
Poura-hadi, A., Abbassi, M. B.,J. Separation Sci. 2013, 36,
736–743.
[44] Davarani, S. S., Najarian, A. M., Nojavan, S., Tabatabaei,
M. A.,Analyt. Chim. Acta2012,725, 51–56.
[45] Zahedi, P., Davarani, S. S. H., Moazami, H. R., Nojavan, S.,J. Pharmaceut. Biomed. Analysis2016,117, 485–491.
[46] Arjomandi-Behzad, L., Yamini, Y., Rezazadeh, M.,Talanta
2014,126, 73–81.
[47] Kub ´a ˇn, P., Hauser, P. C., Electrophoresis 2009, 30,
176–188.
[48] Slampova, A., Kuban, P., Bocek, P., J. Chromatogr. A
2012,1234, 32–37.
[49] Liu, Y., Zhang, X., Guo, L., Zhang, Y., Li, Z., Wang, Z.,
Huang, M., Yang, C., Ye, J., Chu, Q.,Talanta2014,128,
386–392.
[50] Payan, M. D., Li, B., Petersen, N. J., Jensen, H., Hansen,
S. H., Pedersen-Bjergaard, S.,Analyt. Chim. Acta2013,
785, 60–66.
[51] Hasheminasab, K. S., Fakhari, A. R.,Analyt. Chim. Acta
2013,767, 75–80.
[52] Hasheminasab, K. S., Fakhari, A. R., Shahsavani, A.,
Ah-mar, H.,J. Chromatogr. A2013,1285, 1–6.
[53] Davarani, S. S., Moazami, H. R., Keshtkar, A. R.,
Ban-itaba, M. H., Nojavan, S.,Analyt. Chim. Acta2013,783,
74–79.
[54] Khajeh, M., Pedersen-Bjergaard, S., Barkhordar,
A., Bohlooli, M., Spectrochim. Acta A 2015, 137,
328–332.
[55] Ahmar, H., Tabani, H., Hossein Koruni, M., Davarani,
S. S., Fakhari, A. R., Biosens. Bioelectron. 2014, 54,
189–194.
[56] Raterink, R.-J., Lindenburg, P. W., Vreeken, R. J.,
Ramau-tar, R., Hankemeier, T.,TrAC Trends Analyt. Chem.2014,
61, 157–167.
[57] Eibak, L. E., Hegge, A. B., Rasmussen, K. E.,
Pedersen-Bjergaard, S., Gjelstad, A., Analyt. Chem. 2012, 84,
8783–8789.
[58] Oedit, A., Vulto, P., Ramautar, R., Lindenburg, P. W.,
Han-kemeier, T.,Curr. Opin. Biotechnol.2015,31, 79–85.
[59] van Duinen, V., Trietsch, S. J., Joore, J., Vulto, P.,