Strangeness at Intermediate Baryon Density
DavidTlusty1,
1Physics&AstronomyDepartment,RiceUniversity,HoustonTX,USA
Abstract.
Exploration of the QCD phase diagram has been one of the main programs of contempo-rary nuclear physics. The intermediate baryon density region covers a broad range of the baryon chemical potential, between 100 and 700 MeV, and is expected to include a possi-ble critial point at the end of a phase equilibrium curve between the hadron gas and quark gluon plasma phases. Experimental programs at the SPS and RHIC facilities have pro-vided valuable insights in this range. These proceedings motivate the exploration of the QCD phase diagram through the use of strangeness. A selection of relevant experimental results from RHIC and SPS beam energy scan programs with associated theoretical pre-dictions is presented along with a discussion of possible physical conclusions and future plans.
1 Introduction
Finite temperature lattice Quantum Chromodynamics (QCD) calculations predict [1] a cross-over from a hadronic to a QGP phase at a vanishing baryon chemical potentialµB and temperatureT =
154±9 MeV [2]. Several QCD-based calculations [3, 4] show that at lower T and higherµB a first-order phase transition may take place. The point in the QCD phase diagram, where the first order phase transition ends, is the QCD critical point [5]. In the low-T, and low and intermediate
µB phase, interacting hadronic matter in the ground state can be well described in terms of a gas of non-interacting hadrons and resonances - the Hadron Resonance Gas (HRG) model [6].
The availability of more precise experimental data now allows to better discriminate between models. The lattice QCD prediction power is still very limited at non-zeroµB, hence, experimental exploration becomes especially vital. These proceedings will focus on discussion of the intermediate
µB region, which covers a wideµB range, roughly spanning between 100 MeV and 700 MeV. The intermediate baryon densityµB region is accessible through experiments at Relativistic Heavy Ion Collider (RHIC), Super Proton Synchrotron (SPS), and in the future Facility for Antiproton and Ion Research (FAIR) which will be able to access also highµB region. Both SPS and RHIC have been running centre-of-mass energy √sNNand system size scans to fully explore the region.
One of the most important experimental tools to probe the QCD phase diagram is the study of strange particle production. Strange quarks are strongly interacting particles from the second quark flavor generation. In a QGP, strangeness can be easily produced as strange-antistrange quark pairs via gluon-gluon or quark-antiquark fusion [7], where the minimum momentum transferQfor this
e-mail: [email protected]
process isQ ≈200 MeV, while the lowest Qprocess in a hadron gas,n+n −→ n+ Λ +K, needs
670 MeV. Strangeness is also abundant since nearly 20% of all energy content of QGP is transferred to the production of strangeness when chemical equilibrium is reached [8].
Studies of strange hadron production in the energy and system size scans help to understand many crucial questions; to name a few: what is the temperature and density of strongly interacting matter formed in heavy ion collisions, what types of phase transitions occur, is there a critical point in the QCD phase diagram, and at which collision energy do the QGP signals turn off.
The next sections will present a selection of experimental results and theoretical calculations rel-evant to the discussion.
2 Selection of Experimental Results and Theoretical Calculations
2.1 Flavor Hierarchy in the Deconfinement Transition of QCD
sqm2011˙preghenella printed on December 1, 2011
7
+
π
/
-π K-/K+ p/p
0.5 0.6 0.7 0.8 0.9 1 1.1 1.2 1.3
= 2.76 TeV (ALICE Pb-Pb)
NN
s
= 200 GeV (STAR Au-Au)
NN
s
= 200 GeV (PHENIX Au-Au)
NN
s
ALICE Preliminary 0-5% centrality
particle ratio
-4
10
-3
10
-2
10
-1
10
Data: ALICE, 0-20% (preliminary) Model calc. with parameters:
= 1 MeV fixed) b
! T=148 MeV, (
= 1 MeV b ! T=164 MeV,
=2.76 TeV
NN
s Pb-Pb
+ !
/
+
K K-/!- p/!+ p/!- "-/!+ +/!
-" #-/!+ +/! -#
Preliminary
Fig. 5. Antiparticle/particle production ratios in the 0-5% most central Pb–Pb
collisions [9] (left). Hadron-production ratios compared to thermal model
predic-tions [10] (right).
flow
v
2to the same model [13]. A new calculation has been performed
us-ing a hybrid model which adds a hadronic rescatterus-ing and freeze-out stage
to the viscous dynamics [14]. These new predictions [15] are compared to
the data in Figure 4 (bottom) and the agreement with the proton shape
is better than in a pure hydrodynamic picture. This suggests that extra
flow builds up in the hadronic phase. The difference in the proton yield
can be ascribed to the fact that the model derives yields from a thermal
model with
T
ch= 165 MeV. It is worth to mention that this model also
reproduces the shape of elliptic flow of identified particles as reported at
this conference [16].
Antiparticle/particle integrated production ratios are observed to be
consistent with unity for all particle species in all centralities suggesting
that the baryo-chemical potential
µ
Bis close to zero as expected at LHC
energies. Figure 5 (left) compares ALICE results with RHIC data in Au–Au
collisions at
√
s
NN= 0.2 TeV [9] for the 0-5% most central collisions. The
p
T-integrated K
−/π
−and ¯p
/π
−ratios and the production of multi-strange
baryons in Pb–Pb collisions were also reported at this conference (see [17]
and [18], respectively). The K
−/π
−production nicely follows the trend
measured at RHIC. The ¯p
/π
−production ratio (
∼
0.05) is significantly
lower that the value expected from statistical model predictions (
∼
0.07-0.09) with a chemical freeze-out temperature of
T
ch= 160
−
170 MeV at
the LHC [10]. The measured yields of several particles normalized to the
pion yield in 0-5% central collisions are compared to thermal model
predic-tions in Figure 5 (right). With a temperature of
T
ch= 164 MeV predicted
by Andronic
et al.
[10] the model reproduces both kaon and multi-strange
baryon production but overestimates the protons. The same model can be
tuned to reproduce proton yields with an ad-hoc
T
ch= 148 MeV, though
4
multi-strange hadrons is enhanced in a
com-bination with higher
@@µs
derivatives, like
s
2
or
w
, whereas
v
1and
v
2signal the liberated
strangeness from all strange hadrons equally.
For the sake of defining observables which
can, in principle, be measured in experiments,
we focus on more basic susceptibility
combina-tions. The most attractive quantity to the
pur-pose is
f4
/
f
2
, since the ratio does not depend
on the volume. Similar ratios have been
pro-posed to determine the chemical freeze-out
tem-perature independent of any statistical model
assumptions [18–20]. Its non-monotic behavior
as a function of the temperature has also been
suggested as an indicator for the deconfinement
transition [21]. Fig. 3 shows the
T
-dependence
of
4/
2for light and strange quarks. For
the light quark susceptibilities (thus for
observ-ables related to net up+down quark numbers)
the pion contribution, which is notoriously
dif-ficult to calculate on the lattice, is absent by
definition. The figure shows two
characteris-tic features: a) each latcharacteris-tice calculation exhibits
a kink (or peak) at a particular temperature
and b) this kink coincides with the
tempera-ture at which the lattice curve starts to
devi-ate from the HRG predictions. Interestingly
enough, the separation between the kinks of the
two flavors corresponds to the previously
men-tioned
⇡
15 MeV. In a scenario, in which the
highest temperature where the HRG and lattice
QCD agree is indicating a “deconfinement” or
“liberation” temperature for a particular flavor
Fig. 3 further supports the flavor separation of
the characteristic temperatures.
The presented lattice results show that these
quantities, if measured with high accuracy, are
good thermometers. The challenge is to
unam-biguously demonstrate such a flavor hierarchy
experimentally. The e↵ect could manifest
it-self to first order in the multiplicity distribution
of identified particles. In case strange hadrons
form at a higher temperature than their light
quark counterparts, their abundance will be
en-hanced relative to a common low temperature
freeze-out scenario. Therefore, the comparison
of measured yields to a statistical hadronization
model enables one to determine chemical
freeze-out temperatures (T
ch) in a flavor-separated
0 0.5 1 1.5 2 2.5
130 140 150 160 170 180 190
T [MeV]
strange quark χ4/χ2
light quark χ4/χ2
HRG prediction for the strange quark for the light quarks
FIG. 3. The T-dependence of the 4/ 2 ratio for
light and strange quarks in the continuum limit. The lattice data are compared to HRG calculations.
way. First results from ALICE indicate that the
T
chof strange hadrons is about 16 MeV higher
than that of light hadrons (164 vs 148 MeV)
[7, 8]. As in the case of the lattice parameters,
this sensitivity to the freeze-out temperature,
extracted from a statistical hadronization fit, is
most pronounced for the multi-strange baryons.
These temperature fits are model-dependent,
though, and a direct comparison to the
tem-peratures extracted from quark susceptibilities
in lattice QCD likely requires corrections. For
example, it was suggested that final state
in-teractions between hadrons might modify the
baryon yields [22, 23].
A more precise verification, less prone to
al-ternate explanations, can be obtained by
us-ing a higher order moment analysis of
parti-cle identified yields, since those moments can
be directly related to the higher order
suscep-tibilities on the lattice [18]. In particular, the
product of kurtosis and the square of the
vari-ance of the net multiplicity distributions
cor-responds to the susceptibility ratio shown in
Fig. 3. Even for this analysis, though, the
caveat is the exact relation between the
quark-based observable and the hadron-quark-based
mea-surement. Specifically, one needs to determine
how many hadron species have to be measured
in order to fully capture the transition
behav-ior of the respective quark flavor. Preliminary
studies show that taking into account only the
dominant mesonic states is not sufficient.
Bary-onic states require significant acceptance and
efficiency corrections, though, even under the
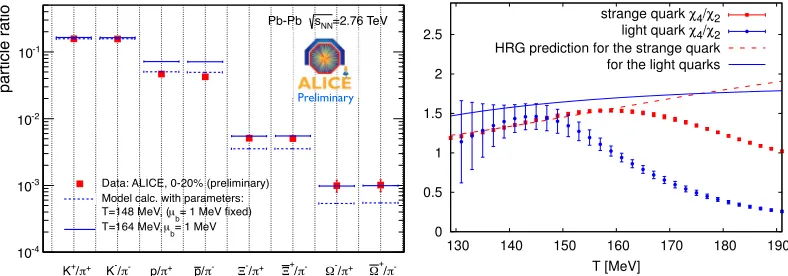
Figure 1. Left panel: Hadron-production ratios from Pb+Pb collisions at √sNN =2.76 TeV compared to the
statistical hadronization model predictions with parametersT =148,164 MeV andµB =1 MeV. Right Panel:
TheT dependence of the susceptibility ratiosχ2/χ4 for light and strange quarks in the continuum limit. The
lattice data are compared to HRG calculations. Left panel taken from Ref [9] and right panel from Ref [15].
At the Strangeness in Quark Matter conference 2011, the ALICE Collaboration has presented re-sults of particle production ratios [9]:K+/π+,K−/π−,p/π+,p¯/π−,Ξ−/π+,Ξ+/π−,Ω−/π+, andΩ+/π−, (i.e., ratios of strange-to-light and light-to-light hadrons) together with their thermal statistical model predictions [10, 11] at chemical freeze-out temperatures ofTch=164 and 148 MeV. As shown in Fig.
1 (left panel), the thermal model prediction withTch=164 MeV describes the strange-to-light ratios
while the prediction withTch=148 MeV describesp/π+,p¯/π−,K+/π+,andK−/π−. This is indicative of a separation of chemical freeze-out temperatures between light and strange quark hadrons. Since the ALICE results came from Pb+Pb collisions at√sNN=2.7 TeV, theµBwas nearly 0 and the results are suited for comparisons with lattice QCD calculations of higher order quark number susceptibili-tiesχn[12–14] for light and strange quarks [15]. Figure 1 (right panel) shows the dependency of the susceptibility ratiosχ4/χ2 for light and strange quarks on temperatureT together with
correspond-ing HRG model predictions. The critical temperatureTcis assumed to be the temperature where the lattice QCD calculatedχ4/χ2 and HRG prediction begin to differ. The choice of susceptibility ratio
has two advantages. The susceptibility ratio cancels finite volume effects and is proportional to some
2
EPJ Web of Conferences 171, 02002 (2018) https://doi.org/10.1051/epjconf/201817102002
process is Q≈200 MeV, while the lowest Qprocess in a hadron gas,n+n −→n+ Λ +K, needs
670 MeV. Strangeness is also abundant since nearly 20% of all energy content of QGP is transferred to the production of strangeness when chemical equilibrium is reached [8].
Studies of strange hadron production in the energy and system size scans help to understand many crucial questions; to name a few: what is the temperature and density of strongly interacting matter formed in heavy ion collisions, what types of phase transitions occur, is there a critical point in the QCD phase diagram, and at which collision energy do the QGP signals turn off.
The next sections will present a selection of experimental results and theoretical calculations rel-evant to the discussion.
2 Selection of Experimental Results and Theoretical Calculations
2.1 Flavor Hierarchy in the Deconfinement Transition of QCD
sqm2011˙preghenella printed on December 1, 2011
7
+
π
/
-π K-/K+ p/p
0.5 0.6 0.7 0.8 0.9 1 1.1 1.2 1.3
= 2.76 TeV (ALICE Pb-Pb)
NN
s
= 200 GeV (STAR Au-Au)
NN
s
= 200 GeV (PHENIX Au-Au)
NN s ALICE Preliminary 0-5% centrality particle ratio -4 10 -3 10 -2 10 -1 10
Data: ALICE, 0-20% (preliminary) Model calc. with parameters:
= 1 MeV fixed) b
! T=148 MeV, (
= 1 MeV b ! T=164 MeV, =2.76 TeV NN s Pb-Pb + ! / +
K K-/!- p/!+ p/!- "-/!+ +/!
-" #-/!+ +/! -#
Preliminary
Fig. 5. Antiparticle/particle production ratios in the 0-5% most central Pb–Pb
collisions [9] (left). Hadron-production ratios compared to thermal model
predic-tions [10] (right).
flow
v
2to the same model [13]. A new calculation has been performed
us-ing a hybrid model which adds a hadronic rescatterus-ing and freeze-out stage
to the viscous dynamics [14]. These new predictions [15] are compared to
the data in Figure 4 (bottom) and the agreement with the proton shape
is better than in a pure hydrodynamic picture. This suggests that extra
flow builds up in the hadronic phase. The difference in the proton yield
can be ascribed to the fact that the model derives yields from a thermal
model with
T
ch= 165 MeV. It is worth to mention that this model also
reproduces the shape of elliptic flow of identified particles as reported at
this conference [16].
Antiparticle/particle integrated production ratios are observed to be
consistent with unity for all particle species in all centralities suggesting
that the baryo-chemical potential
µ
Bis close to zero as expected at LHC
energies. Figure 5 (left) compares ALICE results with RHIC data in Au–Au
collisions at
√
s
NN= 0.2 TeV [9] for the 0-5% most central collisions. The
p
T-integrated K
−/π
−and ¯p
/π
−ratios and the production of multi-strange
baryons in Pb–Pb collisions were also reported at this conference (see [17]
and [18], respectively). The K
−/π
−production nicely follows the trend
measured at RHIC. The ¯p
/π
−production ratio (
∼
0.05) is significantly
lower that the value expected from statistical model predictions (
∼
0.07-0.09) with a chemical freeze-out temperature of
T
ch= 160
−
170 MeV at
the LHC [10]. The measured yields of several particles normalized to the
pion yield in 0-5% central collisions are compared to thermal model
predic-tions in Figure 5 (right). With a temperature of
T
ch= 164 MeV predicted
by Andronic
et al.
[10] the model reproduces both kaon and multi-strange
baryon production but overestimates the protons. The same model can be
tuned to reproduce proton yields with an ad-hoc
T
ch= 148 MeV, though
4
multi-strange hadrons is enhanced in a
com-bination with higher
@@µs
derivatives, like
s
2
or
w
, whereas
v
1and
v
2signal the liberated
strangeness from all strange hadrons equally.
For the sake of defining observables which
can, in principle, be measured in experiments,
we focus on more basic susceptibility
combina-tions. The most attractive quantity to the
pur-pose is
f4
/
f
2
, since the ratio does not depend
on the volume. Similar ratios have been
pro-posed to determine the chemical freeze-out
tem-perature independent of any statistical model
assumptions [18–20]. Its non-monotic behavior
as a function of the temperature has also been
suggested as an indicator for the deconfinement
transition [21]. Fig. 3 shows the
T
-dependence
of
4/
2for light and strange quarks. For
the light quark susceptibilities (thus for
observ-ables related to net up+down quark numbers)
the pion contribution, which is notoriously
dif-ficult to calculate on the lattice, is absent by
definition. The figure shows two
characteris-tic features: a) each latcharacteris-tice calculation exhibits
a kink (or peak) at a particular temperature
and b) this kink coincides with the
tempera-ture at which the lattice curve starts to
devi-ate from the HRG predictions. Interestingly
enough, the separation between the kinks of the
two flavors corresponds to the previously
men-tioned
⇡
15 MeV. In a scenario, in which the
highest temperature where the HRG and lattice
QCD agree is indicating a “deconfinement” or
“liberation” temperature for a particular flavor
Fig. 3 further supports the flavor separation of
the characteristic temperatures.
The presented lattice results show that these
quantities, if measured with high accuracy, are
good thermometers. The challenge is to
unam-biguously demonstrate such a flavor hierarchy
experimentally. The e↵ect could manifest
it-self to first order in the multiplicity distribution
of identified particles. In case strange hadrons
form at a higher temperature than their light
quark counterparts, their abundance will be
en-hanced relative to a common low temperature
freeze-out scenario. Therefore, the comparison
of measured yields to a statistical hadronization
model enables one to determine chemical
freeze-out temperatures (T
ch) in a flavor-separated
0 0.5 1 1.5 2 2.5
130 140 150 160 170 180 190
T [MeV]
strange quark χ4/χ2
light quark χ4/χ2
HRG prediction for the strange quark for the light quarks
FIG. 3. The T-dependence of the 4/ 2 ratio for
light and strange quarks in the continuum limit. The lattice data are compared to HRG calculations.
way. First results from ALICE indicate that the
T
chof strange hadrons is about 16 MeV higher
than that of light hadrons (164 vs 148 MeV)
[7, 8]. As in the case of the lattice parameters,
this sensitivity to the freeze-out temperature,
extracted from a statistical hadronization fit, is
most pronounced for the multi-strange baryons.
These temperature fits are model-dependent,
though, and a direct comparison to the
tem-peratures extracted from quark susceptibilities
in lattice QCD likely requires corrections. For
example, it was suggested that final state
in-teractions between hadrons might modify the
baryon yields [22, 23].
A more precise verification, less prone to
al-ternate explanations, can be obtained by
us-ing a higher order moment analysis of
parti-cle identified yields, since those moments can
be directly related to the higher order
suscep-tibilities on the lattice [18]. In particular, the
product of kurtosis and the square of the
vari-ance of the net multiplicity distributions
cor-responds to the susceptibility ratio shown in
Fig. 3. Even for this analysis, though, the
caveat is the exact relation between the
quark-based observable and the hadron-quark-based
mea-surement. Specifically, one needs to determine
how many hadron species have to be measured
in order to fully capture the transition
behav-ior of the respective quark flavor. Preliminary
studies show that taking into account only the
dominant mesonic states is not sufficient.
Bary-onic states require significant acceptance and
efficiency corrections, though, even under the
Figure 1. Left panel: Hadron-production ratios from Pb+Pb collisions at √sNN =2.76 TeV compared to the
statistical hadronization model predictions with parametersT =148,164 MeV andµB =1 MeV. Right Panel:
TheT dependence of the susceptibility ratiosχ2/χ4 for light and strange quarks in the continuum limit. The
lattice data are compared to HRG calculations. Left panel taken from Ref [9] and right panel from Ref [15].
At the Strangeness in Quark Matter conference 2011, the ALICE Collaboration has presented re-sults of particle production ratios [9]:K+/π+,K−/π−,p/π+,p¯/π−,Ξ−/π+,Ξ+/π−,Ω−/π+, andΩ+/π−, (i.e., ratios of strange-to-light and light-to-light hadrons) together with their thermal statistical model predictions [10, 11] at chemical freeze-out temperatures ofTch=164 and 148 MeV. As shown in Fig.
1 (left panel), the thermal model prediction withTch=164 MeV describes the strange-to-light ratios
while the prediction withTch=148 MeV describesp/π+,p¯/π−,K+/π+,andK−/π−. This is indicative of a separation of chemical freeze-out temperatures between light and strange quark hadrons. Since the ALICE results came from Pb+Pb collisions at√sNN=2.7 TeV, theµBwas nearly 0 and the results are suited for comparisons with lattice QCD calculations of higher order quark number susceptibili-tiesχn[12–14] for light and strange quarks [15]. Figure 1 (right panel) shows the dependency of the susceptibility ratiosχ4/χ2 for light and strange quarks on temperatureT together with
correspond-ing HRG model predictions. The critical temperatureTcis assumed to be the temperature where the lattice QCD calculatedχ4/χ2 and HRG prediction begin to differ. The choice of susceptibility ratio
has two advantages. The susceptibility ratio cancels finite volume effects and is proportional to some
experimental observables which will be discussed later. As one can observe from from Fig. 1 (right panel), theTc≈160 MeV for strange quarks differ from theTc≈145 MeV for the light quarks and both are very close to the corresponding Tchfrom the thermal statistical model predictions for the
ALICE data. This suggests a flavor hierarchy in the deconfinement transition of QCD.
The previous paragraph introduces a flavor hierarchy in the deconfinement transition of QCD at lowµB. At intermediateµB a pattern has been observed similar to ALICE’s observations at lowµB. The STAR Collaboration recently published [16] its results on bulk properties from the RHIC BES. Figure 2 shows the comparison of extracted freeze-out parameters in Au+Au collisions at √sNN=39 GeV for a Grand Canonical Ensemble (GCE) using particle yields as input to the THERMUS model [17]. Results were compared for four different sets, specified in the legend of Fig. 2, of particle yields
used as input for fitting. When onlyπ,K, andpyields are used in the fit, the temperature obtained is
lower compared to other sets that include strange hadron yields.
0 100 200 300
(MeV)
ch
T
100
120
140
160
180
200
= 0
Qµ
Qµ
Constrain
Sµ
,
Qµ
Constrain
Au+Au 7.7 GeV (GCE)
0 100 200 300
100
120
140
160
180
200
Au+Au 19.6 GeV (GCE)
0 100 200 300
100
120
140
160
180
200
Au+Au 39 GeV (GCE)
0
100
200
300
(MeV)
B
µ
0
100
200
300
400
〉
part
N
〈
0
100
200
300
0
100
200
300
400
0
100
200
300
0
100
200
300
400
FIG. 34:
Choice on constraints:
Extracted chemical freeze-out temperature (top panels) and baryon chemical potential (bottom
panels) for GCE using particle yields as input for fitting. Results are compared for Au+Au collisions at
√
s
NN
=7.7, 19.6,
and 39 GeV for three initial conditions:
µ
Q
= 0,
µ
Q
constrained to
B/
2
Q
value, and
µ
Q
constrained to
B/
2
Q
along with
µ
S
constrained to 0. Uncertainties represent systematic errors.
〉
part
N
〈
0
50 100 150 200 250 300 350
(MeV)
ch
T
100
120
140
160
180
φ
,
Ω
,
S 0, K
Ξ
,
Λ
, K, p,
π
Ω
,
S 0, K
Ξ
,
Λ
, K, p,
π
Ξ
,
Λ
, K, p,
π
, K, p
π
Au+Au 39 GeV (GCE)
〉
part
N
〈
0
50 100 150 200 250 300 350
(MeV)
B
µ
0
50
100
150
φ
,
Ω
,
S 0, K
Ξ
,
Λ
, K, p,
π
Ω
,
S 0, K
Ξ
,
Λ
, K, p,
π
Ξ
,
Λ
, K, p,
π
, K, p
π
Au+Au 39 GeV (GCE)
〉
part
N
〈
0
50 100 150 200 250 300 350
s
γ
0
0.2
0.4
0.6
0.8
1
1.2
1.4
φ
,
Ω
,
S 0, K
Ξ
,
Λ
, K, p,
π
Ω
,
S 0, K
Ξ
,
Λ
, K, p,
π
Ξ
,
Λ
, K, p,
π
, K, p
π
Au+Au 39 GeV (GCE)
〉
part
N
〈
0
50 100 150 200 250 300 350
/ndf
2
χ
0
2
4
6
8
10
φ
,
Ω
,
S 0, K
Ξ
,
Λ
, K, p,
π
Ω
,
S 0, K
Ξ
,
Λ
, K, p,
π
Ξ
,
Λ
, K, p,
π
, K, p
π
Au+Au 39 GeV (GCE)
FIG. 35:
Choice on including more particles:
Extracted chemical freeze-out parameters for GCE using particle yields as input
for fitting. Results are compared for Au+Au collisions at
√
s
NN
=39 GeV for four different sets of particle yields used in fitting.
Uncertainties represent systematic errors.
Figure 2. Extracted chemical freeze-out temperature for GCE using particle yields as input for THERMUS model. Results are compared for Au+Au collisions at √sNN =39 GeV for four different sets of particle yields
used in fitting. Figure taken from Ref [16].
2.2 Cumulant Ratios of Net-Particle Multiplicity
Fluctuations of conserved quantities are sensitive observables in the study of phase transitions in the QCD matter and critical point [18]. UrQMD model [19] based studies of centrality and energy dependence of various order cumulants and cumulant ratios (up to fourth order) of proton, net-charge, and net-kaon multiplicity distributions in Au+Au collisions at √sNN =7.7, 11.5, 19.6, 27,
3
EPJ Web of Conferences 171, 02002 (2018) https://doi.org/10.1051/epjconf/201817102002
39, 62.4, and 200 GeV were presented in [18]. These calculations were compared with the data from RHIC Beam Energy Scan (BES) published in [20, 21].
A distribution function can be characterized by the various moments, such as meanM, variance
σ2, skewnessS, and kurtosisκ. The moments productsκσ2 andSσare directly related to the ratios
of various order susceptibilities as
κσ2=χ4
χ2 Sσ
= χ3
χ2
As mentioned in Sect. 2.1, using the ratios allows finite volume effects to nearly cancel out and
provides for a direct comparison with lattice QCD predictions. 8
0.6 0.8 1
(0.4,0.8),STAR
∈ T
p
(0.4,2),STAR
∈ T
p
(0.4,0.8),UrQMD
∈ T
p
(0.4,2),UrQMD
∈ T
p
Net-proton (a)
y<|0.5|
0 1
2 Net-kaon
<1.6(GeV/c), |y|<0.5
T
0.2<p (b)
5 67 10 20 30 100 200
0 10
|<0.5
η
< 2(GeV/c), |
T
0.2<p
Net-charge STAR
UrQMD Poisson
(c)
(GeV)
NN
S
/Skellam
σ
S
0 2
4 Net-proton pT∈∈(0.4,2),STAR (0.4,0.8),STAR T
p
(0.4,0.8),UrQMD
∈ T
p
(0.4,2),UrQMD
∈ T
p
|y|<0.5 (a)
2
−
0
2 Net-kaon
<1.6(GeV/c), |y|<0.5
T
0.2<p (b)
5 67 10 20 30 100 200
20
−
10
−
0 10
|<0.5
η
< 2(GeV/c), |
T
0.2<p
Net-charge
STAR UrQMD Poisson (c)
(GeV)
NN
S
2
σ
κ
FIG. 10: Energy dependence of cumulant ratios(Sσ,κσ2) of net-proton, net-charge and net-kaon multipliity distributions for
Au+Au collision at√sNN=7.7 to 200 GeV. The solid markers represent the results from STAR measurement, the open markers
represent results from UrQMD calculation. The dashed lines denote the Poisson expectations for the STAR data.
lision energies. The monotonic decrease when decreasing energies and strong suppression below unity at low ener-gies are consistent with the effects of the baryon number conservations.
VI. SUMMARY
Experimentally, fluctuations of conserved quantities have been applied to probe the signature of the QCD phase transition and critical point in heavy-ion colli-sions. To understand the non-critical contributions to the observables, we have performed detailed model cal-culations. In this paper, we present the centrality and energy dependence of the cumulants (C1 ∼ C4) and
their ratios (C3/C2 = Sσ, C4/C2 = κσ2) of net-proton,
net-charge and net-kaon multiplicity distributions with UrQMD model for Au+Au collision at√sN N=7.7, 11.5,
19.6, 27, 39, 62.4 and 200 GeV. The production mecha-nisms of the proton and kaon have a significant impact on the fluctuations of net-particles. For e.g, the interplay of the baryon stopping, pair production of proton and anti-proton, and the associate, pair production of theK+and K− at different energies. At low energies, the baryon
stopping of protons and associate production of kaons
play an important roles. Those will lead to big differences between the cumulants of particles and anti-particles dis-tributions, such as proton, anti-protons andK+,K−.
Fi-nally, the comparisons for the cumulant ratios (Sσ, κσ2)
of net-proton, net-charge and net-kaon multiplicity distri-butions have been made between the STAR data and the UrQMD calculations. Within the statistical uncertain-ties, the net-charge and net-kaon fluctuations measured by STAR experiment can be described by the UrQMD results. For the net-proton fluctuations, the STAR mea-sured κσ2 at 0-5% most central Au+Au collisions show
a clear non-monotonic energy dependence with a mini-mum around 20 GeV. This non-monotonic behavior can not be described by the UrQMD model, in which there has no critical physics implemented. The large suppres-sion of the net-proton fluctuations at low energies could be explained by the effects of baryon number conserva-tions. Although the physics of the QCD critical point is not implemented in the UrQMD simulation, the results from UrQMD calculations can provide us non-CP physics baselines and a qualitative estimation for the background contributions to the QCD critical point search in heavy-ion collisheavy-ions by using the fluctuatheavy-ions of the net-proton, net-kaon and net-charge numbers.
8
0.6 0.8 1
(0.4,0.8),STAR
∈
T
p
(0.4,2),STAR
∈
T
p
(0.4,0.8),UrQMD
∈
T
p
(0.4,2),UrQMD
∈
T
p
Net-proton (a)
y<|0.5|
0 1
2 Net-kaon
<1.6(GeV/c), |y|<0.5
T
0.2<p (b)
5 67 10 20 30 100 200
0 10
|<0.5
η
< 2(GeV/c), |
T
0.2<p
Net-charge STAR
UrQMD Poisson
(c)
(GeV)
NN
S
/Skellam
σ
S
0 2
4 Net-proton pT∈∈(0.4,0.8),STAR (0.4,2),STAR T
p
(0.4,0.8),UrQMD
∈
T
p
(0.4,2),UrQMD
∈
T
p
|y|<0.5 (a)
2
−
0
2 Net-kaon
<1.6(GeV/c), |y|<0.5
T
0.2<p (b)
5 67 10 20 30 100 200
20
−
10
−
0 10
|<0.5
η
< 2(GeV/c), |
T
0.2<p
Net-charge
STAR UrQMD Poisson (c)
(GeV)
NN
S
2
σ
κ
FIG. 10: Energy dependence of cumulant ratios(Sσ, κσ2) of net-proton, net-charge and net-kaon multipliity distributions for
Au+Au collision at√sNN=7.7 to 200 GeV. The solid markers represent the results from STAR measurement, the open markers
represent results from UrQMD calculation. The dashed lines denote the Poisson expectations for the STAR data.
lision energies. The monotonic decrease when decreasing energies and strong suppression below unity at low ener-gies are consistent with the effects of the baryon number conservations.
VI. SUMMARY
Experimentally, fluctuations of conserved quantities have been applied to probe the signature of the QCD phase transition and critical point in heavy-ion colli-sions. To understand the non-critical contributions to the observables, we have performed detailed model cal-culations. In this paper, we present the centrality and energy dependence of the cumulants (C1 ∼ C4) and
their ratios (C3/C2 = Sσ, C4/C2 = κσ2) of net-proton,
net-charge and net-kaon multiplicity distributions with UrQMD model for Au+Au collision at√sN N=7.7, 11.5,
19.6, 27, 39, 62.4 and 200 GeV. The production mecha-nisms of the proton and kaon have a significant impact on the fluctuations of net-particles. For e.g, the interplay of the baryon stopping, pair production of proton and anti-proton, and the associate, pair production of theK+and K− at different energies. At low energies, the baryon
stopping of protons and associate production of kaons
play an important roles. Those will lead to big differences between the cumulants of particles and anti-particles dis-tributions, such as proton, anti-protons andK+,K−.
Fi-nally, the comparisons for the cumulant ratios (Sσ,κσ2)
of net-proton, net-charge and net-kaon multiplicity distri-butions have been made between the STAR data and the UrQMD calculations. Within the statistical uncertain-ties, the net-charge and net-kaon fluctuations measured by STAR experiment can be described by the UrQMD results. For the net-proton fluctuations, the STAR mea-sured κσ2 at 0-5% most central Au+Au collisions show
a clear non-monotonic energy dependence with a mini-mum around 20 GeV. This non-monotonic behavior can not be described by the UrQMD model, in which there has no critical physics implemented. The large suppres-sion of the net-proton fluctuations at low energies could be explained by the effects of baryon number conserva-tions. Although the physics of the QCD critical point is not implemented in the UrQMD simulation, the results from UrQMD calculations can provide us non-CP physics baselines and a qualitative estimation for the background contributions to the QCD critical point search in heavy-ion collisheavy-ions by using the fluctuatheavy-ions of the net-proton, net-kaon and net-charge numbers.
Figure 3.Energy dependence of cumulant ratiosSσ(left panel),κσ2(right panel) of net-proton, net-charge, and net-kaon multiplicity distributions for the Au+Au collision at √sNN=7.7 to 200 GeV. The solid markers
repre-sent the results from the STAR measurement, the open markers reprerepre-sent results from the UrQMD calculation. The dashed lines denote the Poisson expectations for the STAR data. Figure taken from Ref [18].
Figure 3 shows the energy dependence of cumulant ratiosSσ, κσ2of net-proton, net-charge, and net-kaon multiplicity distributions of the 5% most central Au+Au collisions in RHIC BES energies
from the STAR experiment [20, 21] and UrQMD calculations [18]. The non-monotonic energy de-pendence of the net-protonκσ2 and net-kaonSσcontrasts with the monotonic behavior of UrQMD
4
EPJ Web of Conferences 171, 02002 (2018) https://doi.org/10.1051/epjconf/201817102002
39, 62.4, and 200 GeV were presented in [18]. These calculations were compared with the data from RHIC Beam Energy Scan (BES) published in [20, 21].
A distribution function can be characterized by the various moments, such as meanM, variance
σ2, skewnessS, and kurtosisκ. The moments productsκσ2andSσare directly related to the ratios
of various order susceptibilities as
κσ2=χ4
χ2 Sσ
=χ3
χ2
As mentioned in Sect. 2.1, using the ratios allows finite volume effects to nearly cancel out and
provides for a direct comparison with lattice QCD predictions. 8
0.6 0.8 1 (0.4,0.8),STAR ∈ T p (0.4,2),STAR ∈ T p (0.4,0.8),UrQMD ∈ T p (0.4,2),UrQMD ∈ T p Net-proton (a) y<|0.5| 0 1 2 Net-kaon <1.6(GeV/c), |y|<0.5 T 0.2<p (b)
5 67 10 20 30 100 200
0 10
|<0.5
η
< 2(GeV/c), |
T 0.2<p Net-charge STAR UrQMD Poisson (c) (GeV) NN S /Skellam σ S 0 2
4 Net-proton pT∈∈(0.4,2),STAR (0.4,0.8),STAR T p (0.4,0.8),UrQMD ∈ T p (0.4,2),UrQMD ∈ T p |y|<0.5 (a) 2 − 0 2 Net-kaon <1.6(GeV/c), |y|<0.5 T 0.2<p (b)
5 67 10 20 30 100 200
20 − 10 − 0 10 |<0.5 η
< 2(GeV/c), |
T 0.2<p Net-charge STAR UrQMD Poisson (c) (GeV) NN S 2 σ κ
FIG. 10: Energy dependence of cumulant ratios(Sσ,κσ2) of net-proton, net-charge and net-kaon multipliity distributions for
Au+Au collision at√sNN =7.7 to 200 GeV. The solid markers represent the results from STAR measurement, the open markers
represent results from UrQMD calculation. The dashed lines denote the Poisson expectations for the STAR data.
lision energies. The monotonic decrease when decreasing energies and strong suppression below unity at low ener-gies are consistent with the effects of the baryon number conservations.
VI. SUMMARY
Experimentally, fluctuations of conserved quantities have been applied to probe the signature of the QCD phase transition and critical point in heavy-ion colli-sions. To understand the non-critical contributions to the observables, we have performed detailed model cal-culations. In this paper, we present the centrality and energy dependence of the cumulants (C1 ∼ C4) and
their ratios (C3/C2 = Sσ, C4/C2 = κσ2) of net-proton,
net-charge and net-kaon multiplicity distributions with UrQMD model for Au+Au collision at√sN N=7.7, 11.5,
19.6, 27, 39, 62.4 and 200 GeV. The production mecha-nisms of the proton and kaon have a significant impact on the fluctuations of net-particles. For e.g, the interplay of the baryon stopping, pair production of proton and anti-proton, and the associate, pair production of theK+and K− at different energies. At low energies, the baryon
stopping of protons and associate production of kaons
play an important roles. Those will lead to big differences between the cumulants of particles and anti-particles dis-tributions, such as proton, anti-protons andK+,K−.
Fi-nally, the comparisons for the cumulant ratios (Sσ,κσ2)
of net-proton, net-charge and net-kaon multiplicity distri-butions have been made between the STAR data and the UrQMD calculations. Within the statistical uncertain-ties, the net-charge and net-kaon fluctuations measured by STAR experiment can be described by the UrQMD results. For the net-proton fluctuations, the STAR mea-sured κσ2 at 0-5% most central Au+Au collisions show
a clear non-monotonic energy dependence with a mini-mum around 20 GeV. This non-monotonic behavior can not be described by the UrQMD model, in which there has no critical physics implemented. The large suppres-sion of the net-proton fluctuations at low energies could be explained by the effects of baryon number conserva-tions. Although the physics of the QCD critical point is not implemented in the UrQMD simulation, the results from UrQMD calculations can provide us non-CP physics baselines and a qualitative estimation for the background contributions to the QCD critical point search in heavy-ion collisheavy-ions by using the fluctuatheavy-ions of the net-proton, net-kaon and net-charge numbers.
8 0.6 0.8 1 (0.4,0.8),STAR ∈ T p (0.4,2),STAR ∈ T p (0.4,0.8),UrQMD ∈ T p (0.4,2),UrQMD ∈ T p Net-proton (a) y<|0.5| 0 1 2 Net-kaon <1.6(GeV/c), |y|<0.5 T 0.2<p (b)
5 67 10 20 30 100 200
0 10
|<0.5
η
< 2(GeV/c), |
T 0.2<p Net-charge STAR UrQMD Poisson (c) (GeV) NN S /Skellam σ S 0 2
4 Net-proton pT∈∈(0.4,2),STAR (0.4,0.8),STAR T p (0.4,0.8),UrQMD ∈ T p (0.4,2),UrQMD ∈ T p |y|<0.5 (a) 2 − 0 2 Net-kaon <1.6(GeV/c), |y|<0.5 T 0.2<p (b)
5 67 10 20 30 100 200
20 − 10 − 0 10 |<0.5 η
< 2(GeV/c), |
T 0.2<p Net-charge STAR UrQMD Poisson (c) (GeV) NN S 2 σ κ
FIG. 10: Energy dependence of cumulant ratios(Sσ,κσ2) of net-proton, net-charge and net-kaon multipliity distributions for
Au+Au collision at√sNN=7.7 to 200 GeV. The solid markers represent the results from STAR measurement, the open markers
represent results from UrQMD calculation. The dashed lines denote the Poisson expectations for the STAR data.
lision energies. The monotonic decrease when decreasing energies and strong suppression below unity at low ener-gies are consistent with the effects of the baryon number conservations.
VI. SUMMARY
Experimentally, fluctuations of conserved quantities have been applied to probe the signature of the QCD phase transition and critical point in heavy-ion colli-sions. To understand the non-critical contributions to the observables, we have performed detailed model cal-culations. In this paper, we present the centrality and energy dependence of the cumulants (C1 ∼ C4) and
their ratios (C3/C2 = Sσ, C4/C2 = κσ2) of net-proton,
net-charge and net-kaon multiplicity distributions with UrQMD model for Au+Au collision at√sN N=7.7, 11.5,
19.6, 27, 39, 62.4 and 200 GeV. The production mecha-nisms of the proton and kaon have a significant impact on the fluctuations of net-particles. For e.g, the interplay of the baryon stopping, pair production of proton and anti-proton, and the associate, pair production of theK+and K− at different energies. At low energies, the baryon
stopping of protons and associate production of kaons
play an important roles. Those will lead to big differences between the cumulants of particles and anti-particles dis-tributions, such as proton, anti-protons andK+,K−.
Fi-nally, the comparisons for the cumulant ratios (Sσ,κσ2)
of net-proton, net-charge and net-kaon multiplicity distri-butions have been made between the STAR data and the UrQMD calculations. Within the statistical uncertain-ties, the net-charge and net-kaon fluctuations measured by STAR experiment can be described by the UrQMD results. For the net-proton fluctuations, the STAR mea-sured κσ2 at 0-5% most central Au+Au collisions show
a clear non-monotonic energy dependence with a mini-mum around 20 GeV. This non-monotonic behavior can not be described by the UrQMD model, in which there has no critical physics implemented. The large suppres-sion of the net-proton fluctuations at low energies could be explained by the effects of baryon number conserva-tions. Although the physics of the QCD critical point is not implemented in the UrQMD simulation, the results from UrQMD calculations can provide us non-CP physics baselines and a qualitative estimation for the background contributions to the QCD critical point search in heavy-ion collisheavy-ions by using the fluctuatheavy-ions of the net-proton, net-kaon and net-charge numbers.
Figure 3.Energy dependence of cumulant ratiosSσ(left panel),κσ2(right panel) of net-proton, net-charge, and net-kaon multiplicity distributions for the Au+Au collision at √sNN=7.7 to 200 GeV. The solid markers
repre-sent the results from the STAR measurement, the open markers reprerepre-sent results from the UrQMD calculation. The dashed lines denote the Poisson expectations for the STAR data. Figure taken from Ref [18].
Figure 3 shows the energy dependence of cumulant ratiosSσ, κσ2 of net-proton, net-charge, and net-kaon multiplicity distributions of the 5% most central Au+Au collisions in RHIC BES energies
from the STAR experiment [20, 21] and UrQMD calculations [18]. The non-monotonic energy de-pendence of the net-protonκσ2 and net-kaonSσcontrasts with the monotonic behavior of UrQMD
predictions. This discrepancy might suggest critical behavior since the critical physics was not im-plemented in the UrQMD. It is important to reduce uncertainties of these measurements, which is expected in RHIC BES phase II [22], to get to more conclusive results.
2.3 Study of the Onset of Deconfinement
Study of onset of deconfinement: K
±
/
fi
±
ratio energy dependence
“Horn” structure in Pb+Pb collisions was predicted (SMES) as a signature of onset of deconfinement
[GeV]
NN
s
1
10
210
40)
≈
(y
+π
/
+K
0
0.1
0.2
p+p NA61 (prelim.)Be+Be NA61 (prelim.)p+p RHIC p+p LHC
)
π
p+p world (4 Au+Au AGS Au+Au RHIC Pb+Pb SPS Pb+Pb LHC
[GeV]
NNs
1
10
210
40)
≈
(y
-π
/
-K
0
0.1
0.2
K
+/
fi
+dependence in p+p rapidly reaches a plateau at SPS energies (onset of deconfinement in p+p?)
Surprisingly the Be+Be points are very close to p+p! (where will be Ar+Sc and Xe+La?)
Antoni Aduszkiewicz (University of Warsaw, CERN) Recent results from NA61/SHINE Quark Matter, February 6–11, 2017 7 / 15
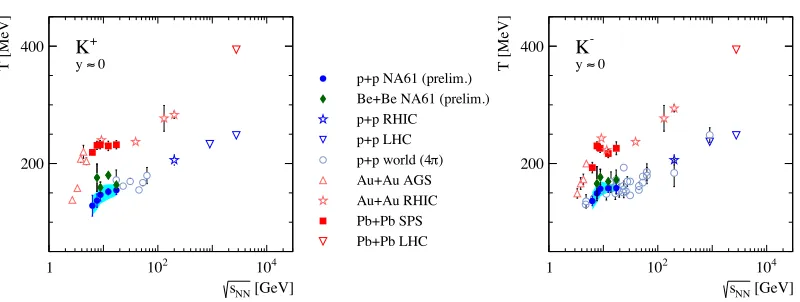
Figure 4.Energy dependence of the positively charged kaon multiplicity divided by corresponding charged pion multiplicity at mid-rapidity. Figure taken from Ref [23]
At the SPS, measurements of hadron production in a two-dimensional scan in beam momentum (13–158 AGeV/c) and system size (p+p, p+Pb, 7Be+9Be, Ar+Sc, Xe+La and Pb+Pb) were
con-ducted. New results from p+p and7Be+9Be were shown at Quark Matter 2017 conference [23],
presenting the energy dependence of theK+/π+multiplicity ratio at mid-rapidity. As shown in Fig. 4, the data from7Be+9Be do not show a "horn" structure as data from heavier collision system do
(average number of participants in7Be+9Be collisions is around 10). This observation constrains size
of system to study location of onset of deconfinement energy. The energy dependence of the inverse slope parameter of the transverse mass distribution of charged kaons, as shown in Fig. 5, shows the step structure in both p+p and7Be+9Be. The step structure was predicted by the Statistical Model of
the Early Stage (SMES) [24] and 3+1 Hydro model [25] as a signature of the onset of deconfinement.
The UrQMD based transport approach [26] provides further insights. It concludes that the "step" is only reproduced if a first order phase transition with a large latent heat is applied or the equation of state is effectively softened due to non-equilibrium effects in the hadronic transport calculation.
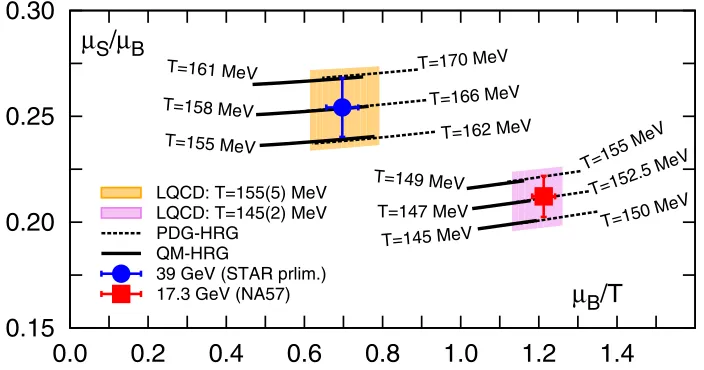
2.4 Ratios of The Freeze-out Parameters
The experimental results of ratios of the freeze-out parametersµS/µBandµB/T (µS is strange chem-ical potential) from the NA57 experiment [27] and the STAR experiment [28] can be reproduced by
Study of onset of deconfinement: transverse momentum spectra properties
Plateau (“step”) in the inverse slope parameter ofmTspectra at the SPS energies observed in Pb+Pb
was predicted (SMES) as a signature of phase transition
[GeV]
NN
s
1 102 104
T [MeV]
200
400 K+
0 ≈ y
p+p NA61 (prelim.) Be+Be NA61 (prelim.) p+p RHIC
p+p LHC ) π p+p world (4 Au+Au AGS Au+Au RHIC Pb+Pb SPS Pb+Pb LHC
[GeV]
NN
s
1 102 104
T [MeV]
200 400 K
0
≈
y
Step-like structure visible in p+p for K≠
Step in Be+Be slightly above p+p
Antoni Aduszkiewicz (University of Warsaw, CERN) Recent results from NA61/SHINE Quark Matter, February 6–11, 2017 6 / 15
Figure 5.Energy dependence of the inverse slope parameter of the transverse mass distribution at mid-rapidity for charged kaons. The NA61/SHINE results on p+p interactions (full blue circles) and new results on Be+Be
(full green diamonds) collisions are compared with world data on p+p and heavy ion (Pb+Pb and Au+Au)
reactions. Figure taken from Ref [23]
a HRG model, as discussed in [29]. The HRG model prediction is in better agreement with lattice QCD calculations [29] if additional (strange) hadron resonances are included which are predicted by the quark model [30, 31] but until today unobserved (such a setup of the HRG model is denoted as QM-HRG). TheµS/µB andµB/T ratios were obtained by a statistical thermal model [32] fitting data for strange-baryon ratiosΛ/Λ,Ξ+/Ξ−, andΩ+/Ω−and are shown in Fig. 6 together with lattice QCD predictions, and HRG predictions. One HRG predictions assumes only experimentally discov-ered hadrons (PDG-HRG) and another is the QM-HRG. As Fig. 6 presents, the QM-HRG predictions match the experimental data and the lattice QCD at the temperatures consistent with the lattice QCD and the data while the PDG-HRG matches at temperatures significantly higher. Hence, it appears that additional, experimentally yet-to-be observed strange hadrons become thermodynamically relevant in the vicinity of the QCD crossover.
3 Summary and Future Plans
Recent results shown at this conference have underlined once again the relevance of the study of strangeness at intermediateµB. There are indications of flavor hierarchy with respect to the chemi-cal freeze-out [33]. Hadrons containing strange quarks appear to hadronize earlier than the hadrons containing only quarks from the first generation. This has been predicted by lattice QCD atµB =0 and experimentally observed by the ALICE Collaboration [9] as well as at the intermediateµBby the STAR Collaboration [16].
In order to describe the freeze-out parameter ratios consistently with the experimental results from STAR and NA57, a Hadron Resonance Gas needs to assume additional, yet-to-be observed strange hadrons. The experimental results are also predicted by lattice QCD.
The NA61 Collaboration has shown intriguing results from7Be+9Be collisions. A comparison
with its results onK+/π+ratios shows a remarkably similar structure, which departs from the "horn". The RHIC BES Phase II is scheduled in years 2019 and 2020. It will provide substantially higher statistics thanks to the accelerator upgrades [22]. Detector upgrades will further reduce systematic uncertainties of measurements. The fixed target program at STAR will allow for the QCD phase
6
EPJ Web of Conferences 171, 02002 (2018) https://doi.org/10.1051/epjconf/201817102002