CGG 2014 July Presentation
All results are presented before Non-Recurring Items linked to Fugro (NRFI) and before impairment & write-off, unless stated otherwise
Catherine Leveau, SVP IR : [email protected] Julie Coulot, IR & SRI Officer : [email protected]
Forward Looking Statements
This presentation contains forward-looking statements, including, without limitation, statements about CGG (“the Company”) plans, strategies and prospects. These forward-looking statements are subject to risks and uncertainties that may change at any time, and, therefore, the Company’s actual results may differ materially from those that were expected. The Company based these forward-looking statements on its current assumptions, expectations and projections about future events. Although the Company believes that the expectations reflected in these forward-looking statements are reasonable, it is very difficult to predict the impact of known factors and it is impossible for us to anticipate all factors that could affect our proposed results. All forward-looking statements are based upon information available to the Company as of the date of this presentation. Important factors that could cause actual results to differ materially from management's expectations are disclosed in the Company’s periodic reports and registration statements filed with the SEC and the AMF. Investors are cautioned not to place undue reliance on such forward-looking statements.
Agenda
1.
CGG at a glance : An integrated business model
2.
Equipment Division
3.
Acquisition Division
4.
GGR Division
5.
Financial Review
6.
Conclusion
3CGG at a glance:
Integrated business model
Revenues split by activity(3)
Revenues split by region(2)
Market leader in geoscience industry globally, providing a comprehensive range of leading geological, geophysical and reservoir capabilities
Market capitalisation of c.$2.5bn (as of July 1st 2014) c.9,500(1) staff working across the globe
Equipment
Sercel, CGG’s Equipment division, is the world-leading designer and manufacturer of land and marine seismic equipment and reservoir monitoring instruments Acquisition
Geophysical data acquisition services include land, marine, airborne and seabed, being operated either directly or through joint ventures
Revenues: $3,766m(2) Net Debt: $2,218m Cash: $530m EBITDAS(4): $1,160m EBIT(5)(6): $423m Net Leverage:1.9x FY2013 Financials
(1)As of December 31, 2013 (2)Operating revenues (3)Revenues from unaffiliated customers (4)Excluding $20m non-recurring items linked to Fugro (NRFI) (5)Earnings before interest
and tax (6)Excluding $17m NRFI and $800m to Acquisition impairment and write-off
3 bu si ness acti vi ties Diversified business
CGG at a glance: An integrated business model
Geology, Geophysics & Reservoir (“GGR”) Key activities include developing and licensing multi-client seismic surveys, processing seismic data, data and software management, reservoir consulting services
From cyclical and capital-intensive businesses to more profitable, less capital intensive
and more cash generating businesses
Our strategy: 2014-2016 Transformation Plan
6
2013 revenues
(1):
$3.8bn
2016 revenues
(2): >
$4.0bn$3.8bn
Strong organic growth for equipment
GGR growth despite reduced MC capex
Equipme
nt
Revenues: $1,045m
Ebit margin: 28.0%
Capital Empl. $0.9bn
508XT & high-channel-count / mega crews
New generation of streamers
Revenues(2): : $1,2-1,3 bn
Ebit margin(2): >28.0%
(1)Operating revenues (2)Assuming unchanged market conditions
Ac
quis
ition Revenues: $2,226m
Ebit margin: 2.5%
Capital Empl. $2.4bn
High-end and flexible fleet & reduced costs
Land & Airborne successful turnarounds
Strengthened partnerships / JV
Revenues(2): $1,6-1,8bn
Ebit margin(2): 8-10% 25% reduction in marine fleet capacity
GGR
Revenues: $1,296m Ebit margin: 24.5% Capital Empl. $2.8bn
Expected future Gulf of Mexico lease sales Continued leadership in Subsurface Imaging Integrated Geosciences offerings & workflows
Revenues(2): $1,5-1,6bn Ebit margin(2): 20-25%
35% 35% 30%
Focus on Management actions
2014-2016 Transformation Plan on track
The Symphony vessel was de-rigged as planned
Ongoing reduction in the marine fleet and associated support structure
Restructuring of Land North America activity ongoing
7
Two successful refinancing operations conducted in April to extend debt maturity
Issue of a €400m Senior Notes due 2020 and of a US $500m Senior Notes due 2022
Full repurchase of the 2016 Convertible Bond, reimbursement of all the Senior Notes
due 2016 and 2/3 of the Senior Notes due 2017
Equipment Division
Equipment: Sercel a leading seismic equipment provider
Streamer:
Strong footprint in land, 70% market share in cable systems
Strong footprint in marine, 95% market share in
streamers
Maintain technological edge ahead of
competitors
Reliability of products, reactive customer
support
2013 Key Figures
Market Positioning
Main products
2013 Geographical sales
breakdown
Total sales $1,045m Number of employees c.2,500 R&D / Revenues 5.6% Number of sites 20 Nautilus Unite Sentinel NomadCable and wireless system:
Digital sensor: MaxiWave Downhole: Vibrator: EBIT $293m EBIT margin 28%
Equipment Division growth driven by Land equipment
markets
Marine driven by sustainable replacement
market
70% sales based on replacement or spread extension
Declining new builds markets
Land: more channels per conventional crew
Continuous channel count growth multiplied by 5every 10 years for conventional crews Number of crews increasing worldwide
508XT launched Q413, powerful response to clients needs, first deliveries July 2014
Middle East: seismic for production is key
5 to 9 tenders for high channels count crewsexpected in 2014-2016
Sercel: strategic supplier agreement with Argas, our historical long-term partner
2010 2011 2012 2013
km Sentinel® sold New builds
5 15 0 0 800 km Sentinel® sold New builds 1000 10 600 400 200 10
Sa
OMAN two potential tenders for 250 000 channel count crews expected in 2015-16?
KUWAITtwo tenders ongoing for 240 000 and 30 000 channels count crews
UAE onetender ongoing for 150 000 channel count crew
SAUDI ARABIA two tenders ongoing for 50 000 channel count crews
Evolution of the New Builds Market
Expected tenders of high channel count crews in the Middle East
Equipment profitability: Operating margin driven by
volumes and product mix
Sercel’s business model highly sensitive to volume sold and product mix
Higher electronic content leads to a higher operating margin
400 350 300 250 200 150 100 50 0 15% 20% 25% 30% 35% 40%
Revenue vs. % Operating Income
by quarter
11 0 200 400 600 800 1000 1200 1400 2008 2009 2010 2011 2012 2013 789 563 515 679 777 673 420 295 485 463 427 3720 1 209 858 1 000 1 142 1 204 1 045 32% 22% 29% 31% 32% 28% EBIT Margin Marine LandAcquisition Division
Acquisition: Ongoing right sizing
Among top 3 leaders with
WesternGeco, PGS
High-end player in Land acquisition A leading Airborne player with
25-30% market share
Market Positioning
2013 Key Figures
Total sales $2,226m Number of employees c.3,000 Industrial CAPEX $250m Vessel availability / productivity rate 89% / 92%Asset
Portfolio
17 3D vessels 13 high-capacity 3D vessels (12+ streamers) 4 mid-capacity 3D vessels (8-12 streamers)
15 land crews including 4 High-Channel-Count
crews
2 Arctic crews
20 fixed-wing aircrafts 1 helicopter
Marine
Land
Airborne
EBIT(1)
$56m
EBIT Margin(1)
2.5%
Oceanic Vega
20 Tow Points
Oceanic Sirius
20 Tow Points 16 Tow Points Geo Coral 16 Tow Points Geo Caspian
Oceanic Champion 14 Tow Points Geo Celtic 12 Tow Points Oceanic Challenger 12 Tow Points Viking Vision 14 Tow Points Viking 10 Tow Points Viking II 8 Tow Points Vantage 10 Tow Points Symphony 12 Tow Points Geowave Voyager 12 Tow Points Viking Vanquish 12 Tow Points Oceanic Endeavour 16 Tow Points Alizé
16 Tow Points Oceanic Phoenix
14 Tow Points
Geo Caribbean
14 Tow Points
Vessel in JV Amadeus 8 Tow Points
3D vessels after having de-rigged Symphony
& in JV
15
1
14
Strategic Roadmap: Reduction of the size of the fleet
Reformat the fleet down to the critical size of 13 vessels to:
Address global and regional markets and optimize transit time Operate during the winter campaign with positive cash contribution Be an enabler for Equipment & GGR divisionsUsed as source vessel De-rigged
Land Acquisition: Refocusing on niche & “techno” markets
& partnerships
15
North America: Refocused on our MC activity &
land contract ongoing restructuring
Rest of the World: Opportunities for franchising /
Technology consulting model
Middle East:
Strengthen our local partnership holding 49% of the new Argas
North Africa: Only direct footprint focus on
technology
The Land situation:
An enabler for Sercel and Processing activities with the right footprint considering the risks
Ramp up of the Seabed Geosolutions activity 40% JV with Fugro
GGR Division
GGR: Geology, Geophysics & Reservoir
Multi client library in key areas (Gulf of
Mexico, North Sea, Brazil)
Technology and broad spectrum of technical
expertise
Highly-skilled people business
Strong geosciences brand
2013 Key Figures
Market Positioning
Strong expertise in GGR
2% 4% 27% 36% 31% Master PhD High School Diploma Other/ Technical / Secondary Bachelor Subsurface Imaging (SI):
46 locations in 32 countries
GeoConsulting /
GeoSoftware:
Presence in 23 countries
Data Management Services:
Presence in 9 countries
Footprint per activity
Total sales
$1,296m: $585m Multi-client and $711m SI &
other businesses Number of employees c.3,500 Countries with GGR implantation 36 EBIT $317m EBIT margin 24.5%
For NALA:
Gulf Of Mexico– StagSeis DEUXFast Trax available – TROIS (293 blocks) being acquired
Brazil– Four new programs on going – 43,000km²of new BroadSeis data
For EAME:
Norway– HORDA: The Largest BroadSeis survey. Acquisition has started
in Norwegian North Sea
North Sea
– Innovative Technology with promising results
– DAZ (Dual Azimuth) on Q30 Phase 7 & 8
– TomoML, GWE, Pore Pressure Prediction and Facies Finder AVO. Cornerstone 35,000km²
Delivering the right data with the best available technology at the right time
20,000 km²
19,000km²
Multi-Client: Building librairies in key areas
18
3 years program started in July 2012 and finishing end 2014, ahead of 2016-2018 ultra-deep water licensing rounds
Subsurface Imaging: Maintaining our leadership position with our
high skilled people
64 k CPU Cores
84 k CPU Cores
95 k CPU cores
110 k CPU cores
160 k CPU cores
453 k GPU cores / 884 cards
150 k CPU cores
2150 k GPU cores / 3400 cards
CPU GPU 0 1 2 3 4 5 6 7 2008 2009 2010 2011 2012 2013
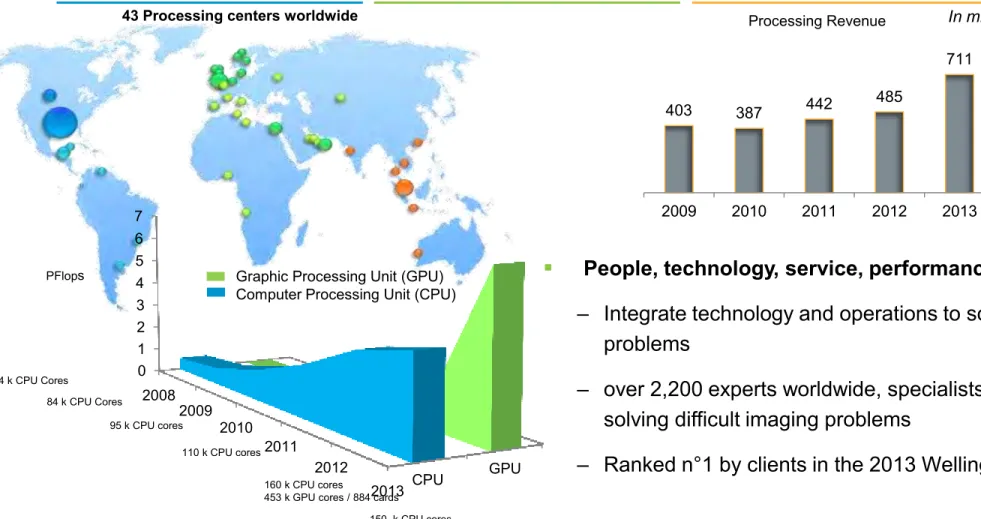
43 Processing centers worldwide
Growth driven by unique worldwide presence and technology leaps in computing
and imaging algorithms
PFlops 403 387 442 485 711 2009 2010 2011 2012 2013 Processing Revenue 19 In million $
Graphic Processing Unit (GPU) Computer Processing Unit (CPU)
People, technology, service, performance
– Integrate technology and operations to solve problems
– over 2,200 experts worldwide, specialists in solving difficult imaging problems
Geoconsulting and Geosoftware: Developing integrated
workflow
20
7.0%
Geoconsulting: offering integrated projects
Acknowledged leader in geopolitical multi-client
products and reports, and high-end consulting services across the E&P value chain
Integrated geophysics, geology & geochemistry
studies
Geosoftware: from seismic to simulation
Advanced reservoir characterization: integrating
seismic, well and production data to better de-risk prospects and further optimize production
Powered by Hampson-Russell and Jason
For unconventionals: tools to help for better well
planning (ProAz), predict sweet spots (Emerge) and to optimize well paths (FractureSpark)
Financial Review
Balance Sheet as of end of March 2014
22
Net Debt at $2.4bn by end of March 2014
Euro-denominated component at €1.0bn Net Debt to Equity ratio at 65%
Total Capital Employed at $6,279m as of end
of March
Multi-Client Library Book Value up at $916m
Increase mostly due to the IBALT program in
the Gulf of Mexico
Cash multi-client Capex pre-funded at 51% Amortization rate at 61%
23
In April, issue of two new
High Yield Bonds
…
€400m due 2020 at 5.875% coupon $500m due 2022 at 6.875% coupon
… to push-back 2016-2017
mandatory instalments
€360m 2016 Convertible Bond $225m 2016 Senior Notes 2/3 $400m 2017 Senior NotesAccelerated Refinancing Program with Senior Debt
Maturity extended by 2 years
A €400m High Yield Bond at 5.875% due 2020:
A $500m High Yield Bond at 6.875% due 2022:
2013 Senior Debt Maturity Profile (in $m)
Maturity as of end of
March extended to 6 years
from 4 years
Average cash cost of Debt
at 5.3%
New Notes 6.3% interest-weighted
on average
2014 Achievements & Outlook
25
Equipment
Sercel awarded the 1st tender in Saudi Arabia for 50 000 channels count crews in June 2014
1st deliveries of 508XT expected in July with the addition of a new system sold in June to PanAmerican
Geophysical in North America
Launch of two new tenders in Saudi Arabia for 50 000 channels count per crew
Acquisition
First steps of the rightsizing the fleet and the Land activity achieved and next ones well engaged First effects of these measures on our cost structure during H2
New set up with Argas operational in H2
CGG and Sovcomflot signed an agreement to create a JV for Arctic 3D seismic exploration, the legal
entity will be created in January 2015
GGR
Completion in September of the three year IBALT program in the GoM with the StagSeis technology
ahead of the 2016-2018 licensing rounds
Sustained activity in Subsurface Imaging driven by increasing volume of data linked to more complex
surveys
2014 Management priorities reaffirmed
Seismic market conditions expected to remain flattish
26
CGG management fully committed to implementing its 2014-2016 transformation plan
First steps in the Acquisition division downsizing plan in Q1 2014
Positive cash generation and active debt management
o 2014 Industrial Capex: $275-300m
o 2014 Multi-client Cash Capex: $500-550m o Prefunding level above 70%
Target 400 bps EBIT improvement in 2016o Rebalanced portfolio
o Operational & commercial efficiency o Cost reductions & tight cash management
Q1 2014 Results: In line with our expectations
28
Group Revenue at $806m, down 7% y-o-y
Equipment at $206m, down 18% GGR at $290m, up 12%
Acquisition at $559m, down 6%
Solid operational performance, notably in Marine
Fleet availability rate at 94% Fleet production rate at 93%
Operating Income at $35m
In line with our expectations
EBIT at $18m, including a $(17)m contribution
from the Equity from Investees
Mainly related to Seabed Geosolutions JV
Net Income at $(39)m
CGG backlog as of April 1
st:$1.2bn
Fleet coverage: 97% in Q2, 60% in Q3 & 10% in Q4
Q1 2013 Q4 2013 Q1 2014 Group Revenue (In million $) 871 806 955 Group EBIT (In million $) Q1 2013 Q4 2013 Q1 2014 128 117 66 73 18 35 Operating Income EBIT
Q1 2013 Q4 2013 Q1 2014
Equipment: 1Q14 Resilient despite lower revenues
29
Total sales were $206m, down 18%
External sales at $163m, down 14%
• Lower land sales across all regions following strong deliveries in Q4 2013
Internal sales represented 21% of total sales
versus 24% last year
51% marine equipment sales and 49% land
equipment sales
EBIT margin at 20.1%
Unfavorable € / $ exchange rate Low volume of sales
Unfavorable product mix with lower electronic
components for land equipment sales
EBIT (In million $) Q1 2013 Q4 2013 Q1 2014 69 102 41 20.1% 32.1% 27.6% Revenue (In million $) 251 317 206 Land Equipment Marine Equipment 51% 37% 63% 41% 54% 46% 49%
Acquisition 1Q 14: Still difficult market conditions
30
Acquisition revenue at $559m, down 6%
External revenue at $353m, down 16%
Land & Airborne revenue at $106m, down 26%
Record low winter campaign in North America Airborne impacted by still depressed mining market
Marine revenue at $453m, quite stable y-o-y and
up 25% sequentially
The Symphony was de-rigged as planned Solid operational performance
Acquisition Operating Income at breakeven and
EBIT at $(16)m
Marine profitability increased significantly sequentially due to an availability rate at 94% versus 83% in Q4 2013 Land acquisition suffered from a historically low winter
season
Negative contribution from Seabed Geosolutions JV
Acquisition Revenue (In million $) Q1 2013 Q4 2013 Q1 2014 568 559 459 363 453
Land & Airborne Marine Acquisition EBIT (In million $) 38 47 (69) (61) Q1 2013 Q4 2013 (2.8)% 7.9% (13.4)% Q1 2014 449 594 106 95 145 0 (16) Operating Income EBIT
Q1 2013 Q4 2013 Q1 2014
Q1 2013 Q4 2013 Q1 2014
GGR 1Q 14: Continuing Sustained Profitability
31
GGR revenue at $290m, up 12% y-o-y
Multi-Client at $127m, up 18% y-o-y, the best
Q1 performance since 2008
Prefunding revenue was $80m
Good level of after-sales in Canada & Brazil Amortization rate at 61%
Subsurface Imaging (SI) & Reservoir at
$163m, up 7% y-o-y
Subsurface Imaging: strong performance CGG and Baker Hughes signed an exclusive
agreement for RoqSCANTM technology
GGR EBIT at $63m, a 21.8% margin
Quite stable y-on-y, excluding the $20m
Spectrum capital gain
GGR Revenue (In million $) MC Revenue GGR EBIT (In million $) 108 166 127 152 206 163 260 371 290 SI & Reservoir 63 86 81 31.1%* 23.2% 21.8% EBIT margin $20m Spectrum capital gain
Q1 2014 Cash: A typical Q1 pattern
32 EBITDAs (In million $)
EBITDAs : $188m, a 23.4% margin
Equipment at $52m, a 25% margin Acquisition at $79m, a 14% margin GGR at $159m, a 55% margin
Cash Flow from Operations at $118m, up 87%
y-o-y
Total Capex of $258m
Industrial Capex: $86m R&D Capex: $16m
Multi-Client Cash Capex: $156m
• Marine Capex at $143m, up 20% y-o-y
(GoM program & Brazil)
• Cash prefunding rate at 51% versus 48% in Q1 2013
Negative Free Cash Flow at $(152)m
Operating Cash Flow / Capex
(In million $) Q1 2013 Q4 2013 Q1 2014 272 280 188 Q1 2013 Q4 2013 Q1 2014 203 63 451 231 258 31.3% 29.3% 23.4% 118 156
Operating Cash Flow Industrial
Multi-client cash capex R&D and other capex
95 117 86 126 65 12 19 16
2014-2016 Strategy: Rebalancing portfolio
33Equipment
Acquisition
GGR
Main Drivers
2013
$3.8bn Revenue
11% Ebit margin2016
>$4.0bn Revenue
15% Ebit margin Revenue: $1.2-1.3bn Ebit margin: >28% Revenue: $1.6-1.8bn Ebit margin: 8%-10% Revenue: $1.5-1.6bn Ebit margin: 20%-25% At unchanged market conditions Revenue before intra-group eliminations
Business line breakdown within Acquisition: Marine 80% / Land & Airborne 20%
Reformatting impact: at iso-market conditions
Intra-Group production: 25% of the fleet capacity corresponding to 20% of total Division revenue
“1.5” mega-crews ordered; when by the New ARGAS:
Fully booked in revenue and in cash, as acquired by a third party
Intra-Group production (marine mainly): c. 10% of total sales
2015 and onwards, MC Cash Capex back to c. $400m, 70%+ pre-funded
Depreciation rate at c. 65%, leading to a stable MC Library Net Book Value
SI & reservoir businesses organic growth sustained by 5% net hiring per year
22% 43% 35% 30% 35% 35%